
Market Overview:
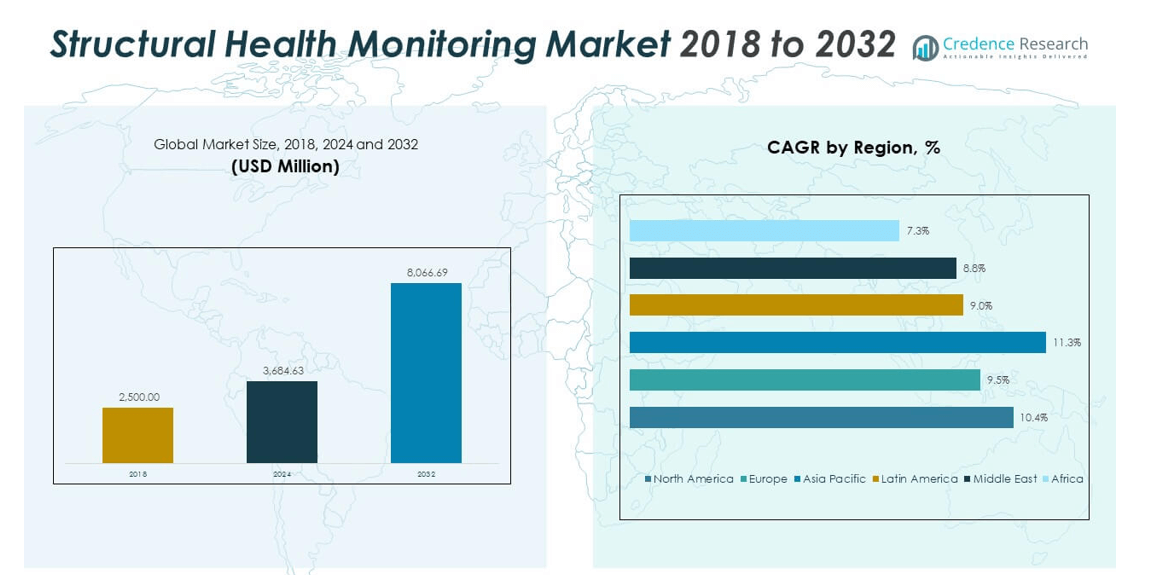
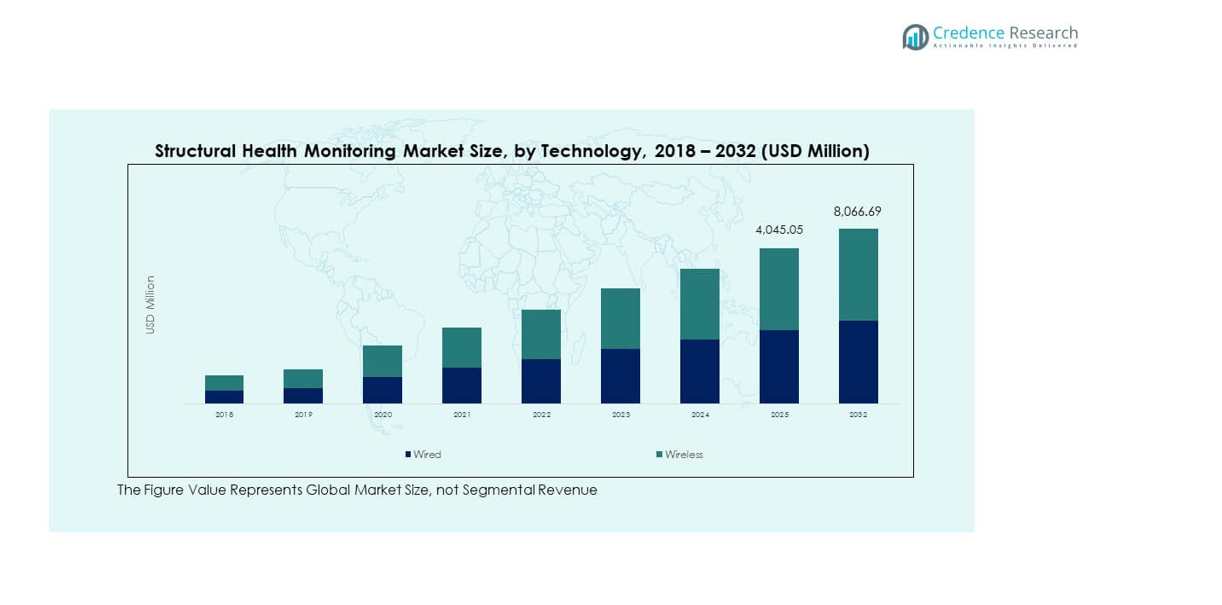
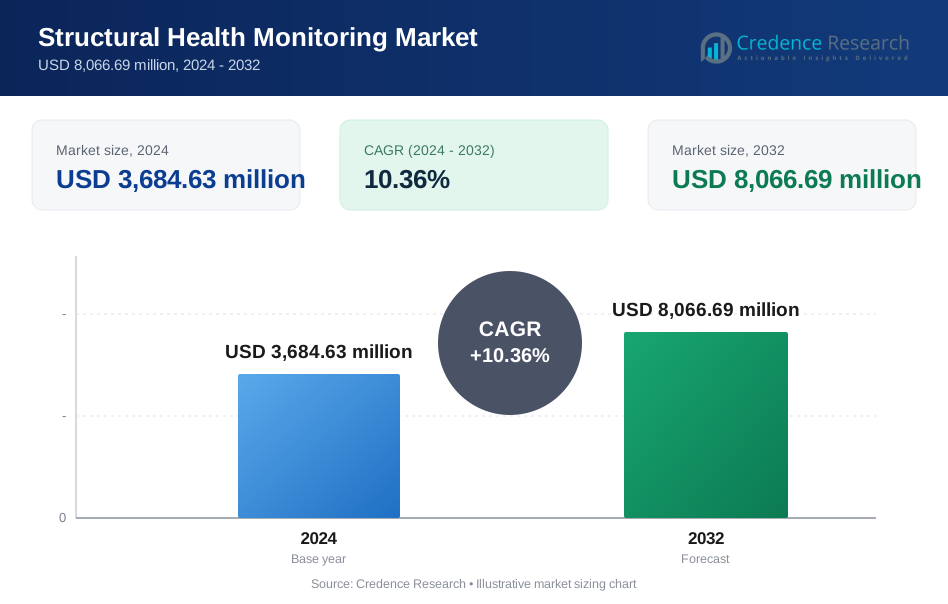
The Global Structural Health Monitoring Market size was valued at USD 2,500.00 million in 2018 to USD 3,684.63 million in 2024 and is anticipated to reach USD 8,066.69 million by 2032, at a CAGR of 10.36% during the forecast period.
| REPORT ATTRIBUTE | DETAILS |
|---|---|
| Historical Period | 2020-2023 |
| Base Year | 2024 |
| Forecast Period | 2025-2032 |
| Stretch Blow Molding Machines Market Size 2024 | USD 3,684.63 million |
| Stretch Blow Molding Machines Market, CAGR | 10.36% |
| Stretch Blow Molding Machines Market Size 2032 | USD 8,066.69 million |
The market grows due to rising focus on infrastructure safety and asset life extension. Governments enforce stricter safety checks for bridges, tunnels, and public buildings. Aging infrastructure increases the need for early damage detection. Sensor cost reduction improves large-scale deployment. Wireless systems simplify installation across complex structures. Data analytics improves fault prediction accuracy. Smart city projects support continuous monitoring adoption. Industrial operators seek downtime reduction through condition-based maintenance. These factors together strengthen long-term demand across sectors.
North America leads due to advanced infrastructure management practices and early technology adoption. The United States shows strong usage in bridges, highways, and energy assets. Europe follows with focus on rail safety and historic structure preservation. Countries like Germany and the UK drive steady deployment. Asia Pacific emerges as the fastest-growing region. China and India expand monitoring across transport and urban projects. Southeast Asia gains traction through smart infrastructure programs. Latin America and the Middle East show gradual adoption driven by public investments.
Market Insights:
- The Global Structural Health Monitoring Market was valued at USD 2,500.00 million in 2018, reached USD 3,684.63 million in 2024, and is projected to reach USD 8,066.69 million by 2032, growing at a CAGR of 10.36% due to strong infrastructure safety demand.
- Asia Pacific led with about 39.5% share in 2024 due to large-scale transport and urban projects, followed by North America at around 28.0% driven by advanced asset management, and Europe at nearly 22.2% supported by rail safety and aging infrastructure programs.
- Asia Pacific also remains the fastest-growing region with a 39.5% share, supported by rapid construction activity, smart city investments, and early integration of monitoring systems in new projects across China and India.
- By technology, wireless solutions accounted for nearly 55% share in 2024, as asset owners preferred flexible deployment, lower installation complexity, and suitability for large or remote structures.
- Wired technology held about 45% share in 2024, supported by demand for stable data transmission in permanent installations such as bridges, tunnels, and controlled industrial environments.
Market Drivers:
Rising Infrastructure Aging And Mandatory Structural Safety Compliance Requirements
Governments face rising risks from aging bridges, tunnels, and public buildings. Regulatory bodies enforce strict inspection and safety norms. Asset owners prefer real-time condition visibility over manual checks. The Global Structural Health Monitoring Market supports continuous safety assurance. Early fault detection reduces catastrophic failure risk. Public agencies allocate funds for preventive maintenance programs. Infrastructure audits now demand digital condition records. This driver sustains steady system adoption across transport assets.
- For instance, Siemens deployed its bridge monitoring systems on more than 300 bridges globally, using vibration and strain sensors capable of sampling at over 1,000 Hz to detect early structural fatigue, as disclosed in company infrastructure monitoring case studies.
Growing Demand For Predictive Maintenance Across Critical Industrial Assets
Industrial operators aim to prevent unplanned shutdowns and asset damage. Power plants and factories rely on stable structural performance. Predictive maintenance lowers repair costs and downtime exposure. The Global Structural Health Monitoring Market enables data-driven maintenance planning. Sensors detect strain, vibration, and fatigue under load. Operators gain advance warnings of structural stress. Maintenance teams schedule repairs with precision. Operational efficiency gains justify long-term system use.
- For instance, GE Digital reports that its asset performance management platform reduced unplanned outages by up to 20% in monitored power generation facilities through continuous vibration and load monitoring.
Expansion Of Smart City And Intelligent Infrastructure Development Programs
Urban planners invest in connected and resilient infrastructure. Smart cities require constant health data from core structures. The Global Structural Health Monitoring Market aligns with digital infrastructure goals. Integrated monitoring improves public safety oversight. City authorities track asset conditions remotely. Real-time alerts support faster response decisions. Digital dashboards improve infrastructure governance. Urban growth sustains long-term monitoring demand.
Increasing Adoption In High-Risk And High-Value Engineering Structures
Critical structures face extreme loads and environmental stress. Dams, offshore platforms, and high-rise towers need close monitoring. The Global Structural Health Monitoring Market addresses risk exposure in such assets. Continuous data reduces uncertainty in structural behavior. Engineers assess stress patterns under real conditions. Owners protect high capital investments through monitoring. Risk mitigation drives system procurement. Safety priorities strengthen adoption rates.
Market Trends:
Integration Of Artificial Intelligence And Advanced Data Analytics Platforms
Monitoring systems now rely on intelligent data interpretation. AI models detect anomaly patterns faster than manual review. The Global Structural Health Monitoring Market shifts toward predictive insights. Algorithms support early damage classification. Data accuracy improves maintenance planning quality. Cloud platforms enable remote data access. Decision cycles shorten through automated alerts. Analytics-driven monitoring defines modern deployments.
- For instance, Honeywell’s AI-based structural analytics platform processes millions of sensor data points daily and achieves fault detection accuracy exceeding 95% in large industrial facilities, according to Honeywell Connected Enterprise disclosures.
Shift Toward Wireless Sensor Networks And Low-Impact Installations
Infrastructure owners prefer minimal installation disruption. Wireless sensors reduce cabling complexity and costs. The Global Structural Health Monitoring Market reflects this shift. Battery-powered devices support flexible placement. Installation time drops across large structures. Wireless systems suit retrofitting projects. Maintenance teams gain easier system scalability. Deployment speed improves adoption feasibility.
- For instance, ABB’s Ability Smart Sensors support battery lifespans of up to 15 years and enable wireless monitoring of industrial assets via Bluetooth gateways with an open-space range of up to 1 kilometer, as reported in ABB smart monitoring documentation.
Growing Use Of Digital Twins For Structural Performance Simulation
Digital twins replicate real-time structural behavior. Engineers compare live data with virtual models. The Global Structural Health Monitoring Market benefits from this integration. Simulation improves failure scenario planning. Asset managers test load responses digitally. Design validation improves through continuous feedback. Lifecycle insights strengthen asset decisions. Digital twins redefine monitoring value.
Rising Demand For Cloud-Based Monitoring And Centralized Data Access
Organizations manage assets across multiple locations. Cloud platforms enable centralized monitoring control. The Global Structural Health Monitoring Market adopts remote data architectures. Teams access dashboards from any location. Data sharing improves stakeholder coordination. System updates deploy faster through cloud tools. Cyber-secure platforms protect sensitive data. Cloud use supports scalable monitoring growth.
Market Challenges Analysis:
High Initial System Cost And Budget Constraints Across Public Infrastructure Projects
Monitoring systems require sensors, software, and skilled setup. Public agencies face limited capital budgets. The Global Structural Health Monitoring Market encounters funding delays. Procurement cycles extend due to approval layers. Smaller municipalities delay adoption decisions. Cost-benefit clarity varies across asset types. Long payback periods slow investments. Budget pressure limits rapid deployment.
Complex Data Interpretation And Shortage Of Skilled Technical Workforce
Monitoring systems generate large data volumes. Skilled engineers are needed for analysis. The Global Structural Health Monitoring Market depends on expert interpretation. Talent gaps slow system optimization. Training costs rise for asset owners. Data overload risks delayed action. Standardization remains limited across platforms. Skill shortages challenge operational efficiency.
Market Opportunities:
Expansion Across Emerging Economies With Large Infrastructure Development Pipelines
Developing nations invest heavily in transport and urban assets. New projects integrate monitoring from early stages. The Global Structural Health Monitoring Market gains fresh demand. Governments prioritize safety and durability. Large-scale construction supports system deployment. Greenfield projects reduce retrofit complexity. Infrastructure funding attracts technology vendors. Emerging markets create long-term growth avenues.
Rising Adoption In Renewable Energy And Transportation Infrastructure Assets
Renewable energy sites require continuous structural reliability. Wind towers and solar structures face constant load stress. The Global Structural Health Monitoring Market addresses these needs. Rail and metro systems adopt monitoring for safety assurance. Transport authorities value real-time structural insights. Long asset lifecycles justify monitoring investments. Climate exposure increases monitoring relevance. These sectors open new application pathways.
Market Segmentation Analysis:
By Component
The Global Structural Health Monitoring Market shows balanced demand across hardware, software, and services. Hardware forms the system foundation through sensors and data acquisition units. Software converts raw signals into actionable structural insights. Service offerings support system design, calibration, and long-term operation. Asset owners value integrated platforms that combine all three components. Hardware upgrades improve measurement accuracy. Software tools strengthen predictive assessment. Service support ensures reliable lifecycle performance.
- For instance, National Instruments’ data acquisition hardware supports sampling rates above 2 MS/s per channel, enabling precise strain and vibration measurement for critical structures, supported by lifecycle calibration services.
By Vertical
Civil infrastructure remains the primary vertical due to bridges, tunnels, and public assets. Aerospace and defence adopts monitoring for safety-critical structures. Energy assets rely on systems for turbines, pipelines, and offshore platforms. Mining operations use monitoring to manage structural stability risks. Other sectors adopt it for specialized industrial facilities. Each vertical applies monitoring based on risk exposure. Safety assurance drives consistent adoption.
- For instance, Acellent Technologies’ SHM systems have been deployed on more than 1,000 aerospace structures worldwide, enabling real-time damage detection on composite aircraft components under operational loads, according to company technical publications.
By Technology
Wired systems deliver stable data transfer in permanent installations. Wireless technology supports flexible deployment across large or remote structures. It reduces installation complexity and access constraints. Wired systems suit controlled environments. Wireless solutions enable rapid scalability. Technology choice depends on asset layout and monitoring scope.
By Application
Crack and damage detection lead application use due to early fault identification. Strain and pressure monitoring track load behavior. Corrosion and leak detection protect long-life assets. Impact monitoring supports transport safety. Earthquake monitoring strengthens resilience planning. Each application addresses a specific failure risk.
By Implementation
New construction integrates monitoring at design stages. Retrofitting supports existing asset upgrades. Both approaches expand long-term system deployment.
Segmentation:
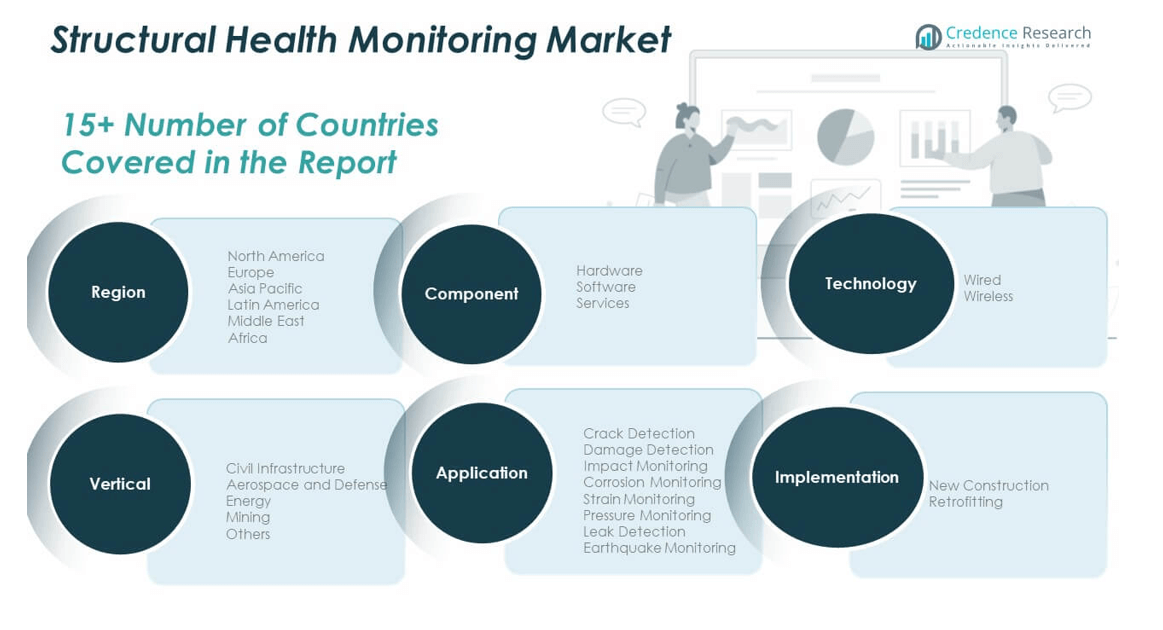
- By Component
- Hardware
- Software
- Services
- By Vertical
- Civil Infrastructure
- Aerospace and Defence
- Energy
- Mining
- Others
- By Technology
- Wired
- Wireless
- By Application
- Crack Detection
- Damage Detection
- Impact Monitoring
- Corrosion Monitoring
- Strain Monitoring
- Pressure Monitoring
- Leak Detection
- Earthquake Monitoring
- By Implementation
- New Construction
- Retrofitting
- By Region
- North America
- S.
- Canada
- Mexico
- Europe
- UK
- France
- Germany
- Italy
- Spain
- Russia
- Rest of Europe
- Asia Pacific
- China
- Japan
- South Korea
- India
- Australia
- Southeast Asia
- Rest of Asia Pacific
- Latin America
- Brazil
- Argentina
- Rest of Latin America
- Middle East
- GCC Countries
- Israel
- Turkey
- Rest of Middle East
- Africa
- South Africa
- Egypt
- Rest of Africa
- North America
Regional Analysis:
North America
The North America Global Structural Health Monitoring Market size was valued at USD 711.25 million in 2018 to USD 1,032.04 million in 2024 and is anticipated to reach USD 2,255.46 million by 2032, at a CAGR of 10.4 during the forecast period. The region held about 28.0% market share in 2024. The Global Structural Health Monitoring Market benefits from mature infrastructure oversight. The United States leads adoption across bridges and highways. Federal safety mandates support continuous monitoring use. Asset owners favor predictive maintenance tools. Technology vendors focus on advanced analytics. Strong public funding supports deployment. Private infrastructure operators also invest steadily.
Europe
The Europe Global Structural Health Monitoring Market size was valued at USD 580.00 million in 2018 to USD 817.15 million in 2024 and is anticipated to reach USD 1,675.88 million by 2032, at a CAGR of 9.5 during the forecast period. Europe accounted for nearly 22.2% market share in 2024. The Global Structural Health Monitoring Market gains traction from rail and bridge safety needs. Germany, the UK, and France lead adoption. Aging transport assets drive system demand. Regulatory focus supports preventive inspections. Historic structure preservation adds use cases. Technology adoption remains steady across public projects. Regional integration supports shared standards.
Asia Pacific
The Asia Pacific Global Structural Health Monitoring Market size was valued at USD 960.00 million in 2018 to USD 1,454.86 million in 2024 and is anticipated to reach USD 3,398.50 million by 2032, at a CAGR of 11.3 during the forecast period. The region led with about 39.5% market share in 2024. The Global Structural Health Monitoring Market expands with rapid infrastructure growth. China and India dominate large-scale deployment. Urban transit projects raise monitoring demand. Smart city programs accelerate adoption. Governments favor digital asset oversight. New construction integrates monitoring systems early. Regional vendors expand technology reach.
Latin America
The Latin America Global Structural Health Monitoring Market size was valued at USD 120.00 million in 2018 to USD 174.61 million in 2024 and is anticipated to reach USD 345.82 million by 2032, at a CAGR of 9.0 during the forecast period. The region held around 4.7% market share in 2024. The Global Structural Health Monitoring Market grows through transport upgrades. Brazil leads regional adoption. Public infrastructure renewal supports demand. Mining and energy assets add use cases. Budget limits slow large-scale rollout. Wireless systems gain preference. Gradual policy support improves outlook.
Middle East
The Middle East Global Structural Health Monitoring Market size was valued at USD 87.50 million in 2018 to USD 120.09 million in 2024 and is anticipated to reach USD 234.78 million by 2032, at a CAGR of 8.8 during the forecast period. The region captured nearly 3.3% market share in 2024. The Global Structural Health Monitoring Market benefits from mega projects. GCC countries lead regional demand. Monitoring supports high-rise and transport assets. Harsh climate raises structural risk concerns. Energy infrastructure adds steady demand. Governments invest in smart infrastructure. Technology adoption remains selective.
Africa
The Africa Global Structural Health Monitoring Market size was valued at USD 41.25 million in 2018 to USD 85.87 million in 2024 and is anticipated to reach USD 156.25 million by 2032, at a CAGR of 7.3 during the forecast period. Africa held about 2.3% market share in 2024. The Global Structural Health Monitoring Market develops at a measured pace. South Africa leads early adoption. Transport and energy projects support demand. Budget constraints affect deployment scale. Safety awareness continues to improve. International funding aids pilot projects. Long-term infrastructure needs sustain future growth.
Key Player Analysis:
- NV5
- Siemens AG
- General Electric (GE)
- Honeywell International Inc.
- National Instruments Corporation
- ABB Ltd.
- Cisco Systems, Inc.
- Schneider Electric
- Meggitt PLC
- Acellent Technologies, Inc.
- Kinemetrics, Inc.
- Baker Hughes Company
Competitive Analysis:
The Global Structural Health Monitoring Market features a mix of large industrial firms and specialized technology providers. Competition centers on sensor accuracy, analytics depth, and system reliability. Leading players invest in integrated hardware and software platforms. Service capabilities support long-term customer retention. Firms focus on infrastructure, energy, and transport assets. Partnerships with engineering contractors strengthen market access. Product differentiation relies on predictive analytics and remote monitoring. Regional presence supports project-based demand. The competitive landscape remains moderately consolidated with steady innovation activity.
Recent Developments:
- On December 15, 2025, ABB announced it had entered into an agreement to acquire IPEC, a UK-based technology company with more than 30 years of expertise in electrical diagnostics. IPEC's advanced monitoring systems track critical electrical infrastructure continuously, using AI and advanced analytics to predict failures that could result in multi-million-dollar losses, safety risks, or extended outages for industries such as data centers, healthcare, utilities, and manufacturing. The integration of IPEC's monitoring technology will complement ABB's predictive maintenance service portfolio designed to cut downtime by up to 90 percent and maintenance costs by up to 85 percent. The transaction is expected to close in the first quarter of 2026.
- In October 2025, Honeywell announced a global strategic collaboration with LS ELECTRIC to accelerate innovation for data centers and battery energy storage systems. The two companies began by selling joint products offering data center operators integrated switchgear and power management solutions to control and distribute power. The partnership anticipates developing new electrical power monitoring systems based on Honeywell Forge, a platform with AI functions, combined with LS ELECTRIC's expertise and software capabilities. The resulting systems are designed to intelligently regulate energy distribution and consumption while leveraging AI-driven predictive maintenance to identify potential issues early and reduce power quality issues and costly downtime. Beyond power management, the collaboration developed a new grid and building-aware battery energy storage system for commercial and industrial buildings that creates microgrids and integrates LS ELECTRIC's energy storage capabilities with Honeywell's dynamic energy control software.
- In September 2025, Siemens signed a Memorandum of Understanding with Merck to extend their strategic partnership. The agreement focuses on delivering integrated software solutions, systems, and consumables that harness automation, data, and AI to connect drug discovery, development, and manufacturing. This collaboration marked the first joint use of technology acquired by Siemens as part of its acquisition of Dotmatics, completed in July 2025, with joint projects developing AI-driven tools and digital interfaces that simplify complex scientific processes.
- GE Vernova agreed to acquire Alteia SAS, with the transaction expected to close on August 1, 2025. Alteia is a France-based software company specializing in AI computer vision and machine learning for visual intelligence in operations. The acquisition strengthens GE Vernova's GridOS Visual Intelligence solution, which uses visual data and AI-enabled workflows to help utilities assess damage, identify vegetation that needs trimming, and inspect key assets along electrical lines. The acquisition enables deeper integration of visual and operational data to provide utilities with enhanced situational awareness and help reduce catastrophic events while accelerating damage assessments and grid restoration.
Report Coverage:
The research report offers an in-depth analysis based on component, vertical, technology, application, and implementation segments. It details leading market players, providing an overview of their business, product offerings, investments, revenue streams, and key applications. Additionally, the report includes insights into the competitive environment, SWOT analysis, current market trends, as well as the primary drivers and constraints. Furthermore, it discusses various factors that have driven market expansion in recent years. The report also explores market dynamics, regulatory scenarios, and technological advancements that are shaping the industry. It assesses the impact of external factors and global economic changes on market growth. Lastly, it provides strategic recommendations for new entrants and established companies to navigate the complexities of the market.
Future Outlook:
- Infrastructure owners will adopt continuous monitoring to improve long-term asset safety.
- Wireless sensor networks will expand deployment across complex and remote structures.
- Advanced analytics will enhance early fault detection and maintenance planning.
- Smart city initiatives will integrate monitoring systems into urban infrastructure frameworks.
- New construction projects will embed monitoring solutions at early design stages.
- Retrofitting demand will rise for aging bridges and public buildings.
- Energy and transportation sectors will remain major application areas.
- Cloud-based platforms will support centralized data access and decision control.
- Emerging economies will increase adoption through public infrastructure investments.
- Service-based monitoring models will gain preference for lifecycle asset management.
Request a Free Sample
Fill in your details and we'll send you a free sample report.
- Sample data tables & charts
- Research methodology
Need a Custom Version of This Report?
Tailor the scope, geography, or segments to your exact requirements.
- Custom geography or segment scope
- Direct access to our analyst team
Frequently Asked Questions
What is the current size of the Structural Health Monitoring Market?
At what Compound Annual Growth Rate is the Global Structural Health Monitoring Market projected to grow between 2025 and 2032?
What factors are driving the growth of the Structural Health Monitoring Market?
What are some challenges faced by the Structural Health Monitoring Market?
Who are the major players in the Structural Health Monitoring Market?
Which segment is leading the market share?
Table of Content
Chapter 1. Report Introduction
- 1.1 Report Description & Purpose
- 1.1.1 Report Title & Market Definition
- 1.1.2 Unique Selling Propositions (USP) & Key Differentiators
- 1.1.3 Value Proposition for Stakeholders
- 1.2 Research Objectives
- 1.2.1 Market Sizing Objectives (Volume & Revenue)
- 1.2.2 Segmentation Objectives
- 1.2.3 Competitive Intelligence Objectives
- 1.2.4 Forecast & Scenario Objectives
- 1.3 Report Scope
- 1.3.1 Structural Health Monitoring Scope – Types & Subtypes Covered
- 1.3.2 Geographic Scope – Regions & Countries Covered
- 1.3.3 Historical Period, Base Year & Forecast Period (2024; forecast to 2032)
- 1.3.4 Inclusions & Exclusions
- 1.4 HS Code & Classification Framework
- 1.5 Currency, Units & Pricing Basis
- 1.6 Target Stakeholders
- 1.7 Limitations & Assumptions
Chapter 2. Executive Summary
- 2.1 Global Structural Health Monitoring Market Snapshot
- 2.1.1 Market Size – Historical (2024) & Forecast (2024-2032) (2024: USD 3,684.63 million → 2032: USD 8,066.69 million)
- 2.1.2 Volume & Revenue – Global Totals
- 2.1.3 Key Market Highlights – Top Five Facts
- 2.2 Structural Health Monitoring Market Segmentation Snapshot
- 2.2.1 Market Split by Region – 2024 vs. 2032
- 2.3 Competitive Snapshot
- 2.3.1 Top 10 Players by Revenue Share – 2024
- 2.3.2 Top 10 Players by Volume Share – 2024
- 2.3.3 Recent Strategic Developments (18-Month Summary)
- 2.4 Key Investment Highlights & Strategic Conclusions
Chapter 3. Structural Health Monitoring Market Dynamics & Industry Analysis
- 3.1 Market Overview & Context
- 3.1.1 Structural Health Monitoring Market Position in the Broader Automotive Value Chain
- 3.1.2 OEM vs. Replacement Market Dynamics
- 3.1.3 Market Maturity & Development Stage by Region
- 3.2 Structural Health Monitoring Market Drivers
- 3.3 Structural Health Monitoring Market Restraints & Challenges
- 3.4 Structural Health Monitoring Market Opportunities
- 3.5 Porter's Five Forces Analysis
- 3.5.1 Threat of New Entrants
- 3.5.2 Bargaining Power of Suppliers
- 3.5.3 Bargaining Power of Buyers
- 3.5.4 Threat of Substitutes
- 3.5.5 Competitive Rivalry – Intensity Assessment
- 3.6 Structural Health Monitoring Value Chain Analysis
- 3.6.1 Upstream – Raw Material/Input Suppliers
- 3.6.1.1 Raw Material/Input 1
- 3.6.1.2 Raw Material/Input 2
- 3.6.1.3 Raw Material/Input 3
- 3.6.2 Midstream – Production/Manufacturing/Service Delivery
- 3.6.2.1 Production/Process Overview
- 3.6.2.2 Key Facility Locations & Capacity by Manufacturer
- 3.6.3 Downstream – Distribution & End Consumer
- 3.6.3.1 Primary Channel – B2B/OEM
- 3.6.3.2 Secondary Channels – Dealer, Retail, Online, Direct
- 3.6.4 Value Chain Profitability Analysis
- 3.6.1 Upstream – Raw Material/Input Suppliers
- 3.7 PESTEL Analysis
- 3.7.1 Political Factors
- 3.7.2 Economic Factors
- 3.7.3 Social Factors
- 3.7.4 Technological Factors
- 3.7.5 Environmental Factors
- 3.7.6 Legal Factors
- 3.8 Structural Health Monitoring Supply Chain Analysis
- 3.8.1 Raw Material/Input Supply Risk Assessment
- 3.8.2 Manufacturing Concentration Risk (Geographic Exposure)
- 3.8.3 Trade Disruption Impact Analysis
- 3.9 Regulatory & Policy Landscape
Note: The regulatory and policy landscape section covers regulations based on their applicability to the market, Structural Health Monitoring category, geography, and scope of the study. Only regulatory frameworks with a material impact on operations, compliance, trade, sustainability, or market access are analyzed in detail.
Chapter 4. Key Investment Pockets & Opportunity Analysis
- 4.1 Structural Health Monitoring Market Attractiveness Analysis
- 4.1.1 By Region – Investment Attractiveness Matrix (Volume × CAGR)
- 4.2 Absolute Revenue Growth Opportunity
- 4.2.1 By Region – Absolute USD Growth Through 2032
- 4.3 Incremental Volume Opportunity
- 4.3.1 By Region – Incremental Volume Through 2032
- 4.3.2 Segment – Incremental Volume
- 4.4 Emerging Submarket Opportunity Deep Dive (Subject to Applicability)
- 4.5 Emerging Market Opportunity Scorecards
- 4.5.1 United States
- 4.5.2 Europe
- 4.5.3 Asia
- 4.5.4 Middle East & Africa
Note: Emerging Market Opportunity Scorecards will be included based on relevance and strategic importance. Regions listed are indicative and may vary depending on data availability and market dynamics.
Chapter 5. Structural Health Monitoring Import-Export Analysis & Trade Flows
- 5.1 Global Trade Overview
- 5.1.1 Global Export Value by Country (2024)
- 5.1.2 Global Export Volume by Country (2024)
- 5.1.3 Global Import Value by Country (2024)
- 5.1.4 Global Import Volume by Country (2024)
- 5.1.5 Net Trade Balance by Country (2024)
- 5.2 Export Analysis – Segment
- 5.2.1 Type 1 (HS Code)
- 5.2.2 Type 2 (HS Code)
- 5.2.3 Type 3 (HS Code)
- 5.2.4 Type 4 (HS Code)
- 5.2.5 Type 5 (HS Code)
- 5.3 Import Analysis – Segment
- 5.3.1 Type 1 (HS Code)
- 5.3.2 Type 2 (HS Code)
- 5.3.3 Type 3 (HS Code)
- 5.3.4 Type 4 (HS Code)
- 5.3.5 Type 5 (HS Code)
- 5.4 Average Unit Trade Prices
- 5.4.1 Average Export Price – Segment & Country
- 5.4.2 Average Import Price – Segment & Source Country
- 5.4.3 Price Trends (2024)
- 5.5 Key Trade Route Analysis
- 5.5.1 Trade Route 1
- 5.5.2 Trade Route 2
- 5.5.3 Trade Route 3
- 5.5.4 Trade Route 4
- 5.5.5 Trade Route 5
- 5.6 Trade Policy Impact Assessment
- 5.6.1 US Anti-Dumping & Section 301 Tariffs
- 5.6.2 EU Customs Union Impact
- 5.6.3 Major Free Trade Agreements
- 5.6.4 USMCA Rules of Origin
Note: Trade policy analysis will be included only where relevant to the Structural Health Monitoring market.
Chapter 6. Competitive Landscape & Company Benchmarking
- 6.1 Structural Health Monitoring Market Concentration & Structure
- 6.1.1 Herfindahl-Hirschman Index (HHI) – vs. 2024
- 6.1.2 Tier 1, Tier 2 & Tier 3 Market Structure
- 6.1.3 Global, Regional & Local Player Dynamics
- 6.2 Structural Health Monitoring Market Share Analysis – 2024
- 6.2.1 Global Revenue Share by Company
- 6.2.2 Global Volume Share by Company
- 6.2.3 Regional Revenue Share
- 6.2.4 Market Share Evolution ( vs. 2024)
- 6.2.5 OEM Segment Share by Company
- 6.2.6 Replacement Segment Share by Company
- 6.3 Production/Delivery Capacity & Facility Analysis
- 6.3.1 Global Installed Capacity
- 6.3.2 Capacity Utilization Rates
- 6.3.3 Production/Output Volume
- 6.3.4 Facility Locations & Capacity Map
- 6.3.5 Planned Capacity Additions
- 6.4 Structural Health Monitoring Competitive Benchmarking Matrix
- 6.4.1 Revenue, Volume, CAGR & Profitability Comparison
- 6.4.2 Channel Revenue Mix
- 6.4.3 Geographic Revenue Exposure
- 6.4.4 R&D Intensity
- 6.4.5 Sustainability Maturity
- 6.5 Strategic Developments in Structural Health Monitoring (Last 24 Months)
- 6.5.1 Mergers, Acquisitions & Divestments
- 6.5.2 New Structural Health Monitoring Launches
- 6.5.3 Facility Expansions
- 6.5.4 Strategic Alliances, Joint Ventures & Partnerships
- 6.5.5 Distribution Expansion & Market Entry
- 6.5.6 Sustainability & ESG Initiatives
- 6.6 Competitive Strategy Mapping
- 6.6.1 Leader, Challenger, Follower & Niche Classification
- 6.6.2 Pricing Strategy Comparison
- 6.6.3 Channel Strategy Matrix
Note: Strategic developments are included based on their materiality and the availability of reliable information.
Chapter 7. Global Structural Health Monitoring Market – By Distribution Channel
- 7.1 Segment Overview
- 7.1.1 Volume & Revenue Split by Channel (2024 & 2032)
- 7.1.2 Channel Mix Evolution (2024-2032)
Chapter 8. Regional Market Analysis – Global Overview
- 8.1 Global Regional Overview
- 8.1.1 Regional Volume Share
- 8.1.2 Regional Revenue Share
- 8.1.3 Regional Volume by Region
- 8.1.4 Regional Revenue by Region
- 8.1.5 Regional Forecast Through 2032
- 8.2 Cross-Regional Segment Analysis
- 8.2.1 By Distribution Channel
- 8.2.2 By Brand/Price Tier
Chapter 9. North America Structural Health Monitoring Market
- 9.1 United States
- 9.2 Canada
- 9.3 Mexico
Chapter 10. Europe Structural Health Monitoring Market
- 10.1 Germany
- 10.2 France
- 10.3 Italy
- 10.4 United Kingdom
- 10.5 Spain
- 10.6 Poland
- 10.7 Russia
- 10.8 Netherlands
- 10.9 Belgium
- 10.10 Sweden
- 10.11 Denmark
- 10.12 Norway
- 10.13 Rest of Europe
Chapter 11. Asia Pacific Structural Health Monitoring Market
- 11.1 China
- 11.2 India
- 11.3 Japan
- 11.4 South Korea
- 11.5 Thailand
- 11.6 Indonesia
- 11.7 Vietnam
- 11.8 Malaysia
- 11.9 Australia
- 11.10 Rest of Asia Pacific
Chapter 12. Latin America Structural Health Monitoring Market
- 12.1 Brazil
- 12.2 Argentina
- 12.3 Colombia
- 12.4 Chile
- 12.5 Rest of Latin America
Chapter 13. Middle East Structural Health Monitoring Market
- 13.1 Saudi Arabia
- 13.2 United Arab Emirates
- 13.3 Turkey
- 13.4 Israel
- 13.5 Iran
- 13.6 Rest of the Middle East
Chapter 14. Africa Structural Health Monitoring Market
- 14.1 South Africa
- 14.2 Egypt
- 14.3 Nigeria
- 14.4 Morocco
- 14.5 Rest of Africa
Chapter 15. Structural Health Monitoring Company Profiles
- 15.1 [Company 01]
- 15.1.1 Company Overview
- 15.1.2 Key Management Personnel
- 15.1.3 Products & Services Portfolio
- 15.1.4 Financial Performance
- 15.1.5 Key Market Focus & Geographic Presence
- 15.1.6 Recent Developments & Strategic Initiatives
Note: The company profile list is preliminary and may change based on research findings, market developments, data availability, and client requirements.
Chapter 16. Appendices
- Appendix A – List of Abbreviations & Acronyms
- Appendix B – Industry Classification Code Reference – Full Series
- Appendix C – Production & Capacity Data Tables
- Appendix D – End-Use & Demand Base Tables
- Appendix E – Consumption & Replacement Rate Assumptions
- Appendix F – ASP Reference Tables
- Appendix G – Manufacturing & Facility Database
- Appendix H – Import-Export Data Tables
- Appendix I – Regulatory Summary Tables
- Appendix J – Primary Research Participant List (Anonymized)
- Appendix K – Primary Research Questionnaire Framework
- Appendix L – Data Sources & Bibliography
- Appendix M – Market Size Divergence & Source Comparison
Chapter 17. Research Methodology
- 17.1 Research Framework & Philosophy
- 17.2 Secondary Research – Sources, Hierarchy & Data Extraction
- 17.3 Data Modeling – Bottom-Up & Top-Down Market Sizing
- 17.4 Primary Research – Stakeholder Framework, LOI & Sample Sizes
- 17.5 Forecast Methodology – Regression, Scenario & Sensitivity Analysis
- 17.6 Quality Control – Four-Layer Validation Framework
- 17.7 Limitations & Standard Assumptions
- 17.8 Disclaimer
