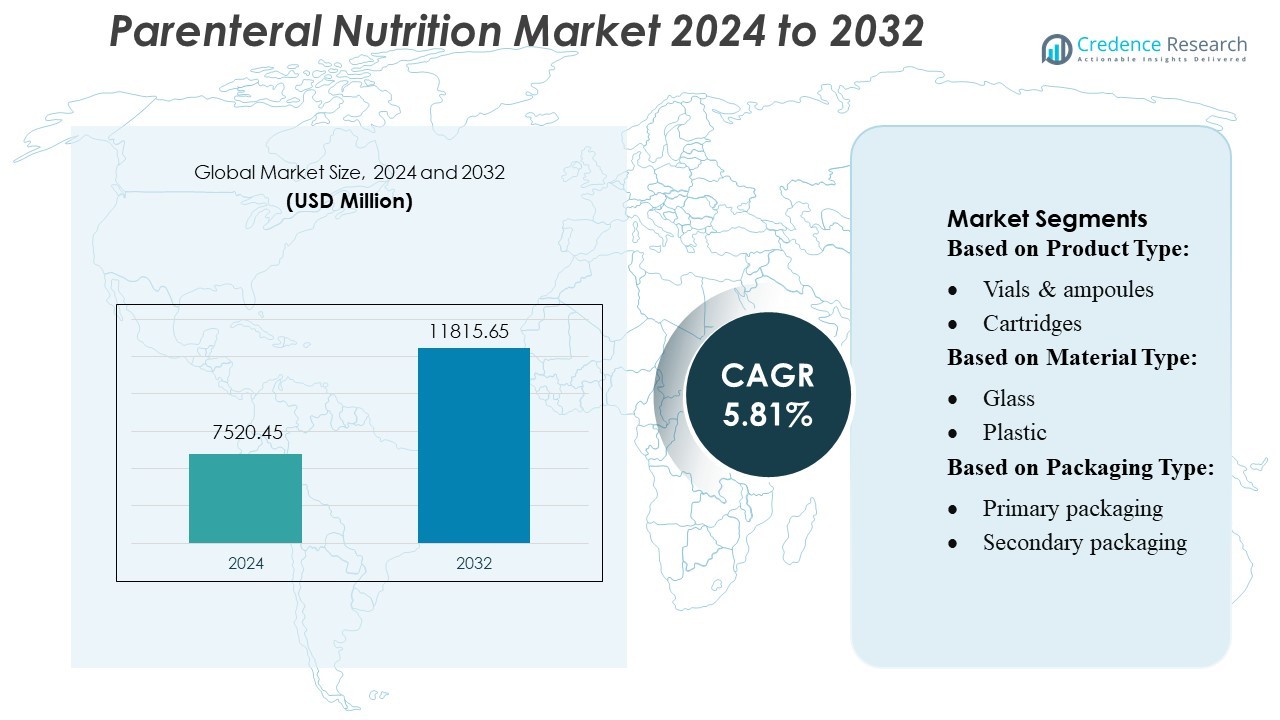
Home » Healthcare » Pharmaceuticals » Parenteral Nutrition Market

Parenteral Nutrition Market By Nutrient Type (Carbohydrates, Lipid Emulsion, Single Dose Amino Acid Solution, Trace Elements, Vitamins and Minerals) By Consumer Type (Children and New-born, Adults) By End-User (Clinic, Hospital, Others)-Growth, Future Prospects & Competitive Analysis, 2016 – 2030

Price: $4999

Published: | Report ID: 8617 | Report Format : PDF

Key Highlights of the Report

The global parenteral nutrition market is divided into four sections: nutrients, consumer type, end-user, and region. The single-dose amino acid solution sector held the biggest market share in Parenteral Nutritions, with children and new-borns and adults being the two leading customer types. The end-use category of hospitals accounted for the largest CAGR in the global market, with North America driving market expansion.

There are various drivers in the worldwide Parenteral Nutrition Market, including chronic sickness. The prevalence of the disease is increasing, as is the demand for home parenteral nutrition. However, the business confronts substantial hurdles, such as a scarcity of competent healthcare personnel to deliver parenteral feeding treatment. and the need for ongoing monitoring and adjustment of parenteral nutrition treatment based on the patient’s condition and nutritional needs.

Nonetheless, the worldwide parenteral nutrition market has tremendous development potential due to factors such as increased use in critical care settings and an ageing population. Furthermore, advancements in parenteral feeding items and delivery technology are expected in the future.

Market Overview

The global Parenteral Nutrition Market has grown steadily in recent years and is predicted to develop at a CAGR of 6.50% between 2023 and 2030. In 2022, the market was valued at USD 6.8 billion, and it is predicted to grow to USD 10.5 billion by 2030.

Design Element 2

Access crucial information at unmatched prices!

Request your free sample report today & start making informed decisions powered by Credence Research!

Download Free Sample
CTA Design Element 3

What Are The major Drivers Of The Global Parenteral Nutrition Market?

The global Parenteral Nutrition Market is driven by several factors, including a Chronic illness Prevalence is rising, as is the demand for home parenteral nutrition.

What Are The major Challenges Faced By The Global Parenteral Nutrition Market?

The global Parenteral Nutrition Market also faces several challenges, including the lack of skilled healthcare providers available to administer parenteral feeding treatment. and the requirement for continual monitoring and adjustment of parenteral nutrition treatment based on the patient’s state and nutritional requirements.

What Are The Growth Opportunities In The Global Parenteral Nutrition Market?

The global Parenteral Nutrition Market offers significant growth opportunities, including Increasing Use in Critical Care Settings and an Ageing Population.

Executive Summary

Overview of the Global Parenteral Nutrition Market

The parenteral nutrition industry is expanding, as it gives nutrition to individuals who are unable to eat orally. The growing geriatric population, growing prevalence of chronic diseases, and technological improvements are driving the market. However, the high expense of parenteral nourishment, the danger of infection and consequences, and the availability of alternatives such as enteral feeding products are substantial barriers to market adoption and use. Enteral nutrition products are less intrusive than parenteral nourishment products, have a lower risk of problems, and are less expensive. The availability of alternatives such as enteral nutrition products, particularly in non-critical care settings, can limit the uptake and use of parenteral nutrition products.

Market Definition

Parenteral nutrition, often known as intravenous feeding, is a way of nourishing the human body through veins. Depending on which vein is used, this process is referred to as total parenteral nutrition (TP) or peripheral parenteral nutrition (PP). TPN includes placing a catheter into the superior vena cava, a major vein that leads to the heart. The healthcare professional may also implant a port, such as a needleless access port, to facilitate intravenous feeding. The doctor may recommend PP for temporary nutritional needs. This method of intravenous feeding uses a regular peripheral intravenous line rather than a central line put into the superior vena cava.

Market Insights

  • Parenteral Nutritions’ global demand was estimated at USD 6.8 billion in 2022 and is predicted to reach USD 10.5 billion in 2030, rising at a CAGR of 6.50% between 2023 and 2030.
  • The single-dose amino acid solution segment held the greatest market share of more than 30.5% in 2022.
  • In 2022, the children and infants category accounted for 43% of the parenteral nutrition market’s revenue.
  • In 2022, the hospitals end-use category accounted for the greatest revenue share in the global market.
  • In 2022, North America held the biggest market share of more than 41%.
  • Chronic illness Prevalence is rising, as is the demand for home parenteral nutrition. are the major drivers of the market.
  • Parenteral feeding products, on the other hand, are expensive and increase the risk of infections and problems; alternatives are available. are the primary constraints.
  • Increasing Use in Critical Care Settings and an Ageing Population are the major opportunities in the market.

Segmentation by Nutrient Type

  • The single-dose amino acid solution segment held the greatest market share of more than 30.5% in 2022.
  • During the projected period, the lipid emulsion segment is expected to grow the fastest.
  • Trace Elements is another segment, however it contributes relatively little to the worldwide Parenteral Nutrition Market when compared to single-dose amino acid solution and lipid emulsion.

Segmentation by Consumer Type

  • In 2022, the children and new-born category accounted for 43% of the parenteral nutrition market’s revenue.
  • The adult segment contributes the rest to the demand for Parenteral Nutritions.

Segmentation by End-User

  • In 2022, the hospitals end-use category accounted for the highest CAGR in the global market.
  • Clinic has a significant market share in 2022.

Segmentation by Region

  • In 2022, North America held the biggest market share of more than 41%.
  • During the forecast period, Asia Pacific is expected to have the quickest CAGR.
  • The rest of the World, including Latin America, The Middle East, and Africa, contributes the remainder to the demand for Parenteral Nutritions.

Chronic sickness can be attributable to the increased demand for Parenteral Nutritions. The prevalence of the disease is increasing, as is the demand for home parenteral nutrition. However, the market is limited by the fact that parenteral nourishment supplies are expensive and raise the risk of infections and problems; alternatives are available.

The high research expenditures by governments in the region, as well as private organisations operating in the healthcare sector, and collaborations between regulatory authorities, the medical device sector, and universities, the North America market accounted for the largest revenue share in the global market in 2022.

Due to the favourable government initiatives linked to healthcare infrastructure development and reimbursement regulations in the region, the Asia Pacific parenteral nutrition market is predicted to grow at the fastest rate over the forecast period. Economic expansion in countries such as China, India, and Japan, as well as increased government initiatives for healthcare infrastructure development and reimbursement policy implementation, are drivers driving market growth.

Overall, chronic sickness can be ascribed to the increased demand for Parenteral Nutritions. The prevalence of the disease is increasing, as is the demand for home parenteral nourishment.

While the Parenteral Nutrition Market is expanding, it is being hampered by a scarcity of competent healthcare practitioners to offer parenteral feeding treatment. and the need for ongoing monitoring and adjustment of parenteral nutrition treatment based on the patient’s condition and nutritional needs.

Chronic Disease Prevalence Is Increasing

The growing frequency of chronic conditions such as cancer, gastrointestinal ailments, and Crohn’s disease is driving the parenteral nutrition industry. Malnutrition can result from these disorders, which can lead to severe difficulties. Parenteral nutrition is a useful treatment for individuals who cannot or should not get nutrition through the gastrointestinal route. It delivers necessary nutrients directly to the bloodstream, bypassing the digestive system.

The rising frequency of chronic diseases has resulted in an increase in the need for parenteral feeding products. Furthermore, the expanding senior population is more vulnerable to chronic diseases and malnutrition, driving demand for parenteral nutrition products even higher.

Furthermore, technological improvements in parenteral nutrition products, as well as the availability of novel products, have contributed to the market’s expansion. The use of amino acids and glucose in parenteral nutrition, as well as the creation of innovative formulations such as lipid emulsions, have improved patient outcomes and reduced the risk of problems.

Demand For Home Parenteral Nutrition Is Growing

Home parenteral nutrition is a therapy option for patients who need long-term parenteral feeding support but wish to be treated at home. HPN allows patients to live a more normal life while also reducing the burden on healthcare facilities.

The expanding number of patients who require long-term parenteral feeding support is driving up demand for HPN. The elderly are more vulnerable to chronic disorders, which can result in malnutrition and the requirement for parenteral nourishment. Furthermore, rising awareness of the benefits of HPN and the availability of home healthcare services have aided market expansion.

The COVID-19 pandemic has also increased demand for HPN, since patients are hesitant to visit healthcare institutions for fear of contracting the virus. Home parenteral nutrition offers patients a safe and effective treatment alternative while reducing the danger of virus exposure.

Parenteral Nutrition Products Are Expensive

Parenteral nutrition products are expensive due to the complex manufacturing process and the high cost of raw materials. Furthermore, the need for sterile conditions during production and delivery raises the cost of parenteral nutrition products. The high cost of parenteral feeding solutions makes it difficult for patients to afford therapy, limiting market growth. Furthermore, the high cost of parenteral feeding products places a strain on healthcare systems, which must shoulder the cost of therapy.

Furthermore, the lack of reimbursement for parenteral feeding products is a key commercial constraint. The absence of reimbursement makes it difficult for patients to afford treatment, limiting market growth.

Finally, the high cost of parenteral nourishment products is a major impediment to the parenteral nutrition business. Because of the high cost of treatment, which makes it difficult for people to afford treatment and puts a pressure on healthcare systems, the market’s expansion is limited.

Increases The Risk Of Infections And Complications

The risk of infection and consequences associated with parenteral feeding. Because a central venous catheter is required for parenteral nourishment, there is a substantial risk of infection. Because the central venous catheter has direct access to the bloodstream, the risk of infection is increased. Furthermore, parenteral nourishment is linked to a number of problems, including metabolic abnormalities, liver dysfunction, and catheter-related issues. These consequences can result in extended hospitalisation and higher healthcare expenses.

Because of the risk of infections and difficulties associated with parenteral feeding, patients are hesitant to accept therapy due to the risk of complications. Furthermore, due to the risk of infection and consequences, healthcare facilities are hesitant to employ parenteral nourishment.

Alternatives Are Available

The availability of alternatives is a substantial limitation on the parenteral feeding market. Parenteral nutrition products are not as effective as enteral nutrition products, which are provided through the gastrointestinal tract. Enteral nutrition products are less intrusive than parenteral nutrition products and have a lower risk of problems. Furthermore, enteral nutrition products cost less than parenteral nutrition products. The availability of alternatives such as enteral nutrition products, particularly in non-critical care settings, can limit the uptake and use of parenteral nutrition products. Finally, the availability of alternatives such as enteral nutrition products is a substantial impediment to the market adoption and use of parenteral nutrition products.

Increased Utilisation In Critical Care Settings

Patients in critical care settings are frequently malnourished as a result of the stress of their condition and their incapacity to eat meals orally. Parenteral nutrition can assist these patients regain and maintain enough nutrition, which can improve their health outcomes and lower healthcare expenditures.

Furthermore, the rising frequency of chronic diseases and an ageing population are likely to propel the critical care parenteral nutrition market forwards. Chronic disease patients are more prone to require critical care and may require parenteral feeding supplementation while in the hospital. The elderly are also more vulnerable to critical disease and may require parenteral feeding supplementation while in the hospital.

Furthermore, the growing emphasis on early nutrition assistance and the development of innovative parenteral nutrition formulations are likely to propel the critical care parenteral nutrition market forwards. Early nutrition intervention can assist to improve patient outcomes while also lowering healthcare expenses. To fulfil the particular dietary needs of critically ill patients, new parenteral nutrition formulations are also being developed.

Ageing Population

Globally, the ageing population represents a considerable potential for enterprises and industries. As individuals get older, they require more healthcare services, which might propel the healthcare business forwards. Furthermore, the ageing population has more discretionary income, which can fuel growth in other businesses such as travel and leisure. Furthermore, the expanding ageing population has created a need for products and services that meet their specific needs, such as mobility aids, home healthcare services, and senior living communities. The ageing population also gives a business opportunity to create products and services that improve the quality of life for the elderly.

Finally, the ageing population gives a major potential for entrepreneurs to create new products and services that meet their specific demands and improve their quality of life.

Competitive Landscape

Key Players

The global Parenteral Nutrition Market is highly competitive, with the presence of several key players. Some of the major players in the market and their market share are as follows:

  • Baxter (U.S.)
  • Otsuka Pharmaceutical Factory, Inc. (Tokyo)
  • Forbes Media LLC (U.S.)
  • Kelun.com (China)
  • Vifor Pharma Management Ltd. (Switzerland)
  • AbbVie Inc. (U.S.)
  • B.Braun Melsungen AG (Germany)
  • Fresenius SE & Co. KGaA (Germany)
  • Grifols S.A. (Spain)
  • Pfizer, Inc. (U.S.)
  • ICU Medical Inc. (U.S.)
  • Anhui Medipharm Co Ltd. (China)
  • aculife (India)
  • Servona GmbH (Germany)
  • Others

These companies focus on product innovation, expanding their distribution channels, and mergers and acquisitions to stay ahead in the market. The major players in the global Parenteral Nutrition Market are constantly striving to stay ahead by introducing new products and innovations.

In 2019, Through Smart PN, Baxter and ASPEN announced their collaboration to help minimise malnutrition through effective use of parenteral nutrition therapy. This collaboration was crucial in reducing malnutrition and improving health outcomes.

The US Food and Drug Administration (FDA) approved Baxter International’s new Clinimix Injections and Clinimix E Injections formulations in September 2020. The new Clinimix formulations make it easier to attain patient protein targets since they contain up to 80 g/L of amino acids, the most protein in any multi-chamber bag now available in the United States. They also contain less fluid and dextrose than earlier formulations.

Fresenius Kabi concluded its clinical trial for SmofKabiven in January 2020. SmofKabiven is a new addition to their lipid emulsions line. It is composed of several oils (fish, soybean, and olive oils, as well as medium-chain triglycerides), as well as a separate chamber for amino acids, glucose, and lipids.

Shape Your Report to Specific Countries or Regions & Enjoy 30% Off!

Summary of Key Findings

  • Chronic illness Prevalence is rising, as is the demand for home parenteral nutrition is  driving market growth
  • Market segmented by nutrient type, consumer type, end-user and region.
  • The single-dose amino acid solution segment held the greatest market share of more than 30.5% in 2022.
  • the hospitals end-use category accounted for the greatest revenue share in the global market.
  • During the forecast period, Asia Pacific is expected to have the quickest CAGR.

Future Outlook

  • Increasing chronic illness prevalence
  • Increasing demand for home healthcare
  • Advances in parenteral nutrition products and delivery technologies
  • Growing geriatric population
  • Increasing frequency of premature births and surgeries
  • Growing knowledge of the benefits of parenteral nutrition

Segmentation

  • By Nutrient Type
    • Carbohydrates
    • Lipid Emulsion
    • Single Dose Amino Acid Solution
    • Trace Elements
    • Vitamins and Minerals
  • By Consumer Type
    • Children and New-born
    • Adults
  • By End-User
    • Clinic
    • Hospital
    • Others
  • By Region
  • North America
    • U.S
    • Canada
    • Mexico
  • Europe
    • Germany
    • France
    • U.K.
    • Italy
    • Spain
    • Rest of Europe
  • Asia Pacific
    • China
    • Japan
    • India
    • South Korea
    • South-east Asia
    • Rest of Asia Pacific
  • Latin America
    • Brazil
    • Argentina
    • Rest of Latin America
  • Middle East & Africa
    • GCC Countries
    • South Africa
    • Rest of Middle East and Africa

1.1. Report Description 74
1.1.1. Purpose of the Report 74
1.1.2. USP & Key Offerings 74
1.2. Key Benefits for Stakeholders 74
1.3. Target Audience 75
1.4. Report Scope 76
2.1. Parenteral Nutrition Market Snapshot 78
2.2. Global Parenteral Nutrition Market, 2017 – 2030 (USD Million) 79

3.1. Impact Assessment of COVID-19 Pandemic, By Region 80
3.1.1. Supply Chain Disruptions: 80
3.1.2. Economic Challenges: 80
3.1.3. Healthcare System Strain 80
3.1.4. Focus on Critical Care: 80
3.1.5. Research and Development Challenges: 80
3.1.6. Regulatory Changes: 81
3.1.7. Patient Access and Adherence: 81
4.1. Introduction 82
4.2. Market Drivers 83
4.2.1. Presence of a large pool of malnourished children 83
4.2.2. Growing adoption of parenteral nutrition by healthcare settings for
nutrient administration 83
4.2.3. Rising incidence of chronic diseases 84
4.2.4. Increasing geriatric population 84
4.3. Market Restraints 86
4.3.1. Poor Monitoring 86

4.3.2. Cost Constraints Coupled with Stringent Regulatory Requirements 86
4.3.3. Lack of awareness among healthcare providers 87
4.4. Market Opportunities 88
4.4.1. Strong growth prospects in Asia Pacific 88
4.4.2. Focus on Personalized Nutrition & Research in Disease-Specific
Formulations 89
4.4.3. Advancements in Nutrient Delivery Systems 90
4.5. Porter’s Five Forces Analysis 91
4.6. Value Chain Analysis 92
4.7. Buying Criteria93
5.1. Company Market Share Analysis – 2022 95
5.1.1. Global Parenteral Nutrition Market: Company Market Share, by Revenue2022 95
5.1.2. Global Parenteral Nutrition Market: Top 6 Company Market Share, by Revenue2022 95
5.1.3. Global Parenteral Nutrition Market: Top 3 Company Market Share, by Revenue2022 96
5.1. Global Parenteral Nutrition Market Company Revenue Market Share, 2022 97
5.2. Competitive Benchmarking, 2022 98
5.3. Key Players Product Matrix 99
6.1. PESTEL 103
6.1.1. Political Factors 103
6.1.2. Economic Factors 103
6.1.3. Social Factors 103
6.1.4. Technological Factors 103
6.1.5. Environmental Factors 104
6.1.6. Legal Factors 104
6.2. Adjacent Market Analysis 105

7.1. Parenteral Nutrition Market Overview, by Age Group Segment 107
7.1.1. Parenteral Nutrition Market Revenue Share, By Age Group, 2022 & 2030 110
7.1.2. Parenteral Nutrition Market Attractiveness Analysis, By Age Group 111

7.1.3. Incremental Revenue Growth Opportunity, by Age Group, 2023 – 2030 111
7.1.4. Parenteral Nutrition Market Revenue, By Age Group, 2017, 2022, 2026 & 2030 112
7.2. Adult 113
7.2 1. Global Adult Parenteral Nutrition Market Revenue, By Region, 2017 – 2022
(USD Million) 114
7.2 2. Global Adult Parenteral Nutrition Market Revenue, By Region, 2017 –
2022 (USD Million) 114
7.3. Pediatrics 115
7.3 1. Global Pediatrics Parenteral Nutrition Market Revenue, By Region, 2017 –
2022 (USD Million) 116
7.3 2. Global Pediatrics Parenteral Nutrition Market Revenue, By Region, 2017 –
2022 (USD Million) 116

8.1. Parenteral Nutrition Market Overview, by Application Segment 117
8.1.1. Parenteral Nutrition Market Revenue Share, By Application, 2022 & 2030 119
8.1.2. Parenteral Nutrition Market Attractiveness Analysis, By Application 120
8.1.3. Incremental Revenue Growth Opportunity, by Application, 2023 – 2030 120
8.1.4. Parenteral Nutrition Market Revenue, By Application, 2017, 2022, 2026 & 2030 121
8.2. Alzheimer’s 122
8.2 1. Global Alzheimer’s Parenteral Nutrition Market Revenue, By Region, 2017
– 2022 (USD Million) 123
8.2 2. Global Alzheimer’s Parenteral Nutrition Market Revenue, By Region, 2017
– 2022 (USD Million) 123
8.3. CKD 124
8.3 1. Global CKD Parenteral Nutrition Market Revenue, By Region, 2017 – 2022
(USD Million) 125
8.3 2. Global CKD Parenteral Nutrition Market Revenue, By Region, 2017 – 2022
(USD Million) 125
8.4. Nutrition Deficiency 126
8.4.1. Global Nutrition Deficiency Parenteral Nutrition Market Revenue, By
Region, 2017 – 2022 (USD Million) 127
8.4.2. Global Nutrition Deficiency Parenteral Nutrition Market Revenue, By
Region, 2017 – 2022 (USD Million) 127
8.5. Cancer Care 128
8.5 1. Global Cancer Care Parenteral Nutrition Market Revenue, By Region, 2017
– 2022 (USD Million) 129

8.5.2. Global Cancer Care Parenteral Nutrition Market Revenue, By Region, 2017
– 2022 (USD Million) 129
8.6. Diabetes 130
8.6 1. Global Diabetes Parenteral Nutrition Market Revenue, By Region, 2017 –
2022 (USD Million) 131
8.6 2. Global Diabetes Parenteral Nutrition Market Revenue, By Region, 2017 –
2022 (USD Million) 131
8.7. Others 132
8.7 1. Global Others Parenteral Nutrition Market Revenue, By Region, 2017 –
2022 (USD Million) 133
8.7 2. Global Others Parenteral Nutrition Market Revenue, By Region, 2017 –
2022 (USD Million) 133

9.1. Parenteral Nutrition Market Overview, by Type Segment 134
9.1.1. Parenteral Nutrition Market Revenue Share, By Type, 2022 & 2030 136
9.1.2. Parenteral Nutrition Market Attractiveness Analysis, By Type 137
9.1.3. Incremental Revenue Growth Opportunity, by Type, 2023 – 2030 137
9.1.4. Parenteral Nutrition Market Revenue, By Type, 2017, 2022, 2026 & 2030 138
9.2. Carbohydrates139
9.2.1. Global Carbohydrates Parenteral Nutrition Market Revenue, By Region,
2017 – 2022 (USD Million) 140
9.2.2. Global Carbohydrates Parenteral Nutrition Market Revenue, By Region,
2017 – 2022 (USD Million) 140
9.3. Parenteral Lipid Emulsion 141
9.3.1. Global Parenteral Lipid Emulsion Parenteral Nutrition Market Revenue, By Region, 2017 – 2022 (USD Million) 142
9.3.2. Global Parenteral Lipid Emulsion Parenteral Nutrition Market Revenue, By Region, 2017 – 2022 (USD Million) 142
9.4. Single Dose Amino Acid Solution 143
9.4.1. Global Single Dose Amino Acid Solution Parenteral Nutrition Market
Revenue, By Region, 2017 – 2022 (USD Million) 144
9.4.2. Global Single Dose Amino Acid Solution Parenteral Nutrition Market
Revenue, By Region, 2017 – 2022 (USD Million) 144
9.5. Trace Elements 145
9.5.1. Global Trace Elements Parenteral Nutrition Market Revenue, By Region,
2017 – 2022 (USD Million) 146
9.5.2. Global Trace Elements Parenteral Nutrition Market Revenue, By Region,
2017 – 2022 (USD Million) 146

9.6. Others 147
9.6 1. Global Others Parenteral Nutrition Market Revenue, By Region, 2017 –
2022 (USD Million) 148
9.6 2. Global Others Parenteral Nutrition Market Revenue, By Region, 2017 –
2022 (USD Million) 148

10.1. Parenteral Nutrition Market Overview, by End-user Segment 149
10.1.1. Parenteral Nutrition Market Revenue Share, By End-user, 2022 & 2030 150
10.1.2. Parenteral Nutrition Market Attractiveness Analysis, By End-user 151
10.1.3. Incremental Revenue Growth Opportunity, by End-user, 2023 – 2030 151
10.1.4. Parenteral Nutrition Market Revenue, By End-user, 2017, 2022, 2026 & 2030 152
10.2. Hospitals 153
10.2 1. Global Hospitals Parenteral Nutrition Market Revenue, By Region, 2017 –
2022 (USD Million) 154
10.2 2. Global Hospitals Parenteral Nutrition Market Revenue, By Region, 2017 –
2022 (USD Million) 154
10.3. Clinics 155
10.3.1. Global Clinics Parenteral Nutrition Market Revenue, By Region, 2017 –
2022 (USD Million) 156
10.3.2. Global Clinics Parenteral Nutrition Market Revenue, By Region, 2017 –
2022 (USD Million) 156
10.4. Others 157
10.4 1. Global Others Parenteral Nutrition Market Revenue, By Region, 2017 –
2022 (USD Million) 158
10.4 2. Global Others Parenteral Nutrition Market Revenue, By Region, 2017 –
2022 (USD Million) 158

11.1. Parenteral Nutrition Market Overview, by Distribution Channel Segment 159
11.1 1. Parenteral Nutrition Market Revenue Share, By Distribution Channel, 2022
& 2030………………………………………………………………………………………………. 160
11.1.2. Parenteral Nutrition Market Attractiveness Analysis, By Distribution
Channel 161
11.1 3. Incremental Revenue Growth Opportunity, by Distribution Channel, 2023 –
2030 161

11.1.4. Parenteral Nutrition Market Revenue, By Distribution Channel, 2017,
2022, 2026 & 2030………………………………………………………………………………. 162
11.2. Retail Pharmacies 163
11.2.1. Global Retail Pharmacies Parenteral Nutrition Market Revenue, By Region,
2017 – 2022 (USD Million) 164
11.2.2. Global Retail Pharmacies Parenteral Nutrition Market Revenue, By Region,
2017 – 2022 (USD Million) 164
11.3. Online 165
11.3 1. Global Online Parenteral Nutrition Market Revenue, By Region, 2017 –
2022 (USD Million) 166
11.3 2. Global Online Parenteral Nutrition Market Revenue, By Region, 2017 –
2022 (USD Million) 166
11.4. Institutional Sales 167
11.4.1. Global Institutional Sales Parenteral Nutrition Market Revenue, By Region,
2017 – 2022 (USD Million) 168
11.4.2. Global Institutional Sales Parenteral Nutrition Market Revenue, By Region,
2017 – 2022 (USD Million) 168
12.1. Parenteral Nutrition Market Overview, by Regional Segments 169
12.2. Region 169
12.2.1. Global Parenteral Nutrition Market Revenue Share, By Region, 2022 & 2030 169
12.2.2. Parenteral Nutrition Market Attractiveness Analysis, By Region 170
12.2.3. Incremental Revenue Growth Opportunity, by Region, 2023 – 2030 170
12.2.4. Parenteral Nutrition Market Revenue, By Region, 2017, 2022, 2026 & 2030 171
12.2.5. Global Parenteral Nutrition Market Revenue, By Region, 2017 – 2022 (USD Million) 172
12.2.6. Global Parenteral Nutrition Market Revenue, By Region, 2023 – 2030 (USD Million) 172
12.3. Age Group 173
12.3 1. Global Parenteral Nutrition Market Revenue, By Age Group, 2017 – 2022
(USD Million) 173
12.3 2. Global Parenteral Nutrition Market Revenue, By Age Group, 2023 – 2030
(USD Million) 173
12.4. End-user 174
12.4.1. Global Parenteral Nutrition Market Revenue, By End-user, 2017 – 2022
(USD Million) 174
12.4.2. Global Parenteral Nutrition Market Revenue, By End-user, 2023 – 2030
(USD Million) 174

12.5. Application 175
12.5.1. Global Parenteral Nutrition Market Revenue, By Application, 2017 – 2022
(USD Million) 175
12.5 2. Global Parenteral Nutrition Market Revenue, By Application, 2023 – 2030
(USD Million) 175
12.6. Type 176
12.6.1. Global Parenteral Nutrition Market Revenue, By Type, 2017 – 2022 (USD
Million) 176
12.6.2. Global Parenteral Nutrition Market Revenue, By Type, 2023 – 2030 (USD
Million) 176
12.7. Distribution Channel 177
12.7.1. Global Parenteral Nutrition Market Revenue, By Distribution Channel,
2017 – 2022 (USD Million) 177
12.7.2. Global Parenteral Nutrition Market Revenue, By Distribution Channel,
2023 – 2030 (USD Million) 177
13.1. North America178
13.1.1. North America Parenteral Nutrition Market Revenue, By Country, 2017 –
2022 (USD Million) 180
13.1.2. Age Group 181
13.1 3. North America Parenteral Nutrition Market Revenue, By Age Group, 2017
– 2022 (USD Million) 181
13.1 4. North America Parenteral Nutrition Market Revenue, By Age Group, 2023
– 2030 (USD Million) 181
13.1.5. End-user 182
13.1.6. North America Parenteral Nutrition Market Revenue, By End-user, 2017 –
2022 (USD Million) 182
13.1.7. North America Parenteral Nutrition Market Revenue, By End-user, 2023 –
2030 (USD Million) 182
13.1.8. Application 183
13.1 9. North America Parenteral Nutrition Market Revenue, By Application, 2017
– 2022 (USD Million) 183
13.1.10. North America Parenteral Nutrition Market Revenue, By
Application, 2023 – 2030 (USD Million) 183
13.1.11. Type 184
13.1.12. North America Parenteral Nutrition Market Revenue, By Type,
2017 – 2022 (USD Million) 184
13.1.13. North America Parenteral Nutrition Market Revenue, By Type,
2023 – 2030 (USD Million) 184

13.1.14. Distribution Channel 185
13.1.15. North America Parenteral Nutrition Market Revenue, By
Distribution Channel, 2017 – 2022 (USD Million) 185
13.1.16. North America Parenteral Nutrition Market Revenue, By
Distribution Channel, 2023 – 2030 (USD Million) 185
13.2. U.S. 186
13.2.1. Age Group 186
13.2.1.1. U.S. Parenteral Nutrition Market Revenue, By Age Group, 2017 – 2022 (USD Million) 186
13.2.1.2. U.S. Parenteral Nutrition Market Revenue, By Age Group, 2023 – 2030 (USD Million) 186
13.2.2. End-user 187
13.2.2.1. U.S. Parenteral Nutrition Market Revenue, By End-user, 2017 – 2022 (USD Million) 187
13.2.2.2. U.S. Parenteral Nutrition Market Revenue, By End-user, 2023 – 2030 (USD Million) 187
13.2.3. Application 188
13.2.3.1. U.S. Parenteral Nutrition Market Revenue, By Application, 2017 – 2022 (USD Million) 188
13.2.3.2. U.S. Parenteral Nutrition Market Revenue, By Application, 2023 – 2030 (USD Million) 188
13.2.4. Type 189
13.2.4.1. U.S. Parenteral Nutrition Market Revenue, By Type, 2017 – 2022 (USD Million)
………………………………………………………………………………………………….. 189
13.2.4.2. U.S. Parenteral Nutrition Market Revenue, By Type, 2023 – 2030 (USD Million)
………………………………………………………………………………………………….. 189
13.2.5. Distribution Channel 190
13.2.5.1. U.S. Parenteral Nutrition Market Revenue, By Distribution Channel, 2017 – 2022 (USD Million) 190
13.2.5.2. U.S. Parenteral Nutrition Market Revenue, By Distribution Channel, 2023 – 2030 (USD Million) 190
13.3. Canada 191
13.3.1. Age Group 191
13.3.1 1. Canada Parenteral Nutrition Market Revenue, By Age Group, 2017 – 2022
(USD Million) 191
13.3.1 2. Canada Parenteral Nutrition Market Revenue, By Age Group, 2023 – 2030
(USD Million) 191
13.3.2. End-user 192
13.3.2.1. Canada Parenteral Nutrition Market Revenue, By End-user, 2017 – 2022 (USD Million) 192

13.3.2.2. Canada Parenteral Nutrition Market Revenue, By End-user, 2023 – 2030 (USD Million) 192
13.3.3. Application 193
13.3.3 1. Canada Parenteral Nutrition Market Revenue, By Application, 2017 – 2022
(USD Million) 193
13.3.3 2. Canada Parenteral Nutrition Market Revenue, By Application, 2023 – 2030
(USD Million) 193
13.3.4. Type 194
13.3.4.1. Canada Parenteral Nutrition Market Revenue, By Type, 2017 – 2022 (USD Million) 194
13.3.5. Canada Parenteral Nutrition Market Revenue, By Type, 2023 – 2030 (USD
Million) 194
13.3.6. Distribution Channel 195
13.3.6 1. Canada Parenteral Nutrition Market Revenue, By Distribution Channel, 2017 –
2022 (USD Million) 195
13.3.7. Canada Parenteral Nutrition Market Revenue, By Distribution Channel,
2023 – 2030 (USD Million) 195
13.4. Mexico 196
13.4.1. Age Group 196
13.4.1 1. Mexico Parenteral Nutrition Market Revenue, By Age Group, 2017 – 2022
(USD Million) 196
13.4.1 2. Mexico Parenteral Nutrition Market Revenue, By Age Group, 2023 – 2030
(USD Million) 196
13.4.2. End-user 197
13.4.2.1. Mexico Parenteral Nutrition Market Revenue, By End-user, 2017 – 2022 (USD Million) 197
13.4.2.2. Mexico Parenteral Nutrition Market Revenue, By End-user, 2023 – 2030 (USD Million) 197
13.4.3. Application 198
13.4.3 1. Mexico Parenteral Nutrition Market Revenue, By Application, 2017 – 2022
(USD Million) 198
13.4.3 2. Mexico Parenteral Nutrition Market Revenue, By Application, 2023 – 2030
(USD Million) 198
13.4.4. Type 199
13.4.4.1. Mexico Parenteral Nutrition Market Revenue, By Type, 2017 – 2022 (USD Million) 199
13.4.4.2. Mexico Parenteral Nutrition Market Revenue, By Type, 2023 – 2030 (USD Million) 199
13.4.5. Distribution Channel 200

13.4.5.1. Mexico Parenteral Nutrition Market Revenue, By Distribution Channel, 2017 – 2022 (USD Million) 200
13.4.5 2. Mexico Parenteral Nutrition Market Revenue, By Distribution Channel, 2023 –
2030 (USD Million) 200
14.1. Europe 201
14.1 1. Europe Parenteral Nutrition Market Revenue, By Country, 2017 – 2022
(USD Million) 203
14.1.2. Age Group 204
14.1.2 1. Europe Parenteral Nutrition Market Revenue, By Age Group, 2017 – 2022
(USD Million) 204
14.1.2 2. Europe Parenteral Nutrition Market Revenue, By Age Group, 2023 – 2030
(USD Million) 204
14.1.3. End-user 205
14.1.3.1. Europe Parenteral Nutrition Market Revenue, By End-user, 2017 – 2022 (USD Million) 205
14.1.3.2. Europe Parenteral Nutrition Market Revenue, By End-user, 2023 – 2030 (USD Million) 205
14.1.4. Application 206
14.1.4 1. Europe Parenteral Nutrition Market Revenue, By Application, 2017 – 2022
(USD Million) 206
14.1.4 2. Europe Parenteral Nutrition Market Revenue, By Application, 2023 – 2030
(USD Million) 206
14.1.5. Type 207
14.1.5.1. Europe Parenteral Nutrition Market Revenue, By Type, 2017 – 2022 (USD Million) 207
14.1.5.2. Europe Parenteral Nutrition Market Revenue, By Type, 2023 – 2030 (USD Million) 207
14.1.6. Distribution Channel 208
14.1.6 1. Europe Parenteral Nutrition Market Revenue, By Distribution Channel, 2017 –
2022 (USD Million) 208
14.1.6 2. Europe Parenteral Nutrition Market Revenue, By Distribution Channel, 2023 –
2030 (USD Million) 208
14.2. UK 209
14.2.1. Age Group 209
14.2.1.1. UK Parenteral Nutrition Market Revenue, By Age Group, 2017 – 2022 (USD Million) 209
14.2.1.2. UK Parenteral Nutrition Market Revenue, By Age Group, 2023 – 2030 (USD Million) 209

14.2.2. End-user 210
14.2.2.1. UK Parenteral Nutrition Market Revenue, By End-user, 2017 – 2022 (USD Million) 210
14.2.2.2. UK Parenteral Nutrition Market Revenue, By End-user, 2023 – 2030 (USD Million) 210
14.2.3. Application 211
14.2.3.1. UK Parenteral Nutrition Market Revenue, By Application, 2017 – 2022 (USD Million) 211
14.2.3.2. UK Parenteral Nutrition Market Revenue, By Application, 2023 – 2030 (USD Million) 211
14.2.4. Type 212
14.2.4.1. UK Parenteral Nutrition Market Revenue, By Type, 2017 – 2022 (USD Million)
………………………………………………………………………………………………….. 212
14.2.4.2. UK Parenteral Nutrition Market Revenue, By Type, 2023 – 2030 (USD Million)
………………………………………………………………………………………………….. 212
14.2.5. Distribution Channel 213
14.2.5 1. UK Parenteral Nutrition Market Revenue, By Distribution Channel, 2017 –
2022 (USD Million) 213
14.2.5 2. UK Parenteral Nutrition Market Revenue, By Distribution Channel, 2023 –
2030 (USD Million) 213
14.3. France 214
14.3.1. Age Group 214
14.3.1 1. France Parenteral Nutrition Market Revenue, By Age Group, 2017 – 2022
(USD Million) 214
14.3.1 2. France Parenteral Nutrition Market Revenue, By Age Group, 2023 – 2030
(USD Million) 214
14.3.2. End-user 215
14.3.2.1. France Parenteral Nutrition Market Revenue, By End-user, 2017 – 2022 (USD Million) 215
14.3.2.2. France Parenteral Nutrition Market Revenue, By End-user, 2023 – 2030 (USD Million) 215
14.3.3. Application 216
14.3.3 1. France Parenteral Nutrition Market Revenue, By Application, 2017 – 2022
(USD Million) 216
14.3.3 2. France Parenteral Nutrition Market Revenue, By Application, 2023 – 2030
(USD Million) 216
14.3.4. Type 217
14.3.4.1. France Parenteral Nutrition Market Revenue, By Type, 2017 – 2022 (USD Million) 217

14.3.4.2. France Parenteral Nutrition Market Revenue, By Type, 2023 – 2030 (USD Million) 217
14.3.5. Distribution Channel 218
14.3.5 1. France Parenteral Nutrition Market Revenue, By Distribution Channel, 2017 –
2022 (USD Million) 218
14.3.5 2. France Parenteral Nutrition Market Revenue, By Distribution Channel, 2023 –
2030 (USD Million) 218
14.4. Germany 219
14.4.1. Age Group 219
14.4.1 1. Germany Parenteral Nutrition Market Revenue, By Age Group, 2017 – 2022
(USD Million) 219
14.4.1 2. Germany Parenteral Nutrition Market Revenue, By Age Group, 2023 – 2030
(USD Million) 219
14.4.2. End-user 220
14.4.2.1. Germany Parenteral Nutrition Market Revenue, By End-user, 2017 – 2022 (USD Million) 220
14.4.2.2. Germany Parenteral Nutrition Market Revenue, By End-user, 2023 – 2030 (USD Million) 220
14.4.3. Application 221
14.4.3 1. Germany Parenteral Nutrition Market Revenue, By Application, 2017 – 2022
(USD Million) 221
14.4.3 2. Germany Parenteral Nutrition Market Revenue, By Application, 2023 – 2030
(USD Million) 221
14.4.4. Type 222
14.4.4.1. Germany Parenteral Nutrition Market Revenue, By Type, 2017 – 2022 (USD Million) 222
14.4.4.2. Germany Parenteral Nutrition Market Revenue, By Type, 2023 – 2030 (USD Million) 222
14.4.5. Distribution Channel 223
14.4.5.1. Germany Parenteral Nutrition Market Revenue, By Distribution Channel, 2017 – 2022 (USD Million) 223
14.4.5.2. Germany Parenteral Nutrition Market Revenue, By Distribution Channel, 2023 – 2030 (USD Million) 223
14.5. Italy 224
14.5.1. Age Group 224
14.5.1.1. Italy Parenteral Nutrition Market Revenue, By Age Group, 2017 – 2022 (USD Million) 224
14.5.1.2. Italy Parenteral Nutrition Market Revenue, By Age Group, 2023 – 2030 (USD Million) 224
14.5.2. End-user 225

14.5.2.1. Italy Parenteral Nutrition Market Revenue, By End-user, 2017 – 2022 (USD Million) 225
14.5.2.2. Italy Parenteral Nutrition Market Revenue, By End-user, 2023 – 2030 (USD Million) 225
14.5.3. Application 226
14.5.3.1. Italy Parenteral Nutrition Market Revenue, By Application, 2017 – 2022 (USD Million) 226
14.5.3.2. Italy Parenteral Nutrition Market Revenue, By Application, 2023 – 2030 (USD Million) 226
14.5.4. Type 227
14.5.4.1. Italy Parenteral Nutrition Market Revenue, By Type, 2017 – 2022 (USD Million) 227
14.5.4.2. Italy Parenteral Nutrition Market Revenue, By Type, 2023 – 2030 (USD Million) 227
14.5.5. Distribution Channel 228
14.5.5 1. Italy Parenteral Nutrition Market Revenue, By Distribution Channel, 2017 –
2022 (USD Million) 228
14.5.5 2. Italy Parenteral Nutrition Market Revenue, By Distribution Channel, 2023 –
2030 (USD Million) 228
14.6. Spain 229
14.6.1. Age Group 229
14.6.1.1. Spain Parenteral Nutrition Market Revenue, By Age Group, 2017 – 2022 (USD Million) 229
14.6.1.2. Spain Parenteral Nutrition Market Revenue, By Age Group, 2023 – 2030 (USD Million) 229
14.6.2. End-user 230
14.6.2.1. Spain Parenteral Nutrition Market Revenue, By End-user, 2017 – 2022 (USD Million) 230
14.6.2.2. Spain Parenteral Nutrition Market Revenue, By End-user, 2023 – 2030 (USD Million) 230
14.6.3. Application 231
14.6.3.1. Spain Parenteral Nutrition Market Revenue, By Application, 2017 – 2022 (USD Million) 231
14.6.3.2. Spain Parenteral Nutrition Market Revenue, By Application, 2023 – 2030 (USD Million) 231
14.6.4. Type 232
14.6.4.1. Spain Parenteral Nutrition Market Revenue, By Type, 2017 – 2022 (USD Million) 232
14.6.4.2. Spain Parenteral Nutrition Market Revenue, By Type, 2023 – 2030 (USD Million) 232

14.6.5. Distribution Channel 233
14.6.5 1. Spain Parenteral Nutrition Market Revenue, By Distribution Channel, 2017 –
2022 (USD Million) 233
14.6.5 2. Spain Parenteral Nutrition Market Revenue, By Distribution Channel, 2023 –
2030 (USD Million) 233
14.7. Russia 234
14.7.1. Age Group 234
14.7.1.1. Russia Parenteral Nutrition Market Revenue, By Age Group, 2017 – 2022 (USD Million) 234
14.7.1.2. Russia Parenteral Nutrition Market Revenue, By Age Group, 2023 – 2030 (USD Million) 234
14.7.2. End-user 235
14.7.2.1. Russia Parenteral Nutrition Market Revenue, By End-user, 2017 – 2022 (USD Million) 235
14.7.2.2. Russia Parenteral Nutrition Market Revenue, By End-user, 2023 – 2030 (USD Million) 235
14.7.3. Application 236
14.7.3 1. Russia Parenteral Nutrition Market Revenue, By Application, 2017 – 2022
(USD Million) 236
14.7.3 2. Russia Parenteral Nutrition Market Revenue, By Application, 2023 – 2030
(USD Million) 236
14.7.4. Type 237
14.7.4.1. Russia Parenteral Nutrition Market Revenue, By Type, 2017 – 2022 (USD Million) 237
14.7.4.2. Russia Parenteral Nutrition Market Revenue, By Type, 2023 – 2030 (USD Million) 237
14.7.5. Distribution Channel 238
14.7.5 1. Russia Parenteral Nutrition Market Revenue, By Distribution Channel, 2017 –
2022 (USD Million) 238
14.7.5 2. Russia Parenteral Nutrition Market Revenue, By Distribution Channel, 2023 –
2030 (USD Million) 238
14.8. Belgium 239
14.8.1. Age Group 239
14.8.1 1. Belgium Parenteral Nutrition Market Revenue, By Age Group, 2017 – 2022
(USD Million) 239
14.8.1 2. Belgium Parenteral Nutrition Market Revenue, By Age Group, 2023 – 2030
(USD Million) 239
14.8.2. End-user 240
14.8.2.1. Belgium Parenteral Nutrition Market Revenue, By End-user, 2017 – 2022 (USD Million) 240

14.8.2.2. Belgium Parenteral Nutrition Market Revenue, By End-user, 2023 – 2030 (USD Million) 240
14.8.3. Application 241
14.8.3 1. Belgium Parenteral Nutrition Market Revenue, By Application, 2017 – 2022
(USD Million) 241
14.8.3 2. Belgium Parenteral Nutrition Market Revenue, By Application, 2023 – 2030
(USD Million) 241
14.8.4. Type 242
14.8.4.1. Belgium Parenteral Nutrition Market Revenue, By Type, 2017 – 2022 (USD Million) 242
14.8.4.2. Belgium Parenteral Nutrition Market Revenue, By Type, 2023 – 2030 (USD Million) 242
14.8.5. Distribution Channel 243
14.8.5 1. Belgium Parenteral Nutrition Market Revenue, By Distribution Channel, 2017
– 2022 (USD Million) 243
14.8.5 2. Belgium Parenteral Nutrition Market Revenue, By Distribution Channel, 2023
– 2030 (USD Million) 243
14.9. Netherland 244
14.9.1. Age Group 244
14.9.1 1. Netherland Parenteral Nutrition Market Revenue, By Age Group, 2017 – 2022
(USD Million) 244
14.9.1 2. Netherland Parenteral Nutrition Market Revenue, By Age Group, 2023 – 2030
(USD Million) 244
14.9.2. End-user 245
14.9.2.1. Netherland Parenteral Nutrition Market Revenue, By End-user, 2017 – 2022 (USD Million) 245
14.9.2.2. Netherland Parenteral Nutrition Market Revenue, By End-user, 2023 – 2030 (USD Million) 245
14.9.3. Application 246
14.9.3 1. Netherland Parenteral Nutrition Market Revenue, By Application, 2017 – 2022
(USD Million) 246
14.9.3 2. Netherland Parenteral Nutrition Market Revenue, By Application, 2023 – 2030
(USD Million) 246
14.9.4. Type 247
14.9.4.1. Netherland Parenteral Nutrition Market Revenue, By Type, 2017 – 2022 (USD Million) 247
14.9.4.2. Netherland Parenteral Nutrition Market Revenue, By Type, 2023 – 2030 (USD Million) 247
14.9.5. Distribution Channel 248

14.9.5.1. Netherland Parenteral Nutrition Market Revenue, By Distribution Channel, 2017 – 2022 (USD Million) 248
14.9.5.2. Netherland Parenteral Nutrition Market Revenue, By Distribution Channel, 2023 – 2030 (USD Million) 248
14.10. Austria 249
14.10.1. Age Group 249
14.10.1.1. Austria Parenteral Nutrition Market Revenue, By Age Group, 2017 – 2022 (USD Million) 249
14.10.1 2. Austria Parenteral Nutrition Market Revenue, By Age Group, 2023 – 2030
(USD Million) 249
14.10.2. End-user 250
14.10.2.1. Austria Parenteral Nutrition Market Revenue, By End-user, 2017 – 2022 (USD Million) 250
14.10.2.2. Austria Parenteral Nutrition Market Revenue, By End-user, 2023 – 2030 (USD Million) 250
14.10.3. Application 251
14.10.3 1. Austria Parenteral Nutrition Market Revenue, By Application, 2017 – 2022
(USD Million) 251
14.10.3 2. Austria Parenteral Nutrition Market Revenue, By Application, 2023 – 2030
(USD Million) 251
14.10.4. Type 252
14.10.4.1. Austria Parenteral Nutrition Market Revenue, By Type, 2017 – 2022 (USD Million) 252
14.10.4.2. Austria Parenteral Nutrition Market Revenue, By Type, 2023 – 2030 (USD Million) 252
14.10.5. Distribution Channel 253
14.10.5 1. Austria Parenteral Nutrition Market Revenue, By Distribution Channel, 2017 –
2022 (USD Million) 253
14.10.5 2. Austria Parenteral Nutrition Market Revenue, By Distribution Channel, 2023 –
2030 (USD Million) 253
14.11. Sweden 254
14.11.1. Age Group 254
14.11.1.1. Sweden Parenteral Nutrition Market Revenue, By Age Group, 2017 – 2022 (USD Million) 254
14.11.1 2. Sweden Parenteral Nutrition Market Revenue, By Age Group, 2023 – 2030
(USD Million) 254
14.11.2. End-user 255
14.11.2.1. Sweden Parenteral Nutrition Market Revenue, By End-user, 2017 – 2022 (USD Million) 255

14.11.2.2. Sweden Parenteral Nutrition Market Revenue, By End-user, 2023 – 2030 (USD Million) 255
14.11.3. Application 256
14.11.3 1. Sweden Parenteral Nutrition Market Revenue, By Application, 2017 – 2022
(USD Million) 256
14.11.3 2. Sweden Parenteral Nutrition Market Revenue, By Application, 2023 – 2030
(USD Million) 256
14.11.4. Type 257
14.11.4.1. Sweden Parenteral Nutrition Market Revenue, By Type, 2017 – 2022 (USD Million) 257
14.11.4.2. Sweden Parenteral Nutrition Market Revenue, By Type, 2023 – 2030 (USD Million) 257
14.11.5. Distribution Channel 258
14.11.5 1. Sweden Parenteral Nutrition Market Revenue, By Distribution Channel, 2017
– 2022 (USD Million) 258
14.11.5 2. Sweden Parenteral Nutrition Market Revenue, By Distribution Channel, 2023
– 2030 (USD Million) 258
14.12. Poland 259
14.12.1. Age Group 259
14.12.1 1. Poland Parenteral Nutrition Market Revenue, By Age Group, 2017 – 2022
(USD Million) 259
14.12.1 2. Poland Parenteral Nutrition Market Revenue, By Age Group, 2023 – 2030
(USD Million) 259
14.12.2. End-user 260
14.12.2.1. Poland Parenteral Nutrition Market Revenue, By End-user, 2017 – 2022 (USD Million) 260
14.12.2.2. Poland Parenteral Nutrition Market Revenue, By End-user, 2023 – 2030 (USD Million) 260
14.12.3. Application 261
14.12.3 1. Poland Parenteral Nutrition Market Revenue, By Application, 2017 – 2022
(USD Million) 261
14.12.3 2. Poland Parenteral Nutrition Market Revenue, By Application, 2023 – 2030
(USD Million) 261
14.12.4. Type 262
14.12.4.1. Poland Parenteral Nutrition Market Revenue, By Type, 2017 – 2022 (USD Million) 262
14.12.4.2. Poland Parenteral Nutrition Market Revenue, By Type, 2023 – 2030 (USD Million) 262
14.12.5. Distribution Channel 263

14.12.5.1. Poland Parenteral Nutrition Market Revenue, By Distribution Channel, 2017 – 2022 (USD Million) 263
14.12.5 2. Poland Parenteral Nutrition Market Revenue, By Distribution Channel, 2023 –
2030 (USD Million) 263
14.13. Denmark 264
14.13.1. Age Group 264
14.13.1.1. Denmark Parenteral Nutrition Market Revenue, By Age Group, 2017 – 2022 (USD Million) 264
14.13.1 2. Denmark Parenteral Nutrition Market Revenue, By Age Group, 2023 – 2030
(USD Million) 264
14.13.2. End-user 265
14.13.2.1. Denmark Parenteral Nutrition Market Revenue, By End-user, 2017 – 2022 (USD Million) 265
14.13.2.2. Denmark Parenteral Nutrition Market Revenue, By End-user, 2023 – 2030 (USD Million) 265
14.13.3. Application 266
14.13.3 1. Denmark Parenteral Nutrition Market Revenue, By Application, 2017 – 2022
(USD Million) 266
14.13.3 2. Denmark Parenteral Nutrition Market Revenue, By Application, 2023 – 2030
(USD Million) 266
14.13.4. Type 267
14.13.4.1. Denmark Parenteral Nutrition Market Revenue, By Type, 2017 – 2022 (USD Million) 267
14.13.4.2. Denmark Parenteral Nutrition Market Revenue, By Type, 2023 – 2030 (USD Million) 267
14.13.5. Distribution Channel 268
14.13.5.1. Denmark Parenteral Nutrition Market Revenue, By Distribution Channel, 2017 – 2022 (USD Million) 268
14.13.5.2. Denmark Parenteral Nutrition Market Revenue, By Distribution Channel, 2023 – 2030 (USD Million) 268
14.14. Switzerland 269
14.14.1. Age Group 269
14.14.1.1. Switzerland Parenteral Nutrition Market Revenue, By Age Group, 2017 – 2022 (USD Million) 269
14.14.1 2. Switzerland Parenteral Nutrition Market Revenue, By Age Group, 2023 – 2030
(USD Million) 269
14.14.2. End-user 270
14.14.2.1. Switzerland Parenteral Nutrition Market Revenue, By End-user, 2017 – 2022 (USD Million) 270

14.14.2.2. Switzerland Parenteral Nutrition Market Revenue, By End-user, 2023 – 2030 (USD Million) 270
14.14.3. Application 271
14.14.3 1. Switzerland Parenteral Nutrition Market Revenue, By Application, 2017 –
2022 (USD Million) 271
14.14.3 2. Switzerland Parenteral Nutrition Market Revenue, By Application, 2023 –
2030 (USD Million) 271
14.14.4. Type 272
14.14.4.1. Switzerland Parenteral Nutrition Market Revenue, By Type, 2017 – 2022 (USD Million) 272
14.14.4.2. Switzerland Parenteral Nutrition Market Revenue, By Type, 2023 – 2030 (USD Million) 272
14.14.5. Distribution Channel 273
14.14.5.1. Switzerland Parenteral Nutrition Market Revenue, By Distribution Channel, 2017 – 2022 (USD Million) 273
14.14.5.2. Switzerland Parenteral Nutrition Market Revenue, By Distribution Channel, 2023 – 2030 (USD Million) 273
14.15. . Rest of Europe274
14.15.1. Age Group 274
14.15.1.1. Rest of Europe Parenteral Nutrition Market Revenue, By Age Group, 2017 – 2022 (USD Million) 274
14.15.1 2. Rest of Europe Parenteral Nutrition Market Revenue, By Age Group, 2023 –
2030 (USD Million) 274
14.15.2. End-user 275
14.15.2.1. Rest of Europe Parenteral Nutrition Market Revenue, By End-user, 2017 – 2022 (USD Million) 275
14.15.2.2. Rest of Europe Parenteral Nutrition Market Revenue, By End-user, 2023 – 2030 (USD Million) 275
14.15.3. Application 276
14.15.3 1. Rest of Europe Parenteral Nutrition Market Revenue, By Application, 2017 –
2022 (USD Million) 276
14.15.3 2. Rest of Europe Parenteral Nutrition Market Revenue, By Application, 2023 –
2030 (USD Million) 276
14.15.4. Type 277
14.15.4 1. Rest of Europe Parenteral Nutrition Market Revenue, By Type, 2017 – 2022
(USD Million) 277
14.15.4 2. Rest of Europe Parenteral Nutrition Market Revenue, By Type, 2023 – 2030
(USD Million) 277
14.15.5. Distribution Channel 278

14.15.5.1. Rest of Europe Parenteral Nutrition Market Revenue, By Distribution Channel, 2017 – 2022 (USD Million) 278
14.15.5.2. Rest of Europe Parenteral Nutrition Market Revenue, By Distribution Channel, 2023 – 2030 (USD Million) 278
15.1. Asia Pacific 279
15.1.1. Asia Pacific Parenteral Nutrition Market Revenue, By Country, 2017 – 2022
(USD Million) 281
15.1.2. Age Group 282
15.1.2 1. Asia Pacific Parenteral Nutrition Market Revenue, By Age Group, 2017 – 2022
(USD Million) 282
15.1.2 2. Asia Pacific Parenteral Nutrition Market Revenue, By Age Group, 2023 – 2030
(USD Million) 282
15.1.3. End-user 283
15.1.3.1. Asia Pacific Parenteral Nutrition Market Revenue, By End-user, 2017 – 2022 (USD Million) 283
15.1.3.2. Asia Pacific Parenteral Nutrition Market Revenue, By End-user, 2023 – 2030 (USD Million) 283
15.1.4. Application 284
15.1.4 1. Asia Pacific Parenteral Nutrition Market Revenue, By Application, 2017 – 2022
(USD Million) 284
15.1.4 2. Asia Pacific Parenteral Nutrition Market Revenue, By Application, 2023 – 2030
(USD Million) 284
15.1.5. Type 285
15.1.5.1. Asia Pacific Parenteral Nutrition Market Revenue, By Type, 2017 – 2022 (USD Million) 285
15.1.5.2. Asia Pacific Parenteral Nutrition Market Revenue, By Type, 2023 – 2030 (USD Million) 285
15.1.6. Distribution Channel 286
15.1.6.1. Asia Pacific Parenteral Nutrition Market Revenue, By Distribution Channel, 2017 – 2022 (USD Million) 286
15.1.6.2. Asia Pacific Parenteral Nutrition Market Revenue, By Distribution Channel, 2023 – 2030 (USD Million) 286
15.1.7. China 287
15.1.8. Age Group 287
15.1.8.1. China Parenteral Nutrition Market Revenue, By Age Group, 2017 – 2022 (USD Million) 287
15.1.8.2. China Parenteral Nutrition Market Revenue, By Age Group, 2023 – 2030 (USD Million) 287

15.1.9. End-user 288
15.1.9.1. China Parenteral Nutrition Market Revenue, By End-user, 2017 – 2022 (USD Million) 288
15.1.9.2. China Parenteral Nutrition Market Revenue, By End-user, 2023 – 2030 (USD Million) 288
15.1.10. Application 289
15.1.10.1. China Parenteral Nutrition Market Revenue, By Application, 2017 – 2022 (USD Million) 289
15.1.10.2. China Parenteral Nutrition Market Revenue, By Application, 2023 – 2030 (USD Million) 289
15.1.11. Type 290
15.1.11.1. China Parenteral Nutrition Market Revenue, By Type, 2017 – 2022 (USD Million) 290
15.1.11.2. China Parenteral Nutrition Market Revenue, By Type, 2023 – 2030 (USD Million) 290
15.1.12. Distribution Channel 291
15.1.12 1. China Parenteral Nutrition Market Revenue, By Distribution Channel, 2017 –
2022 (USD Million) 291
15.1.12 2. China Parenteral Nutrition Market Revenue, By Distribution Channel, 2023 –
2030 (USD Million) 291
15.1.13. Japan 292
15.1.14. Age Group 292
15.1.14.1. Japan Parenteral Nutrition Market Revenue, By Age Group, 2017 – 2022 (USD Million) 292
15.1.14.2. Japan Parenteral Nutrition Market Revenue, By Age Group, 2023 – 2030 (USD Million) 292
15.1.15. End-user 293
15.1.15.1. Japan Parenteral Nutrition Market Revenue, By End-user, 2017 – 2022 (USD Million) 293
15.1.15.2. Japan Parenteral Nutrition Market Revenue, By End-user, 2023 – 2030 (USD Million) 293
15.1.16. Application 294
15.1.16.1. Japan Parenteral Nutrition Market Revenue, By Application, 2017 – 2022 (USD Million) 294
15.1.16.2. Japan Parenteral Nutrition Market Revenue, By Application, 2023 – 2030 (USD Million) 294
15.1.17. Type 295
15.1.17.1. Japan Parenteral Nutrition Market Revenue, By Type, 2017 – 2022 (USD Million) 295

15.1.17.2. Japan Parenteral Nutrition Market Revenue, By Type, 2023 – 2030 (USD Million) 295
15.1.18. Distribution Channel 296
15.1.18 1. Japan Parenteral Nutrition Market Revenue, By Distribution Channel, 2017 –
2022 (USD Million) 296
15.1.18 2. Japan Parenteral Nutrition Market Revenue, By Distribution Channel, 2023 –
2030 (USD Million) 296
15.1.19. South Korea 297
15.1.20. Age Group 297
15.1.20 1. South Korea Parenteral Nutrition Market Revenue, By Age Group, 2017 –
2022 (USD Million) 297
15.1.20 2. South Korea Parenteral Nutrition Market Revenue, By Age Group, 2023 –
2030 (USD Million) 297
15.1.21. End-user 298
15.1.21.1. South Korea Parenteral Nutrition Market Revenue, By End-user, 2017 – 2022 (USD Million) 298
15.1.21.2. South Korea Parenteral Nutrition Market Revenue, By End-user, 2023 – 2030 (USD Million) 298
15.1.22. Application 299
15.1.22 1. South Korea Parenteral Nutrition Market Revenue, By Application, 2017 –
2022 (USD Million) 299
15.1.22 2. South Korea Parenteral Nutrition Market Revenue, By Application, 2023 –
2030 (USD Million) 299
15.1.23. Type 300
15.1.23.1. South Korea Parenteral Nutrition Market Revenue, By Type, 2017 – 2022 (USD Million) 300
15.1.23.2. South Korea Parenteral Nutrition Market Revenue, By Type, 2023 – 2030 (USD Million) 300
15.1.24. Distribution Channel 301
15.1.24.1. South Korea Parenteral Nutrition Market Revenue, By Distribution Channel, 2017 – 2022 (USD Million) 301
15.1.24.2. South Korea Parenteral Nutrition Market Revenue, By Distribution Channel, 2023 – 2030 (USD Million) 301
15.1.25. India 302
15.1.26. Age Group 302
15.1.26.1. India Parenteral Nutrition Market Revenue, By Age Group, 2017 – 2022 (USD Million) 302
15.1.26.2. India Parenteral Nutrition Market Revenue, By Age Group, 2023 – 2030 (USD Million) 302
15.1.27. End-user 303

15.1.27.1. India Parenteral Nutrition Market Revenue, By End-user, 2017 – 2022 (USD Million) 303
15.1.27.2. India Parenteral Nutrition Market Revenue, By End-user, 2023 – 2030 (USD Million) 303
15.1.28. Application 304
15.1.28.1. India Parenteral Nutrition Market Revenue, By Application, 2017 – 2022 (USD Million) 304
15.1.28.2. India Parenteral Nutrition Market Revenue, By Application, 2023 – 2030 (USD Million) 304
15.1.29. Type 305
15.1.29.1. India Parenteral Nutrition Market Revenue, By Type, 2017 – 2022 (USD Million) 305
15.1.29.2. India Parenteral Nutrition Market Revenue, By Type, 2023 – 2030 (USD Million) 305
15.1.30. Distribution Channel 306
15.1.30 1. India Parenteral Nutrition Market Revenue, By Distribution Channel, 2017 –
2022 (USD Million) 306
15.1.30 2. India Parenteral Nutrition Market Revenue, By Distribution Channel, 2023 –
2030 (USD Million) 306
15.1.31. Australia 307
15.1.32. Age Group 307
15.1.32.1. Australia Parenteral Nutrition Market Revenue, By Age Group, 2017 – 2022 (USD Million) 307
15.1.32 2. Australia Parenteral Nutrition Market Revenue, By Age Group, 2023 – 2030
(USD Million) 307
15.1.33. End-user 308
15.1.33.1. Australia Parenteral Nutrition Market Revenue, By End-user, 2017 – 2022 (USD Million) 308
15.1.33.2. Australia Parenteral Nutrition Market Revenue, By End-user, 2023 – 2030 (USD Million) 308
15.1.34. Application 309
15.1.34 1. Australia Parenteral Nutrition Market Revenue, By Application, 2017 – 2022
(USD Million) 309
15.1.34 2. Australia Parenteral Nutrition Market Revenue, By Application, 2023 – 2030
(USD Million) 309
15.1.35. Type 310
15.1.35.1. Australia Parenteral Nutrition Market Revenue, By Type, 2017 – 2022 (USD Million) 310
15.1.35.2. Australia Parenteral Nutrition Market Revenue, By Type, 2023 – 2030 (USD Million) 310

15.1.36. Distribution Channel 311
15.1.36 1. Australia Parenteral Nutrition Market Revenue, By Distribution Channel, 2017
– 2022 (USD Million) 311
15.1.36 2. Australia Parenteral Nutrition Market Revenue, By Distribution Channel, 2023
– 2030 (USD Million) 311
15.1.37. Thailand 312
15.1.38. Age Group 312
15.1.38 1. Thailand Parenteral Nutrition Market Revenue, By Age Group, 2017 – 2022
(USD Million) 312
15.1.38 2. Thailand Parenteral Nutrition Market Revenue, By Age Group, 2023 – 2030
(USD Million) 312
15.1.39. End-user 313
15.1.39.1. Thailand Parenteral Nutrition Market Revenue, By End-user, 2017 – 2022 (USD Million) 313
15.1.39.2. Thailand Parenteral Nutrition Market Revenue, By End-user, 2023 – 2030 (USD Million) 313
15.1.40. Application 314
15.1.40 1. Thailand Parenteral Nutrition Market Revenue, By Application, 2017 – 2022
(USD Million) 314
15.1.40 2. Thailand Parenteral Nutrition Market Revenue, By Application, 2023 – 2030
(USD Million) 314
15.1.41. Type 315
15.1.41.1. Thailand Parenteral Nutrition Market Revenue, By Type, 2017 – 2022 (USD Million) 315
15.1.41.2. Thailand Parenteral Nutrition Market Revenue, By Type, 2023 – 2030 (USD Million) 315
15.1.42. Distribution Channel 316
15.1.42 1. Thailand Parenteral Nutrition Market Revenue, By Distribution Channel, 2017
– 2022 (USD Million) 316
15.1.42 2. Thailand Parenteral Nutrition Market Revenue, By Distribution Channel, 2023
– 2030 (USD Million) 316
15.1.43. Indonesia 317
15.1.44. Age Group 317
15.1.44.1. Indonesia Parenteral Nutrition Market Revenue, By Age Group, 2017 – 2022 (USD Million) 317
15.1.44 2. Indonesia Parenteral Nutrition Market Revenue, By Age Group, 2023 – 2030
(USD Million) 317
15.1.45. End-user 318
15.1.45.1. Indonesia Parenteral Nutrition Market Revenue, By End-user, 2017 – 2022 (USD Million) 318

15.1.45.2. Indonesia Parenteral Nutrition Market Revenue, By End-user, 2023 – 2030 (USD Million) 318
15.1.46. Application 319
15.1.46 1. Indonesia Parenteral Nutrition Market Revenue, By Application, 2017 – 2022
(USD Million) 319
15.1.46 2. Indonesia Parenteral Nutrition Market Revenue, By Application, 2023 – 2030
(USD Million) 319
15.1.47. Type 320
15.1.47.1. Indonesia Parenteral Nutrition Market Revenue, By Type, 2017 – 2022 (USD Million) 320
15.1.47.2. Indonesia Parenteral Nutrition Market Revenue, By Type, 2023 – 2030 (USD Million) 320
15.1.48. Distribution Channel 321
15.1.48.1. Indonesia Parenteral Nutrition Market Revenue, By Distribution Channel, 2017 – 2022 (USD Million) 321
15.1.48.2. Indonesia Parenteral Nutrition Market Revenue, By Distribution Channel, 2023 – 2030 (USD Million) 321
15.1.49. Vietnam 322
15.1.50. Age Group 322
15.1.50 1. Vietnam Parenteral Nutrition Market Revenue, By Age Group, 2017 – 2022
(USD Million) 322
15.1.50 2. Vietnam Parenteral Nutrition Market Revenue, By Age Group, 2023 – 2030
(USD Million) 322
15.1.51. End-user 323
15.1.51.1. Vietnam Parenteral Nutrition Market Revenue, By End-user, 2017 – 2022 (USD Million) 323
15.1.51.2. Vietnam Parenteral Nutrition Market Revenue, By End-user, 2023 – 2030 (USD Million) 323
15.1.52. Application 324
15.1.52 1. Vietnam Parenteral Nutrition Market Revenue, By Application, 2017 – 2022
(USD Million) 324
15.1.52 2. Vietnam Parenteral Nutrition Market Revenue, By Application, 2023 – 2030
(USD Million) 324
15.1.53. Type 325
15.1.53.1. Vietnam Parenteral Nutrition Market Revenue, By Type, 2017 – 2022 (USD Million) 325
15.1.53.2. Vietnam Parenteral Nutrition Market Revenue, By Type, 2023 – 2030 (USD Million) 325
15.1.54. Distribution Channel 326

15.1.54.1. Vietnam Parenteral Nutrition Market Revenue, By Distribution Channel, 2017
– 2022 (USD Million) 326
15.1.54 2. Vietnam Parenteral Nutrition Market Revenue, By Distribution Channel, 2023
– 2030 (USD Million) 326
15.1.55. Malaysia 327
15.1.56. Age Group 327
15.1.56 1. Malaysia Parenteral Nutrition Market Revenue, By Age Group, 2017 – 2022
(USD Million) 327
15.1.56 2. Malaysia Parenteral Nutrition Market Revenue, By Age Group, 2023 – 2030
(USD Million) 327
15.1.57. End-user 328
15.1.57.1. Malaysia Parenteral Nutrition Market Revenue, By End-user, 2017 – 2022 (USD Million) 328
15.1.57.2. Malaysia Parenteral Nutrition Market Revenue, By End-user, 2023 – 2030 (USD Million) 328
15.1.58. Application 329
15.1.58 1. Malaysia Parenteral Nutrition Market Revenue, By Application, 2017 – 2022
(USD Million) 329
15.1.58 2. Malaysia Parenteral Nutrition Market Revenue, By Application, 2023 – 2030
(USD Million) 329
15.1.59. Type 330
15.1.59.1. Malaysia Parenteral Nutrition Market Revenue, By Type, 2017 – 2022 (USD Million) 330
15.1.59.2. Malaysia Parenteral Nutrition Market Revenue, By Type, 2023 – 2030 (USD Million) 330
15.1.60. Distribution Channel 331
15.1.60 1. Malaysia Parenteral Nutrition Market Revenue, By Distribution Channel, 2017
– 2022 (USD Million) 331
15.1.60 2. Malaysia Parenteral Nutrition Market Revenue, By Distribution Channel, 2023
– 2030 (USD Million) 331
15.1.61. Philippines 332
15.1.62. Age Group 332
15.1.62.1. Philippines Parenteral Nutrition Market Revenue, By Age Group, 2017 – 2022 (USD Million) 332
15.1.62 2. Philippines Parenteral Nutrition Market Revenue, By Age Group, 2023 – 2030
(USD Million) 332
15.1.63. End-user 333
15.1.63.1. Philippines Parenteral Nutrition Market Revenue, By End-user, 2017 – 2022 (USD Million) 333

15.1.63.2. Philippines Parenteral Nutrition Market Revenue, By End-user, 2023 – 2030 (USD Million) 333
15.1.64. Application 334
15.1.64 1. Philippines Parenteral Nutrition Market Revenue, By Application, 2017 – 2022
(USD Million) 334
15.1.64 2. Philippines Parenteral Nutrition Market Revenue, By Application, 2023 – 2030
(USD Million) 334
15.1.65. Type 335
15.1.65.1. Philippines Parenteral Nutrition Market Revenue, By Type, 2017 – 2022 (USD Million) 335
15.1.65.2. Philippines Parenteral Nutrition Market Revenue, By Type, 2023 – 2030 (USD Million) 335
15.1.66. Distribution Channel 336
15.1.66.1. Philippines Parenteral Nutrition Market Revenue, By Distribution Channel, 2017 – 2022 (USD Million) 336
15.1.66.2. Philippines Parenteral Nutrition Market Revenue, By Distribution Channel, 2023 – 2030 (USD Million) 336
15.1.67. Indonesia 337
15.1.68. Age Group 337
15.1.68 1. Indonesia Parenteral Nutrition Market Revenue, By Age Group, 2017 – 2022
(USD Million) 337
15.1.68 2. Indonesia Parenteral Nutrition Market Revenue, By Age Group, 2023 – 2030
(USD Million) 337
15.1.69. End-user 338
15.1.69.1. Indonesia Parenteral Nutrition Market Revenue, By End-user, 2017 – 2022 (USD Million) 338
15.1.69.2. Indonesia Parenteral Nutrition Market Revenue, By End-user, 2023 – 2030 (USD Million) 338
15.1.70. Application 339
15.1.70 1. Indonesia Parenteral Nutrition Market Revenue, By Application, 2017 – 2022
(USD Million) 339
15.1.70 2. Indonesia Parenteral Nutrition Market Revenue, By Application, 2023 – 2030
(USD Million) 339
15.1.71. Type 340
15.1.71.1. Indonesia Parenteral Nutrition Market Revenue, By Type, 2017 – 2022 (USD Million) 340
15.1.71.2. Indonesia Parenteral Nutrition Market Revenue, By Type, 2023 – 2030 (USD Million) 340
15.1.72. Distribution Channel 341

15.1.72.1. Indonesia Parenteral Nutrition Market Revenue, By Distribution Channel, 2017 – 2022 (USD Million) 341
15.1.72.2. Indonesia Parenteral Nutrition Market Revenue, By Distribution Channel, 2023 – 2030 (USD Million) 341
15.1.73. Rest of Asia Pacific 342
15.1.74. Age Group 342
15.1.74.1. Rest of Asia Pacific Parenteral Nutrition Market Revenue, By Age Group, 2017
– 2022 (USD Million) 342
15.1.74 2. Rest of Asia Pacific Parenteral Nutrition Market Revenue, By Age Group, 2023
– 2030 (USD Million) 342
15.1.75. End-user 343
15.1.75.1. Rest of Asia Pacific Parenteral Nutrition Market Revenue, By End-user, 2017 – 2022 (USD Million) 343
15.1.75.2. Rest of Asia Pacific Parenteral Nutrition Market Revenue, By End-user, 2023 – 2030 (USD Million) 343
15.1.76. Application 344
15.1.76.1. Rest of Asia Pacific Parenteral Nutrition Market Revenue, By Application, 2017 – 2022 (USD Million) 344
15.1.76.2. Rest of Asia Pacific Parenteral Nutrition Market Revenue, By Application, 2023 – 2030 (USD Million) 344
15.1.77. Type 345
15.1.77 1. Rest of Asia Pacific Parenteral Nutrition Market Revenue, By Type, 2017 –
2022 (USD Million) 345
15.1.77 2. Rest of Asia Pacific Parenteral Nutrition Market Revenue, By Type, 2023 –
2030 (USD Million) 345
15.1.78. Distribution Channel 346
15.1.78.1. Rest of Asia Pacific Parenteral Nutrition Market Revenue, By Distribution Channel, 2017 – 2022 (USD Million) 346
15.1.78.2. Rest of Asia Pacific Parenteral Nutrition Market Revenue, By Distribution Channel, 2023 – 2030 (USD Million) 346
16.1. Latin America 347
16.1.1. Latin America Parenteral Nutrition Market Revenue, By Country, 2017 –
2022 (USD Million) 349
16.1.2. Age Group 350
16.1.2 1. Latin America Parenteral Nutrition Market Revenue, By Age Group, 2017 –
2022 (USD Million) 350
16.1.2 2. Latin America Parenteral Nutrition Market Revenue, By Age Group, 2023 –
2030 (USD Million) 350

16.1.3. End-user 351
16.1.3.1. Latin America Parenteral Nutrition Market Revenue, By End-user, 2017 – 2022 (USD Million) 351
16.1.3.2. Latin America Parenteral Nutrition Market Revenue, By End-user, 2023 – 2030 (USD Million) 351
16.1.4. Application 352
16.1.4 1. Latin America Parenteral Nutrition Market Revenue, By Application, 2017 –
2022 (USD Million) 352
16.1.4 2. Latin America Parenteral Nutrition Market Revenue, By Application, 2023 –
2030 (USD Million) 352
16.1.5. Type 353
16.1.5 1. Latin America Parenteral Nutrition Market Revenue, By Type, 2017 – 2022
(USD Million) 353
16.1.5 2. Latin America Parenteral Nutrition Market Revenue, By Type, 2023 – 2030
(USD Million) 353
16.1.6. Distribution Channel 354
16.1.6.1. Latin America Parenteral Nutrition Market Revenue, By Distribution Channel, 2017 – 2022 (USD Million) 354
16.1.6.2. Latin America Parenteral Nutrition Market Revenue, By Distribution Channel, 2023 – 2030 (USD Million) 354
16.1.7. Brazil 355
16.1.8. Age Group 355
16.1.8.1. Brazil Parenteral Nutrition Market Revenue, By Age Group, 2017 – 2022 (USD Million) 355
16.1.8.2. Brazil Parenteral Nutrition Market Revenue, By Age Group, 2023 – 2030 (USD Million) 355
16.1.9. End-user 356
16.1.9.1. Brazil Parenteral Nutrition Market Revenue, By End-user, 2017 – 2022 (USD Million) 356
16.1.9.2. Brazil Parenteral Nutrition Market Revenue, By End-user, 2023 – 2030 (USD Million) 356
16.1.10. Application 357
16.1.10.1. Brazil Parenteral Nutrition Market Revenue, By Application, 2017 – 2022 (USD Million) 357
16.1.10.2. Brazil Parenteral Nutrition Market Revenue, By Application, 2023 – 2030 (USD Million) 357
16.1.11. Type 358
16.1.11.1. Brazil Parenteral Nutrition Market Revenue, By Type, 2017 – 2022 (USD Million) 358

16.1.11.2. Brazil Parenteral Nutrition Market Revenue, By Type, 2023 – 2030 (USD Million) 358
16.1.12. Distribution Channel 359
16.1.12 1. Brazil Parenteral Nutrition Market Revenue, By Distribution Channel, 2017 –
2022 (USD Million) 359
16.1.12 2. Brazil Parenteral Nutrition Market Revenue, By Distribution Channel, 2023 –
2030 (USD Million) 359
16.1.13. Argentina 360
16.1.14. Age Group 360
16.1.14 1. Argentina Parenteral Nutrition Market Revenue, By Age Group, 2017 – 2022
(USD Million) 360
16.1.14 2. Argentina Parenteral Nutrition Market Revenue, By Age Group, 2023 – 2030
(USD Million) 360
16.1.15. End-user 361
16.1.15.1. Argentina Parenteral Nutrition Market Revenue, By End-user, 2017 – 2022 (USD Million) 361
16.1.15.2. Argentina Parenteral Nutrition Market Revenue, By End-user, 2023 – 2030 (USD Million) 361
16.1.16. Application 362
16.1.16 1. Argentina Parenteral Nutrition Market Revenue, By Application, 2017 – 2022
(USD Million) 362
16.1.16 2. Argentina Parenteral Nutrition Market Revenue, By Application, 2023 – 2030
(USD Million) 362
16.1.17. Type 363
16.1.17.1. Argentina Parenteral Nutrition Market Revenue, By Type, 2017 – 2022 (USD Million) 363
16.1.17.2. Argentina Parenteral Nutrition Market Revenue, By Type, 2023 – 2030 (USD Million) 363
16.1.18. Distribution Channel 364
16.1.18.1. Argentina Parenteral Nutrition Market Revenue, By Distribution Channel, 2017 – 2022 (USD Million) 364
16.1.18.2. Argentina Parenteral Nutrition Market Revenue, By Distribution Channel, 2023 – 2030 (USD Million) 364
16.1.19. Peru 365
16.1.20. Age Group 365
16.1.20.1. Peru Parenteral Nutrition Market Revenue, By Age Group, 2017 – 2022 (USD Million) 365
16.1.20.2. Peru Parenteral Nutrition Market Revenue, By Age Group, 2023 – 2030 (USD Million) 365
16.1.21. End-user 366

16.1.21.1. Peru Parenteral Nutrition Market Revenue, By End-user, 2017 – 2022 (USD Million) 366
16.1.21.2. Peru Parenteral Nutrition Market Revenue, By End-user, 2023 – 2030 (USD Million) 366
16.1.22. Application 367
16.1.22.1. Peru Parenteral Nutrition Market Revenue, By Application, 2017 – 2022 (USD Million) 367
16.1.22.2. Peru Parenteral Nutrition Market Revenue, By Application, 2023 – 2030 (USD Million) 367
16.1.23. Type 368
16.1.23.1. Peru Parenteral Nutrition Market Revenue, By Type, 2017 – 2022 (USD Million) 368
16.1.23.2. Peru Parenteral Nutrition Market Revenue, By Type, 2023 – 2030 (USD Million) 368
16.1.24. Distribution Channel 369
16.1.24 1. Peru Parenteral Nutrition Market Revenue, By Distribution Channel, 2017 –
2022 (USD Million) 369
16.1.24 2. Peru Parenteral Nutrition Market Revenue, By Distribution Channel, 2023 –
2030 (USD Million) 369
16.1.25. Chile 370
16.1.26. Age Group 370
16.1.26.1. Chile Parenteral Nutrition Market Revenue, By Age Group, 2017 – 2022 (USD Million) 370
16.1.26.2. Chile Parenteral Nutrition Market Revenue, By Age Group, 2023 – 2030 (USD Million) 370
16.1.27. End-user 371
16.1.27.1. Chile Parenteral Nutrition Market Revenue, By End-user, 2017 – 2022 (USD Million) 371
16.1.27.2. Chile Parenteral Nutrition Market Revenue, By End-user, 2023 – 2030 (USD Million) 371
16.1.28. Application 372
16.1.28.1. Chile Parenteral Nutrition Market Revenue, By Application, 2017 – 2022 (USD Million) 372
16.1.28.2. Chile Parenteral Nutrition Market Revenue, By Application, 2023 – 2030 (USD Million) 372
16.1.29. Type 373
16.1.29.1. Chile Parenteral Nutrition Market Revenue, By Type, 2017 – 2022 (USD Million) 373
16.1.29.2. Chile Parenteral Nutrition Market Revenue, By Type, 2023 – 2030 (USD Million) 373

16.1.30. Distribution Channel 374
16.1.30 1. Chile Parenteral Nutrition Market Revenue, By Distribution Channel, 2017 –
2022 (USD Million) 374
16.1.30 2. Chile Parenteral Nutrition Market Revenue, By Distribution Channel, 2023 –
2030 (USD Million) 374
16.1.31. Colombia 375
16.1.32. Age Group 375
16.1.32 1. Colombia Parenteral Nutrition Market Revenue, By Age Group, 2017 – 2022
(USD Million) 375
16.1.32 2. Colombia Parenteral Nutrition Market Revenue, By Age Group, 2023 – 2030
(USD Million) 375
16.1.33. End-user 376
16.1.33.1. Colombia Parenteral Nutrition Market Revenue, By End-user, 2017 – 2022 (USD Million) 376
16.1.33.2. Colombia Parenteral Nutrition Market Revenue, By End-user, 2023 – 2030 (USD Million) 376
16.1.34. Application 377
16.1.34 1. Colombia Parenteral Nutrition Market Revenue, By Application, 2017 – 2022
(USD Million) 377
16.1.34 2. Colombia Parenteral Nutrition Market Revenue, By Application, 2023 – 2030
(USD Million) 377
16.1.35. Type 378
16.1.35.1. Colombia Parenteral Nutrition Market Revenue, By Type, 2017 – 2022 (USD Million) 378
16.1.35.2. Colombia Parenteral Nutrition Market Revenue, By Type, 2023 – 2030 (USD Million) 378
16.1.36. Distribution Channel 379
16.1.36.1. Colombia Parenteral Nutrition Market Revenue, By Distribution Channel, 2017 – 2022 (USD Million) 379
16.1.36.2. Colombia Parenteral Nutrition Market Revenue, By Distribution Channel, 2023 – 2030 (USD Million) 379
16.1.37. Rest of Latin America 380
16.1.38. Age Group 380
16.1.38.1. Rest of Latin America Parenteral Nutrition Market Revenue, By Age Group, 2017 – 2022 (USD Million) 380
16.1.38.2. Rest of Latin America Parenteral Nutrition Market Revenue, By Age Group, 2023 – 2030 (USD Million) 380
16.1.39. End-user 381
16.1.39.1. Rest of Latin America Parenteral Nutrition Market Revenue, By End-user, 2017 – 2022 (USD Million) 381

16.1.39.2. Rest of Latin America Parenteral Nutrition Market Revenue, By End-user, 2023 – 2030 (USD Million) 381
16.1.40. Application 382
16.1.40.1. Rest of Latin America Parenteral Nutrition Market Revenue, By Application, 2017 – 2022 (USD Million) 382
16.1.40.2. Rest of Latin America Parenteral Nutrition Market Revenue, By Application, 2023 – 2030 (USD Million) 382
16.1.41. Type 383
16.1.41 1. Rest of Latin America Parenteral Nutrition Market Revenue, By Type, 2017 –
2022 (USD Million) 383
16.1.41 2. Rest of Latin America Parenteral Nutrition Market Revenue, By Type, 2023 –
2030 (USD Million) 383
16.1.42. Distribution Channel 384
16.1.42.1. Rest of Latin America Parenteral Nutrition Market Revenue, By Distribution Channel, 2017 – 2022 (USD Million) 384
16.1.42.2. Rest of Latin America Parenteral Nutrition Market Revenue, By Distribution Channel, 2023 – 2030 (USD Million) 384
17.1. The Middle-East 385
17.1 1. Middle East Parenteral Nutrition Market Revenue, By Country, 2017 –
2022 (USD Million) 387
17.1.2. Age Group 388
17.1.2 1. Middle East Parenteral Nutrition Market Revenue, By Age Group, 2017 – 2022
(USD Million) 388
17.1.2 2. Middle East Parenteral Nutrition Market Revenue, By Age Group, 2023 – 2030
(USD Million) 388
17.1.3. End-user 389
17.1.3.1. Middle East Parenteral Nutrition Market Revenue, By End-user, 2017 – 2022 (USD Million) 389
17.1.3.2. Middle East Parenteral Nutrition Market Revenue, By End-user, 2023 – 2030 (USD Million) 389
17.1.4. Application 390
17.1.4 1. Middle East Parenteral Nutrition Market Revenue, By Application, 2017 –
2022 (USD Million) 390
17.1.4 2. Middle East Parenteral Nutrition Market Revenue, By Application, 2023 –
2030 (USD Million) 390
17.1.5. Type 391
17.1.5.1. Middle East Parenteral Nutrition Market Revenue, By Type, 2017 – 2022 (USD Million) 391

17.1.5.2. Middle East Parenteral Nutrition Market Revenue, By Type, 2023 – 2030 (USD Million) 391
17.1.6. Distribution Channel 392
17.1.6.1. Middle East Parenteral Nutrition Market Revenue, By Distribution Channel, 2017 – 2022 (USD Million) 392
17.1.6.2. Middle East Parenteral Nutrition Market Revenue, By Distribution Channel, 2023 – 2030 (USD Million) 392
17.1.7. UAE 393
17.1.8. Age Group 393
17.1.8 1. Middle East Parenteral Nutrition Market Revenue, By Age Group, 2017 – 2022
(USD Million) 393
17.1.8.2. UAE Parenteral Nutrition Market Revenue, By Age Group, 2023 – 2030 (USD Million) 393
17.1.9. End-user 394
17.1.9.1. UAE Parenteral Nutrition Market Revenue, By End-user, 2017 – 2022 (USD Million) 394
17.1.9.2. UAE Parenteral Nutrition Market Revenue, By End-user, 2023 – 2030 (USD Million) 394
17.1.10. Application 395
17.1.10.1. UAE Parenteral Nutrition Market Revenue, By Application, 2017 – 2022 (USD Million) 395
17.1.10.2. UAE Parenteral Nutrition Market Revenue, By Application, 2023 – 2030 (USD Million) 395
17.1.11. Type 396
17.1.11.1. UAE Parenteral Nutrition Market Revenue, By Type, 2017 – 2022 (USD Million) 396
17.1.11.2. UAE Parenteral Nutrition Market Revenue, By Type, 2023 – 2030 (USD Million) 396
17.1.12. Distribution Channel 397
17.1.12 1. UAE Parenteral Nutrition Market Revenue, By Distribution Channel, 2017 –
2022 (USD Million) 397
17.1.12 2. UAE Parenteral Nutrition Market Revenue, By Distribution Channel, 2023 –
2030 (USD Million) 397
17.1.13. KSA 398
17.1.14. Age Group 398
17.1.14.1. KSA Parenteral Nutrition Market Revenue, By Age Group, 2017 – 2022 (USD Million) 398
17.1.14.2. KSA Parenteral Nutrition Market Revenue, By Age Group, 2023 – 2030 (USD Million) 398
17.1.15. End-user 399

17.1.15.1. KSA Parenteral Nutrition Market Revenue, By End-user, 2017 – 2022 (USD Million) 399
17.1.15.2. KSA Parenteral Nutrition Market Revenue, By End-user, 2023 – 2030 (USD Million) 399
17.1.16. Application 400
17.1.16.1. KSA Parenteral Nutrition Market Revenue, By Application, 2017 – 2022 (USD Million) 400
17.1.16.2. KSA Parenteral Nutrition Market Revenue, By Application, 2023 – 2030 (USD Million) 400
17.1.17. Type 401
17.1.17.1. KSA Parenteral Nutrition Market Revenue, By Type, 2017 – 2022 (USD Million) 401
17.1.17.2. KSA Parenteral Nutrition Market Revenue, By Type, 2023 – 2030 (USD Million) 401
17.1.18. Distribution Channel 402
17.1.18 1. KSA Parenteral Nutrition Market Revenue, By Distribution Channel, 2017 –
2022 (USD Million) 402
17.1.18 2. KSA Parenteral Nutrition Market Revenue, By Distribution Channel, 2023 –
2030 (USD Million) 402
17.1.19. Israel 403
17.1.20. Age Group 403
17.1.20.1. Israel Parenteral Nutrition Market Revenue, By Age Group, 2017 – 2022 (USD Million) 403
17.1.20.2. Israel Parenteral Nutrition Market Revenue, By Age Group, 2023 – 2030 (USD Million) 403
17.1.21. End-user 404
17.1.21.1. Israel Parenteral Nutrition Market Revenue, By End-user, 2017 – 2022 (USD Million) 404
17.1.21.2. Israel Parenteral Nutrition Market Revenue, By End-user, 2023 – 2030 (USD Million) 404
17.1.22. Application 405
17.1.22.1. Israel Parenteral Nutrition Market Revenue, By Application, 2017 – 2022 (USD Million) 405
17.1.22.2. Israel Parenteral Nutrition Market Revenue, By Application, 2023 – 2030 (USD Million) 405
17.1.23. Type 406
17.1.23.1. Israel Parenteral Nutrition Market Revenue, By Type, 2017 – 2022 (USD Million) 406
17.1.23.2. Israel Parenteral Nutrition Market Revenue, By Type, 2023 – 2030 (USD Million) 406

17.1.24. Distribution Channel 407
17.1.24 1. Israel Parenteral Nutrition Market Revenue, By Distribution Channel, 2017 –
2022 (USD Million) 407
17.1.24 2. Israel Parenteral Nutrition Market Revenue, By Distribution Channel, 2023 –
2030 (USD Million) 407
17.1.25. Turkey 408
17.1.26. Age Group 408
17.1.26.1. Turkey Parenteral Nutrition Market Revenue, By Age Group, 2017 – 2022 (USD Million) 408
17.1.26 2. Turkey Parenteral Nutrition Market Revenue, By Age Group, 2023 – 2030
(USD Million) 408
17.1.27. End-user 409
17.1.27.1. Turkey Parenteral Nutrition Market Revenue, By End-user, 2017 – 2022 (USD Million) 409
17.1.27.2. Turkey Parenteral Nutrition Market Revenue, By End-user, 2023 – 2030 (USD Million) 409
17.1.28. Application 410
17.1.28 1. Turkey Parenteral Nutrition Market Revenue, By Application, 2017 – 2022
(USD Million) 410
17.1.28 2. Turkey Parenteral Nutrition Market Revenue, By Application, 2023 – 2030
(USD Million) 410
17.1.29. Type 411
17.1.29.1. Turkey Parenteral Nutrition Market Revenue, By Type, 2017 – 2022 (USD Million) 411
17.1.29.2. Turkey Parenteral Nutrition Market Revenue, By Type, 2023 – 2030 (USD Million) 411
17.1.30. Distribution Channel 412
17.1.30 1. Turkey Parenteral Nutrition Market Revenue, By Distribution Channel, 2017 –
2022 (USD Million) 412
17.1.30 2. Turkey Parenteral Nutrition Market Revenue, By Distribution Channel, 2023 –
2030 (USD Million) 412
17.1.31. Iran 413
17.1.32. Age Group 413
17.1.32.1. Iran Parenteral Nutrition Market Revenue, By Age Group, 2017 – 2022 (USD Million) 413
17.1.32.2. Iran Parenteral Nutrition Market Revenue, By Age Group, 2023 – 2030 (USD Million) 413
17.1.33. End-user 414
17.1.33.1. Iran Parenteral Nutrition Market Revenue, By End-user, 2017 – 2022 (USD Million) 414

17.1.33.2. Iran Parenteral Nutrition Market Revenue, By End-user, 2023 – 2030 (USD Million) 414
17.1.34. Application 415
17.1.34.1. Iran Parenteral Nutrition Market Revenue, By Application, 2017 – 2022 (USD Million) 415
17.1.34.2. Iran Parenteral Nutrition Market Revenue, By Application, 2023 – 2030 (USD Million) 415
17.1.35. Type 416
17.1.35.1. Iran Parenteral Nutrition Market Revenue, By Type, 2017 – 2022 (USD Million) 416
17.1.35.2. Iran Parenteral Nutrition Market Revenue, By Type, 2023 – 2030 (USD Million) 416
17.1.36. Distribution Channel 417
17.1.36 1. Iran Parenteral Nutrition Market Revenue, By Distribution Channel, 2017 –
2022 (USD Million) 417
17.1.36 2. Iran Parenteral Nutrition Market Revenue, By Distribution Channel, 2023 –
2030 (USD Million) 417
17.1.37. Rest of Middle East 418
17.1.38. Age Group 418
17.1.38.1. Rest of Middle East Parenteral Nutrition Market Revenue, By Age Group, 2017 – 2022 (USD Million) 418
17.1.38.2. Rest of Middle East Parenteral Nutrition Market Revenue, By Age Group, 2023 – 2030 (USD Million) 418
17.1.39. End-user 419
17.1.39.1. Rest of Middle East Parenteral Nutrition Market Revenue, By End-user, 2017 – 2022 (USD Million) 419
17.1.39.2. Rest of Middle East Parenteral Nutrition Market Revenue, By End-user, 2023 – 2030 (USD Million) 419
17.1.40. Application 420
17.1.40.1. Rest of Middle East Parenteral Nutrition Market Revenue, By Application, 2017 – 2022 (USD Million) 420
17.1.40.2. Rest of Middle East Parenteral Nutrition Market Revenue, By Application, 2023 – 2030 (USD Million) 420
17.1.41. Type 421
17.1.41 1. Rest of Middle East Parenteral Nutrition Market Revenue, By Type, 2017 –
2022 (USD Million) 421
17.1.41 2. Rest of Middle East Parenteral Nutrition Market Revenue, By Type, 2023 –
2030 (USD Million) 421
17.1.42. Distribution Channel 422

17.1.42.1. Rest of Middle East Parenteral Nutrition Market Revenue, By Distribution Channel, 2017 – 2022 (USD Million) 422
17.1.42.2. Rest of Middle East Parenteral Nutrition Market Revenue, By Distribution Channel, 2023 – 2030 (USD Million) 422
18.1. Africa 423
18.1.1. Africa Parenteral Nutrition Market Revenue, By Country, 2017 – 2022 (USD Million) 425
18.1.2. Age Group 426
18.1.2.1. Africa Parenteral Nutrition Market Revenue, By Age Group, 2017 – 2022 (USD Million) 426
18.1.2.2. Africa Parenteral Nutrition Market Revenue, By Age Group, 2023 – 2030 (USD Million) 426
18.1.3. End-user 427
18.1.3.1. Africa Parenteral Nutrition Market Revenue, By End-user, 2017 – 2022 (USD Million) 427
18.1.3.2. Africa Parenteral Nutrition Market Revenue, By End-user, 2023 – 2030 (USD Million) 427
18.1.4. Application 428
18.1.4.1. Africa Parenteral Nutrition Market Revenue, By Application, 2017 – 2022 (USD Million) 428
18.1.4.2. Africa Parenteral Nutrition Market Revenue, By Application, 2023 – 2030 (USD Million) 428
18.1.5. Type 429
18.1.5.1. Africa Parenteral Nutrition Market Revenue, By Type, 2017 – 2022 (USD Million) 429
18.1.5.2. Africa Parenteral Nutrition Market Revenue, By Type, 2023 – 2030 (USD Million) 429
18.1.6. Distribution Channel 430
18.1.6 1. Africa Parenteral Nutrition Market Revenue, By Distribution Channel, 2017 –
2022 (USD Million) 430
18.1.6 2. Africa Parenteral Nutrition Market Revenue, By Distribution Channel, 2023 –
2030 (USD Million) 430
18.1.7. South Africa 431
18.1.8. Age Group 431
18.1.8 1. South Africa Parenteral Nutrition Market Revenue, By Age Group, 2017 –
2022 (USD Million) 431
18.1.8 2. South Africa Parenteral Nutrition Market Revenue, By Age Group, 2023 –
2030 (USD Million) 431

18.1.9. End-user 432
18.1.9.1. South Africa Parenteral Nutrition Market Revenue, By End-user, 2017 – 2022 (USD Million) 432
18.1.9.2. South Africa Parenteral Nutrition Market Revenue, By End-user, 2023 – 2030 (USD Million) 432
18.1.10. Application 433
18.1.10 1. South Africa Parenteral Nutrition Market Revenue, By Application, 2017 –
2022 (USD Million) 433
18.1.10 2. South Africa Parenteral Nutrition Market Revenue, By Application, 2023 –
2030 (USD Million) 433
18.1.11. Type 434
18.1.11.1. South Africa Parenteral Nutrition Market Revenue, By Type, 2017 – 2022 (USD Million) 434
18.1.11.2. South Africa Parenteral Nutrition Market Revenue, By Type, 2023 – 2030 (USD Million) 434
18.1.12. Distribution Channel 435
18.1.12.1. South Africa Parenteral Nutrition Market Revenue, By Distribution Channel, 2017 – 2022 (USD Million) 435
18.1.12.2. South Africa Parenteral Nutrition Market Revenue, By Distribution Channel, 2023 – 2030 (USD Million) 435
18.1.13. Egypt 436
18.1.14. Age Group 436
18.1.14.1. Egypt Parenteral Nutrition Market Revenue, By Age Group, 2017 – 2022 (USD Million) 436
18.1.14.2. Egypt Parenteral Nutrition Market Revenue, By Age Group, 2023 – 2030 (USD Million) 436
18.1.15. End-user 437
18.1.15.1. Egypt Parenteral Nutrition Market Revenue, By End-user, 2017 – 2022 (USD Million) 437
18.1.15.2. Egypt Parenteral Nutrition Market Revenue, By End-user, 2023 – 2030 (USD Million) 437
18.1.16. Application 438
18.1.16.1. Egypt Parenteral Nutrition Market Revenue, By Application, 2017 – 2022 (USD Million) 438
18.1.16.2. Egypt Parenteral Nutrition Market Revenue, By Application, 2023 – 2030 (USD Million) 438
18.1.17. Type 439
18.1.17.1. Egypt Parenteral Nutrition Market Revenue, By Type, 2017 – 2022 (USD Million) 439

18.1.17.2. Egypt Parenteral Nutrition Market Revenue, By Type, 2023 – 2030 (USD Million) 439
18.1.18. Distribution Channel 440
18.1.18 1. Egypt Parenteral Nutrition Market Revenue, By Distribution Channel, 2017 –
2022 (USD Million) 440
18.1.18 2. Egypt Parenteral Nutrition Market Revenue, By Distribution Channel, 2023 –
2030 (USD Million) 440
18.1.19. Nigeria 441
18.1.20. Age Group 441
18.1.20 1. Nigeria Parenteral Nutrition Market Revenue, By Age Group, 2017 – 2022
(USD Million) 441
18.1.20 2. Nigeria Parenteral Nutrition Market Revenue, By Age Group, 2023 – 2030
(USD Million) 441
18.1.21. End-user 442
18.1.21.1. Nigeria Parenteral Nutrition Market Revenue, By End-user, 2017 – 2022 (USD Million) 442
18.1.21.2. Nigeria Parenteral Nutrition Market Revenue, By End-user, 2023 – 2030 (USD Million) 442
18.1.22. Application 443
18.1.22 1. Nigeria Parenteral Nutrition Market Revenue, By Application, 2017 – 2022
(USD Million) 443
18.1.22 2. Nigeria Parenteral Nutrition Market Revenue, By Application, 2023 – 2030
(USD Million) 443
18.1.23. Type 444
18.1.23.1. Nigeria Parenteral Nutrition Market Revenue, By Type, 2017 – 2022 (USD Million) 444
18.1.23.2. Nigeria Parenteral Nutrition Market Revenue, By Type, 2023 – 2030 (USD Million) 444
18.1.24. Distribution Channel 445
18.1.24 1. Nigeria Parenteral Nutrition Market Revenue, By Distribution Channel, 2017 –
2022 (USD Million) 445
18.1.24 2. Nigeria Parenteral Nutrition Market Revenue, By Distribution Channel, 2023 –
2030 (USD Million) 445
18.1.25. Algeria 446
18.1.26. Age Group 446
18.1.26.1. Algeria Parenteral Nutrition Market Revenue, By Age Group, 2017 – 2022 (USD Million) 446
18.1.26 2. Algeria Parenteral Nutrition Market Revenue, By Age Group, 2023 – 2030
(USD Million) 446
18.1.27. End-user 447

18.1.27.1. Algeria Parenteral Nutrition Market Revenue, By End-user, 2017 – 2022 (USD Million) 447
18.1.27.2. Algeria Parenteral Nutrition Market Revenue, By End-user, 2023 – 2030 (USD Million) 447
18.1.28. Application 448
18.1.28 1. Algeria Parenteral Nutrition Market Revenue, By Application, 2017 – 2022
(USD Million) 448
18.1.28 2. Algeria Parenteral Nutrition Market Revenue, By Application, 2023 – 2030
(USD Million) 448
18.1.29. Type 449
18.1.29.1. Algeria Parenteral Nutrition Market Revenue, By Type, 2017 – 2022 (USD Million) 449
18.1.29.2. Algeria Parenteral Nutrition Market Revenue, By Type, 2023 – 2030 (USD Million) 449
18.1.30. Distribution Channel 450
18.1.30 1. Algeria Parenteral Nutrition Market Revenue, By Distribution Channel, 2017 –
2022 (USD Million) 450
18.1.30 2. Algeria Parenteral Nutrition Market Revenue, By Distribution Channel, 2023 –
2030 (USD Million) 450
18.1.31. Morocco 451
18.1.32. Age Group 451
18.1.32 1. Morocco Parenteral Nutrition Market Revenue, By Age Group, 2017 – 2022
(USD Million) 451
18.1.32 2. Morocco Parenteral Nutrition Market Revenue, By Age Group, 2023 – 2030
(USD Million) 451
18.1.33. End-user 452
18.1.33.1. Morocco Parenteral Nutrition Market Revenue, By End-user, 2017 – 2022 (USD Million) 452
18.1.33.2. Morocco Parenteral Nutrition Market Revenue, By End-user, 2023 – 2030 (USD Million) 452
18.1.34. Application 453
18.1.34 1. Morocco Parenteral Nutrition Market Revenue, By Application, 2017 – 2022
(USD Million) 453
18.1.34 2. Morocco Parenteral Nutrition Market Revenue, By Application, 2023 – 2030
(USD Million) 453
18.1.35. Type 454
18.1.35.1. Morocco Parenteral Nutrition Market Revenue, By Type, 2017 – 2022 (USD Million) 454
18.1.35.2. Morocco Parenteral Nutrition Market Revenue, By Type, 2023 – 2030 (USD Million) 454

18.1.36. Distribution Channel 455
18.1.36 1. Morocco Parenteral Nutrition Market Revenue, By Distribution Channel, 2017
– 2022 (USD Million) 455
18.1.36 2. Morocco Parenteral Nutrition Market Revenue, By Distribution Channel, 2023
– 2030 (USD Million) 455
18.1.37. Rest of Africa 456
18.1.38. Age Group 456
18.1.38 1. Rest of Africa Parenteral Nutrition Market Revenue, By Age Group, 2017 –
2022 (USD Million) 456
18.1.38 2. Rest of Africa Parenteral Nutrition Market Revenue, By Age Group, 2023 –
2030 (USD Million) 456
18.1.39. End-user 457
18.1.39.1. Rest of Africa Parenteral Nutrition Market Revenue, By End-user, 2017 – 2022 (USD Million) 457
18.1.39.2. Rest of Africa Parenteral Nutrition Market Revenue, By End-user, 2023 – 2030 (USD Million) 457
18.1.40. Application 458
18.1.40 1. Rest of Africa Parenteral Nutrition Market Revenue, By Application, 2017 –
2022 (USD Million) 458
18.1.40 2. Rest of Africa Parenteral Nutrition Market Revenue, By Application, 2023 –
2030 (USD Million) 458
18.1.41. Type 459
18.1.41 1. Rest of Africa Parenteral Nutrition Market Revenue, By Type, 2017 – 2022
(USD Million) 459
18.1.41 2. Rest of Africa Parenteral Nutrition Market Revenue, By Type, 2023 – 2030
(USD Million) 459
18.1.42. Distribution Channel 460
18.1.42.1. Rest of Africa Parenteral Nutrition Market Revenue, By Distribution Channel, 2017 – 2022 (USD Million) 460
18.1.42.2. Rest of Africa Parenteral Nutrition Market Revenue, By Distribution Channel, 2023 – 2030 (USD Million) 460
19.1. Baxter 461
19.1.1. Company Overview 461
19.1.2. Product Portfolio 462
19.1.3. Financial Overview 462
19.2. Allergan 463
19.2.1. Company Overview 463

19.2.2. Product Portfolio 464
19.2.3. Financial Overview 464
19.3. B. Braun Melsungen AG 465
19.3.1. Company Overview 465
19.3.2. Product Portfolio 466
19.3.3. Financial Overview 466
19.4. Otsuka Pharmaceutical Factory, Inc 467
19.4.1. Company Overview 467
19.4.2. Product Portfolio 468
19.4.3. Financial Overview 468
19.5. Grifols, S.A. 469
19.5.1. Company Overview 469
19.5.2. Product Portfolio 470
19.5.3. Financial Overview 470
19.6. Vifor Pharma 471
19.6.1. Company Overview 471
19.6.2. Product Portfolio 472
19.6.3. Financial Overview 472
19.7. Fresenius Kabi AG 473
19.7.1. Company Overview 473
19.7.2. Product Portfolio 473
19.7.3. Financial Overview 474
19.8. Sichuan Kelun Pharmaceutical Co., Ltd 475
19.8.1. Company Overview 475
19.8.2. Product Portfolio 476
19.8.3. Financial Overview 476
19.9. Pfizer Inc. (Hospira Inc.) 477
19.9.1. Company Overview 477
19.9.2. Product Portfolio 478
19.9.3. Financial Overview 478
20.1. Research Methodology 479
20.2. Phase I – Secondary Research 480
20.3. Phase II – Data Modeling 480
20.3.1. Company Share Analysis Model 481

20.3.2. Revenue Based Modeling 481
20.4. Phase III – Primary Research 482
20.5. Research Limitations 483
20.5.1. Assumptions 483

List of Figures

FIG NO. 1. Global Parenteral Nutrition Market Revenue, 2017 – 2030 (USD Million) 79
FIG NO. 2. Porter’s Five Forces Analysis for Global Parenteral Nutrition Market 91
FIG NO. 3. Value Chain Analysis for Global Parenteral Nutrition Market 92
FIG NO. 4. Company Share Analysis, 2022 95
FIG NO. 5. Company Share Analysis, 2022 95
FIG NO. 6. Company Share Analysis, 2022 96
FIG NO. 7. Parenteral Nutrition Market – Company Revenue Market Share, 2022 97
FIG NO. 8. Competitive Benchmarking, 2022 98
FIG NO. 9. Parenteral Nutrition Market Revenue Share, By Age Group, 2022 & 2030 110
FIG NO. 10. Market Attractiveness Analysis, By Age Group 111
FIG NO. 11. Incremental Revenue Growth Opportunity by Age Group 111
FIG NO. 12. Parenteral Nutrition Market Revenue, By Age Group, 2017, 2022, 2026 & 2030 112
FIG NO. 13. Global Parenteral Nutrition Market for Adult, Revenue (USD Million) 2017 – 2030 113
FIG NO. 14. Global Parenteral Nutrition Market for Pediatrics, Revenue (USD Million) 2017 – 2030 115
FIG NO. 15. Parenteral Nutrition Market Revenue Share, By Application, 2022 & 2030 119
FIG NO. 16. Market Attractiveness Analysis, By Application 120
FIG NO. 17. Incremental Revenue Growth Opportunity by Application 120
FIG NO. 18. Parenteral Nutrition Market Revenue, By Application, 2017, 2022, 2026 & 2030 121
FIG NO. 19. Global Parenteral Nutrition Market for Alzheimer’s, Revenue (USD Million) 2017 – 2030 122
FIG NO. 20. Global Parenteral Nutrition Market for CKD, Revenue (USD Million) 2017 – 2030 124
FIG NO. 21. Global Parenteral Nutrition Market for Nutrition Deficiency, Revenue (USD Million) 2017 – 2030 126
FIG NO. 22. Global Parenteral Nutrition Market for Cancer Care, Revenue (USD Million) 2017 – 2030 128
FIG NO. 23. Global Parenteral Nutrition Market for Diabetes, Revenue (USD Million) 2017 – 2030 130
FIG NO. 24. Global Parenteral Nutrition Market for Others, Revenue (USD Million) 2017 – 2030 132
FIG NO. 25. Parenteral Nutrition Market Revenue Share, By Type, 2022 & 2030 136
FIG NO. 26. Market Attractiveness Analysis, By Type 137
FIG NO. 27. Incremental Revenue Growth Opportunity by Type 137
FIG NO. 28. Parenteral Nutrition Market Revenue, By Type, 2017, 2022, 2026 & 2030 138
FIG NO. 29. Global Parenteral Nutrition Market for Carbohydrates, Revenue (USD Million) 2017 –
2030 …………………………………………………………………………………………………………………139
FIG NO. 30. Global Parenteral Nutrition Market for Parenteral Lipid Emulsion, Revenue (USD Million) 2017 – 2030 141
FIG NO. 31. Global Parenteral Nutrition Market for Single Dose Amino Acid Solution, Revenue (USD Million) 2017 – 2030 143
FIG NO. 32. Global Parenteral Nutrition Market for Trace Elements, Revenue (USD Million) 2017 –
2030 …………………………………………………………………………………………………………………145
FIG NO. 33. Global Parenteral Nutrition Market for Others, Revenue (USD Million) 2017 – 2030 147
FIG NO. 34. Parenteral Nutrition Market Revenue Share, By End-user, 2022 & 2030 150
FIG NO. 35. Market Attractiveness Analysis, By End-user 151
FIG NO. 36. Incremental Revenue Growth Opportunity by End-user 151
FIG NO. 37. Parenteral Nutrition Market Revenue, By End-user, 2017, 2022, 2026 & 2030 152

FIG NO. 38. Global Parenteral Nutrition Market for Hospitals, Revenue (USD Million) 2017 – 2030 153
FIG NO. 39. Global Parenteral Nutrition Market for Clinics , Revenue (USD Million) 2017 – 2030 155
FIG NO. 40. Global Parenteral Nutrition Market for Others, Revenue (USD Million) 2017 – 2030 157
FIG NO. 41. Parenteral Nutrition Market Revenue Share, By Distribution Channel, 2022 & 2030 160
FIG NO. 42. Market Attractiveness Analysis, By Distribution Channel 161
FIG NO. 43. Incremental Revenue Growth Opportunity by Distribution Channel 161
FIG NO. 44. Parenteral Nutrition Market Revenue, By Distribution Channel, 2017, 2022, 2026 & 2030 .162 FIG NO. 45. Global Parenteral Nutrition Market for Retail Pharmacies, Revenue (USD Million) 2017 –
2030 …………………………………………………………………………………………………………………163
FIG NO. 46. Global Parenteral Nutrition Market for Online, Revenue (USD Million) 2017 – 2030 165
FIG NO. 47. Global Parenteral Nutrition Market for Institutional Sales, Revenue (USD Million) 2017 –
2030 …………………………………………………………………………………………………………………167
FIG NO. 48. Global Parenteral Nutrition Market Revenue Share, By Region, 2022 & 2030 169
FIG NO. 49. Market Attractiveness Analysis, By Region 170
FIG NO. 50. Incremental Revenue Growth Opportunity by Region 170
FIG NO. 51. Parenteral Nutrition Market Revenue, By Region, 2017, 2022, 2026 & 2030 171
FIG NO. 52. North America Parenteral Nutrition Market Revenue, 2017 – 2030 (USD Million) 178
FIG NO. 53. Europe Parenteral Nutrition Market Revenue, 2017 – 2030 (USD Million) 201
FIG NO. 54. Asia Pacific Parenteral Nutrition Market Revenue, 2017 – 2030 (USD Million) 279
FIG NO. 55. Latin America Parenteral Nutrition Market Revenue, 2017 – 2030 (USD Million) 347
FIG NO. 56. The Middle-East Parenteral Nutrition Market Revenue, 2017 – 2030 (USD Million) 385
FIG NO. 57. Africa Parenteral Nutrition Market Revenue, 2017 – 2022 (USD Million) 423
FIG NO. 58. Research Methodology – Detailed View 479
FIG NO. 59. Research Methodology 480

List of Tables

TABLE NO. 1. : Global Parenteral Nutrition Market: Snapshot 78
TABLE NO. 2. : Drivers for the Parenteral Nutrition Market: Impact Analysis 83
TABLE NO. 3. : Restraints for the Parenteral Nutrition Market: Impact Analysis 86
TABLE NO. 4. : Global Adult Parenteral Nutrition Market Revenue, By Region, 2017 – 2022 (USD Million) .114 TABLE NO. 5. : Global Adult Parenteral Nutrition Market Revenue, By Region, 2023– 2030 (USD Million) 114
TABLE NO. 6. : Global Pediatrics Parenteral Nutrition Market Revenue, By Region, 2017 – 2022 (USD
Million) 116
TABLE NO. 7. : Global Pediatrics Parenteral Nutrition Market Revenue, By Region, 2023– 2030 (USD
Million) 116
TABLE NO. 8. : Global Alzheimer’s Parenteral Nutrition Market Revenue, By Region, 2017 – 2022 (USD Million) 123
TABLE NO. 9. : Global Alzheimer’s Parenteral Nutrition Market Revenue, By Region, 2023– 2030 (USD Million) 123
TABLE NO. 10. : Global CKD Parenteral Nutrition Market Revenue, By Region, 2017 – 2022 (USD Million) 125
TABLE NO. 11. : Global CKD Parenteral Nutrition Market Revenue, By Region, 2023– 2030 (USD Million) 125
TABLE NO. 12. : Global Nutrition Deficiency Parenteral Nutrition Market Revenue, By Region, 2017 – 2022 (USD Million) 127
TABLE NO. 13. : Global Nutrition Deficiency Parenteral Nutrition Market Revenue, By Region, 2023– 2030 (USD Million) 127
TABLE NO. 14. : Global Cancer Care Parenteral Nutrition Market Revenue, By Region, 2017 – 2022 (USD Million) 129
TABLE NO. 15. : Global Cancer Care Parenteral Nutrition Market Revenue, By Region, 2023– 2030 (USD Million) 129
TABLE NO. 16. : Global Diabetes Parenteral Nutrition Market Revenue, By Region, 2017 – 2022 (USD
Million) 131
TABLE NO. 17. : Global Diabetes Parenteral Nutrition Market Revenue, By Region, 2023– 2030 (USD
Million) 131
TABLE NO. 18. : Global Others Parenteral Nutrition Market Revenue, By Region, 2017 – 2022 (USD Million)133 TABLE NO. 19. : Global Others Parenteral Nutrition Market Revenue, By Region, 2023– 2030 (USD Million)133 TABLE NO. 20. : Global Carbohydrates Parenteral Nutrition Market Revenue, By Region, 2017 – 2022 (USD
Million) 140
TABLE NO. 21. : Global Carbohydrates Parenteral Nutrition Market Revenue, By Region, 2023– 2030 (USD Million) 140
TABLE NO. 22. : Global Parenteral Lipid Emulsion Parenteral Nutrition Market Revenue, By Region, 2017 – 2022 (USD Million) 142
TABLE NO. 23. : Global Parenteral Lipid Emulsion Parenteral Nutrition Market Revenue, By Region, 2023– 2030 (USD Million) 142
TABLE NO. 24. : Global Single Dose Amino Acid Solution Parenteral Nutrition Market Revenue, By Region, 2017 – 2022 (USD Million) 144
TABLE NO. 25. : Global Single Dose Amino Acid Solution Parenteral Nutrition Market Revenue, By Region, 2023– 2030 (USD Million) 144

TABLE NO. 26. : Global Trace Elements Parenteral Nutrition Market Revenue, By Region, 2017 – 2022
(USD Million) 146
TABLE NO. 27. : Global Trace Elements Parenteral Nutrition Market Revenue, By Region, 2023– 2030 (USD Million) 146
TABLE NO. 28. : Global Others Parenteral Nutrition Market Revenue, By Region, 2017 – 2022 (USD Million)148 TABLE NO. 29. : Global Others Parenteral Nutrition Market Revenue, By Region, 2023– 2030 (USD Million)148 TABLE NO. 30. : Global Hospitals Parenteral Nutrition Market Revenue, By Region, 2017 – 2022 (USD
Million) 154
TABLE NO. 31. : Global Hospitals Parenteral Nutrition Market Revenue, By Region, 2023– 2030 (USD
Million) 154
TABLE NO. 32. : Global Clinics Parenteral Nutrition Market Revenue, By Region, 2017 – 2022 (USD Million)156 TABLE NO. 33. : Global Clinics Parenteral Nutrition Market Revenue, By Region, 2023– 2030 (USD Million)156 TABLE NO. 34. : Global Others Parenteral Nutrition Market Revenue, By Region, 2017 – 2022 (USD Million)158 TABLE NO. 35. : Global Others Parenteral Nutrition Market Revenue, By Region, 2023– 2030 (USD Million)158 TABLE NO. 36. : Global Retail Pharmacies Parenteral Nutrition Market Revenue, By Region, 2017 – 2022
(USD Million) 164
TABLE NO. 37. : Global Retail Pharmacies Parenteral Nutrition Market Revenue, By Region, 2023– 2030
(USD Million) 164
TABLE NO. 38. : Global Online Parenteral Nutrition Market Revenue, By Region, 2017 – 2022 (USD Million)166 TABLE NO. 39. : Global Online Parenteral Nutrition Market Revenue, By Region, 2023– 2030 (USD Million)166 TABLE NO. 40. : Global Institutional Sales Parenteral Nutrition Market Revenue, By Region, 2017 – 2022
(USD Million) 168
TABLE NO. 41. : Global Institutional Sales Parenteral Nutrition Market Revenue, By Region, 2023– 2030
(USD Million) 168
TABLE NO. 42. : Global Parenteral Nutrition Market Revenue, By Region, 2017 – 2022 (USD Million) 172
TABLE NO. 43. : Global Parenteral Nutrition Market Revenue, By Region, 2023– 2030 (USD Million) 172
TABLE NO. 44. : Global Parenteral Nutrition Market Revenue, By Age Group, 2017 – 2022 (USD Million) 173
TABLE NO. 45. : Global Parenteral Nutrition Market Revenue, By Age Group, 2023– 2030 (USD Million) 173
TABLE NO. 46. : Global Parenteral Nutrition Market Revenue, By End-user, 2017 – 2022 (USD Million) 174
TABLE NO. 47. : Global Parenteral Nutrition Market Revenue, By End-user, 2023– 2030 (USD Million) 174
TABLE NO. 48. : Global Parenteral Nutrition Market Revenue, By Application, 2017 – 2022 (USD Million) 175
TABLE NO. 49. : Global Parenteral Nutrition Market Revenue, By Application, 2023– 2030 (USD Million) 175
TABLE NO. 50. : Global Parenteral Nutrition Market Revenue, By Type, 2017 – 2022 (USD Million) 176
TABLE NO. 51. : Global Parenteral Nutrition Market Revenue, By Type, 2023– 2030 (USD Million) 176
TABLE NO. 52. : Global Parenteral Nutrition Market Revenue, By Distribution Channel, 2017 – 2022 (USD Million) 177
TABLE NO. 53. : Global Parenteral Nutrition Market Revenue, By Distribution Channel, 2023– 2030 (USD Million) 177
TABLE NO. 54. : North America Parenteral Nutrition Market Revenue, By Country, 2017 – 2022 (USD
Million) 180
TABLE NO. 55. : North America Parenteral Nutrition Market Revenue, By Country, 2023– 2030 (USD
Million) 180
TABLE NO. 56. : North America Parenteral Nutrition Market Revenue, By Age Group, 2017 – 2022 (USD Million) 181

TABLE NO. 57. : North America Parenteral Nutrition Market Revenue, By Age Group, 2023– 2030 (USD Million) 181
TABLE NO. 58. : North America Parenteral Nutrition Market Revenue, By End-user, 2017 – 2022 (USD
Million) 182
TABLE NO. 59. : North America Parenteral Nutrition Market Revenue, By End-user, 2023– 2030 (USD
Million) 182
TABLE NO. 60. : North America Parenteral Nutrition Market Revenue, By Application, 2017 – 2022 (USD Million) 183
TABLE NO. 61. : North America Parenteral Nutrition Market Revenue, By Application, 2023– 2030 (USD Million) 183
TABLE NO. 62. : North America Parenteral Nutrition Market Revenue, By Type, 2017 – 2022 (USD Million) .184 TABLE NO. 63. : North America Parenteral Nutrition Market Revenue, By Type, 2023– 2030 (USD Million) .184 TABLE NO. 64. : North America Parenteral Nutrition Market Revenue, By Distribution Channel, 2017 –
2022 (USD Million) 185
TABLE NO. 65. : North America Parenteral Nutrition Market Revenue, By Distribution Channel, 2023–
2030 (USD Million) 185
TABLE NO. 66. : U.S. Parenteral Nutrition Market Revenue, By Age Group, 2017 – 2022 (USD Million) 186
TABLE NO. 67. : U.S. Parenteral Nutrition Market Revenue, By Age Group, 2023– 2030 (USD Million) 186
TABLE NO. 68. : U.S. Parenteral Nutrition Market Revenue, By End-user, 2017 – 2022 (USD Million) 187
TABLE NO. 69. : U.S. Parenteral Nutrition Market Revenue, By End-user, 2023– 2030 (USD Million) 187
TABLE NO. 70. : U.S. Parenteral Nutrition Market Revenue, By Application, 2017 – 2022 (USD Million) 188
TABLE NO. 71. : U.S. Parenteral Nutrition Market Revenue, By Application, 2023– 2030 (USD Million) 188
TABLE NO. 72. : U.S. Parenteral Nutrition Market Revenue, By Type, 2017 – 2022 (USD Million) 189
TABLE NO. 73. : U.S. Parenteral Nutrition Market Revenue, By Type, 2023– 2030 (USD Million) 189
TABLE NO. 74. : U.S. Parenteral Nutrition Market Revenue, By Distribution Channel, 2017 – 2022 (USD Million) 190
TABLE NO. 75. : U.S. Parenteral Nutrition Market Revenue, By Distribution Channel, 2023– 2030 (USD Million) 190
TABLE NO. 76. : Canada Parenteral Nutrition Market Revenue, By Age Group, 2017 – 2022 (USD Million) 191
TABLE NO. 77. : Canada Parenteral Nutrition Market Revenue, By Age Group, 2023– 2030 (USD Million) 191
TABLE NO. 78. : Canada Parenteral Nutrition Market Revenue, By End-user, 2017 – 2022 (USD Million) 192
TABLE NO. 79. : Canada Parenteral Nutrition Market Revenue, By End-user, 2023– 2030 (USD Million) 192
TABLE NO. 80. : Canada Parenteral Nutrition Market Revenue, By Application, 2017 – 2022 (USD Million) 193
TABLE NO. 81. : Canada Parenteral Nutrition Market Revenue, By Application, 2023– 2030 (USD Million) 193
TABLE NO. 82. : Canada Parenteral Nutrition Market Revenue, By Type, 2017 – 2022 (USD Million) 194
TABLE NO. 83. : Canada Parenteral Nutrition Market Revenue, By Type, 2023– 2030 (USD Million) 194
TABLE NO. 84. : Canada Parenteral Nutrition Market Revenue, By Distribution Channel, 2017 – 2022 (USD Million) 195
TABLE NO. 85. : Canada Parenteral Nutrition Market Revenue, By Distribution Channel, 2023– 2030 (USD Million) 195
TABLE NO. 86. : Mexico Parenteral Nutrition Market Revenue, By Age Group, 2017 – 2022 (USD Million) 196
TABLE NO. 87. : Mexico Parenteral Nutrition Market Revenue, By Age Group, 2023– 2030 (USD Million) 196
TABLE NO. 88. : Mexico Parenteral Nutrition Market Revenue, By End-user, 2017 – 2022 (USD Million) 197
TABLE NO. 89. : Mexico Parenteral Nutrition Market Revenue, By End-user, 2023– 2030 (USD Million) 197
TABLE NO. 90. : Mexico Parenteral Nutrition Market Revenue, By Application, 2017 – 2022 (USD Million) 198

TABLE NO. 91. : Mexico Parenteral Nutrition Market Revenue, By Application, 2023– 2030 (USD Million)…198 TABLE NO. 92. : Mexico Parenteral Nutrition Market Revenue, By Type, 2017 – 2022 (USD Million) 199
TABLE NO. 93. : Mexico Parenteral Nutrition Market Revenue, By Type, 2023– 2030 (USD Million) 199
TABLE NO. 94. : Mexico Parenteral Nutrition Market Revenue, By Distribution Channel, 2017 – 2022 (USD Million) 200
TABLE NO. 95. : Mexico Parenteral Nutrition Market Revenue, By Distribution Channel, 2023– 2030 (USD Million) 200
TABLE NO. 96. : Europe Parenteral Nutrition Market Revenue, By Country, 2017 – 2022 (USD Million) 203
TABLE NO. 97. : Europe Parenteral Nutrition Market Revenue, By Country, 2023– 2030 (USD Million) 203
TABLE NO. 98. : Europe Parenteral Nutrition Market Revenue, By Age Group, 2017 – 2022 (USD Million) 204
TABLE NO. 99. : Europe Parenteral Nutrition Market Revenue, By Age Group, 2023– 2030 (USD Million) 204
TABLE NO. 100. : Europe Parenteral Nutrition Market Revenue, By End-user, 2017 – 2022 (USD Million) 205
TABLE NO. 101. : Europe Parenteral Nutrition Market Revenue, By End-user, 2023– 2030 (USD Million) 205
TABLE NO. 102. : Europe Parenteral Nutrition Market Revenue, By Application, 2017 – 2022 (USD Million) 206
TABLE NO. 103. : Europe Parenteral Nutrition Market Revenue, By Application, 2023– 2030 (USD Million) 206
TABLE NO. 104. : Europe Parenteral Nutrition Market Revenue, By Type, 2017 – 2022 (USD Million) 207
TABLE NO. 105. : Europe Parenteral Nutrition Market Revenue, By Type, 2023– 2030 (USD Million) 207
TABLE NO. 106. : Europe Parenteral Nutrition Market Revenue, By Distribution Channel, 2017 – 2022 (USD Million) 208
TABLE NO. 107. : Europe Parenteral Nutrition Market Revenue, By Distribution Channel, 2023– 2030 (USD Million) 208
TABLE NO. 108. : UK Parenteral Nutrition Market Revenue, By Age Group, 2017 – 2022 (USD Million) 209
TABLE NO. 109. : UK Parenteral Nutrition Market Revenue, By Age Group, 2023– 2030 (USD Million) 209
TABLE NO. 110. : UK Parenteral Nutrition Market Revenue, By End-user, 2017 – 2022 (USD Million) 210
TABLE NO. 111. : UK Parenteral Nutrition Market Revenue, By End-user, 2023– 2030 (USD Million) 210
TABLE NO. 112. : UK Parenteral Nutrition Market Revenue, By Application, 2017 – 2022 (USD Million) 211
TABLE NO. 113. : UK Parenteral Nutrition Market Revenue, By Application, 2023– 2030 (USD Million) 211
TABLE NO. 114. : UK Parenteral Nutrition Market Revenue, By Type, 2017 – 2022 (USD Million) 212
TABLE NO. 115. : UK Parenteral Nutrition Market Revenue, By Type, 2023– 2030 (USD Million) 212
TABLE NO. 116. : UK Parenteral Nutrition Market Revenue, By Distribution Channel, 2017 – 2022 (USD
Million) 213
TABLE NO. 117. : UK Parenteral Nutrition Market Revenue, By Distribution Channel, 2023– 2030 (USD
Million) 213
TABLE NO. 118. : France Parenteral Nutrition Market Revenue, By Age Group, 2017 – 2022 (USD Million) 214
TABLE NO. 119. : France Parenteral Nutrition Market Revenue, By Age Group, 2023– 2030 (USD Million) 214
TABLE NO. 120. : France Parenteral Nutrition Market Revenue, By End-user, 2017 – 2022 (USD Million) 215
TABLE NO. 121. : France Parenteral Nutrition Market Revenue, By End-user, 2023– 2030 (USD Million) 215
TABLE NO. 122. : France Parenteral Nutrition Market Revenue, By Application, 2017 – 2022 (USD Million) 216
TABLE NO. 123. : France Parenteral Nutrition Market Revenue, By Application, 2023– 2030 (USD Million) 216
TABLE NO. 124. : France Parenteral Nutrition Market Revenue, By Type, 2017 – 2022 (USD Million) 217
TABLE NO. 125. : France Parenteral Nutrition Market Revenue, By Type, 2023– 2030 (USD Million) 217
TABLE NO. 126. : France Parenteral Nutrition Market Revenue, By Distribution Channel, 2017 – 2022 (USD Million) 218
TABLE NO. 127. : France Parenteral Nutrition Market Revenue, By Distribution Channel, 2023– 2030 (USD Million) 218

TABLE NO. 128. : Germany Parenteral Nutrition Market Revenue, By Age Group, 2017 – 2022 (USD Million).219 TABLE NO. 129. : Germany Parenteral Nutrition Market Revenue, By Age Group, 2023– 2030 (USD Million).219 TABLE NO. 130. : Germany Parenteral Nutrition Market Revenue, By End-user, 2017 – 2022 (USD Million) …220 TABLE NO. 131. : Germany Parenteral Nutrition Market Revenue, By End-user, 2023– 2030 (USD Million) …220 TABLE NO. 132. : Germany Parenteral Nutrition Market Revenue, By Application, 2017 – 2022 (USD Million)221 TABLE NO. 133. : Germany Parenteral Nutrition Market Revenue, By Application, 2023– 2030 (USD Million)221 TABLE NO. 134. : Germany Parenteral Nutrition Market Revenue, By Type, 2017 – 2022 (USD Million) 222
TABLE NO. 135. : Germany Parenteral Nutrition Market Revenue, By Type, 2023– 2030 (USD Million) 222
TABLE NO 136. : Germany Parenteral Nutrition Market Revenue, By Distribution Channel, 2017 – 2022
(USD Million) 223
TABLE NO 137. : Germany Parenteral Nutrition Market Revenue, By Distribution Channel, 2023– 2030
(USD Million) 223
TABLE NO. 138. : Italy Parenteral Nutrition Market Revenue, By Age Group, 2017 – 2022 (USD Million) 224
TABLE NO. 139. : Italy Parenteral Nutrition Market Revenue, By Age Group, 2023– 2030 (USD Million) 224
TABLE NO. 140. : Italy Parenteral Nutrition Market Revenue, By End-user, 2017 – 2022 (USD Million) 225
TABLE NO. 141. : Italy Parenteral Nutrition Market Revenue, By End-user, 2023– 2030 (USD Million) 225
TABLE NO. 142. : Italy Parenteral Nutrition Market Revenue, By Application, 2017 – 2022 (USD Million) 226
TABLE NO. 143. : Italy Parenteral Nutrition Market Revenue, By Application, 2023– 2030 (USD Million) 226
TABLE NO. 144. : Italy Parenteral Nutrition Market Revenue, By Type, 2017 – 2022 (USD Million) 227
TABLE NO. 145. : Italy Parenteral Nutrition Market Revenue, By Type, 2023– 2030 (USD Million) 227
TABLE NO. 146. : Italy Parenteral Nutrition Market Revenue, By Distribution Channel, 2017 – 2022 (USD Million) 228
TABLE NO. 147. : Italy Parenteral Nutrition Market Revenue, By Distribution Channel, 2023– 2030 (USD Million) 228
TABLE NO. 148. : Spain Parenteral Nutrition Market Revenue, By Age Group, 2017 – 2022 (USD Million) 229
TABLE NO. 149. : Global Parenteral Nutrition Market Revenue, By Age Group, 2023– 2030 (USD Million) 229
TABLE NO. 150. : Spain Parenteral Nutrition Market Revenue, By End-user, 2017 – 2022 (USD Million) 230
TABLE NO. 151. : Spain Parenteral Nutrition Market Revenue, By End-user, 2023– 2030 (USD Million) 230
TABLE NO. 152. : Spain Parenteral Nutrition Market Revenue, By Application, 2017 – 2022 (USD Million) 231
TABLE NO. 153. : Spain Parenteral Nutrition Market Revenue, By Application, 2023– 2030 (USD Million) 231
TABLE NO. 154. : Spain Parenteral Nutrition Market Revenue, By Type, 2017 – 2022 (USD Million) 232
TABLE NO. 155. : Spain Parenteral Nutrition Market Revenue, By Type, 2023– 2030 (USD Million) 232
TABLE NO. 156. : Spain Parenteral Nutrition Market Revenue, By Distribution Channel, 2017 – 2022 (USD Million) 233
TABLE NO. 157. : Spain Parenteral Nutrition Market Revenue, By Distribution Channel, 2023– 2030 (USD Million) 233
TABLE NO. 158. : Russia Parenteral Nutrition Market Revenue, By Age Group, 2017 – 2022 (USD Million) 234
TABLE NO. 159. : Russia Parenteral Nutrition Market Revenue, By Age Group, 2023– 2030 (USD Million) 234
TABLE NO. 160. : Russia Parenteral Nutrition Market Revenue, By End-user, 2017 – 2022 (USD Million) 235
TABLE NO. 161. : Russia Parenteral Nutrition Market Revenue, By End-user, 2023– 2030 (USD Million) 235
TABLE NO. 162. : Russia Parenteral Nutrition Market Revenue, By Application, 2017 – 2022 (USD Million) 236
TABLE NO. 163. : Russia Parenteral Nutrition Market Revenue, By Application, 2023– 2030 (USD Million) 236
TABLE NO. 164. : Russia Parenteral Nutrition Market Revenue, By Type, 2017 – 2022 (USD Million) 237
TABLE NO. 165. : Russia Parenteral Nutrition Market Revenue, By Type, 2023– 2030 (USD Million) 237

TABLE NO. 166. : Russia Parenteral Nutrition Market Revenue, By Distribution Channel, 2017 – 2022 (USD Million) 238
TABLE NO. 167. : Russia Parenteral Nutrition Market Revenue, By Distribution Channel, 2023– 2030 (USD Million) 238
TABLE NO. 168. : Belgium Parenteral Nutrition Market Revenue, By Age Group, 2017 – 2022 (USD Million) 239
TABLE NO. 169. : Belgium Parenteral Nutrition Market Revenue, By Age Group, 2023– 2030 (USD Million) 239
TABLE NO. 170. : Belgium Parenteral Nutrition Market Revenue, By End-user, 2017 – 2022 (USD Million) 240
TABLE NO. 171. : Belgium Parenteral Nutrition Market Revenue, By End-user, 2023– 2030 (USD Million) 240
TABLE NO. 172. : Belgium Parenteral Nutrition Market Revenue, By Application, 2017 – 2022 (USD Million) .241 TABLE NO. 173. : Belgium Parenteral Nutrition Market Revenue, By Application, 2023– 2030 (USD Million) .241 TABLE NO. 174. : Belgium Parenteral Nutrition Market Revenue, By Type, 2017 – 2022 (USD Million) 242
TABLE NO. 175. : Belgium Parenteral Nutrition Market Revenue, By Type, 2023– 2030 (USD Million) 242
TABLE NO. 176. : Belgium Parenteral Nutrition Market Revenue, By Distribution Channel, 2017 – 2022 (USD Million) 243
TABLE NO. 177. : Belgium Parenteral Nutrition Market Revenue, By Distribution Channel, 2023– 2030 (USD Million) 243
TABLE NO. 178. : Netherland Parenteral Nutrition Market Revenue, By Age Group, 2017 – 2022 (USD
Million) 244
TABLE NO. 179. : Netherland Parenteral Nutrition Market Revenue, By Age Group, 2023– 2030 (USD
Million) 244
TABLE NO. 180. : Netherland Parenteral Nutrition Market Revenue, By End-user, 2017 – 2022 (USD Million) 245 TABLE NO. 181. : Netherland Parenteral Nutrition Market Revenue, By End-user, 2023– 2030 (USD Million) 245 TABLE NO. 182. : Netherland Parenteral Nutrition Market Revenue, By Application, 2017 – 2022 (USD
Million) 246
TABLE NO. 183. : Netherland Parenteral Nutrition Market Revenue, By Application, 2023– 2030 (USD
Million) 246
TABLE NO. 184. : Netherland Parenteral Nutrition Market Revenue, By Type, 2017 – 2022 (USD Million) 247
TABLE NO. 185. : Netherland Parenteral Nutrition Market Revenue, By Type, 2023– 2030 (USD Million) 247
TABLE NO 186. : Netherland Parenteral Nutrition Market Revenue, By Distribution Channel, 2017 – 2022
(USD Million) 248
TABLE NO 187. : Netherland Parenteral Nutrition Market Revenue, By Distribution Channel, 2023– 2030
(USD Million) 248
TABLE NO. 188. : Austria Parenteral Nutrition Market Revenue, By Age Group, 2017 – 2022 (USD Million) 249
TABLE NO. 189. : Austria Parenteral Nutrition Market Revenue, By Age Group, 2023– 2030 (USD Million) 249
TABLE NO. 190. : Austria Parenteral Nutrition Market Revenue, By End-user, 2017 – 2022 (USD Million) 250
TABLE NO. 191. : Austria Parenteral Nutrition Market Revenue, By End-user, 2023– 2030 (USD Million) 250
TABLE NO. 192. : Austria Parenteral Nutrition Market Revenue, By Application, 2017 – 2022 (USD Million) 251
TABLE NO. 193. : Austria Parenteral Nutrition Market Revenue, By Application, 2023– 2030 (USD Million) 251
TABLE NO. 194. : Austria Parenteral Nutrition Market Revenue, By Type, 2017 – 2022 (USD Million) 252
TABLE NO. 195. : Austria Parenteral Nutrition Market Revenue, By Type, 2023– 2030 (USD Million) 252
TABLE NO. 196. : Austria Parenteral Nutrition Market Revenue, By Distribution Channel, 2017 – 2022 (USD Million) 253
TABLE NO. 197. : Austria Parenteral Nutrition Market Revenue, By Distribution Channel, 2023– 2030 (USD Million) 253
TABLE NO. 198. : Sweden Parenteral Nutrition Market Revenue, By Age Group, 2017 – 2022 (USD Million) 254

TABLE NO. 199. : Sweden Parenteral Nutrition Market Revenue, By Age Group, 2023– 2030 (USD Million)…254 TABLE NO. 200. : Sweden Parenteral Nutrition Market Revenue, By End-user, 2017 – 2022 (USD Million) 255
TABLE NO. 201. : Sweden Parenteral Nutrition Market Revenue, By End-user, 2023– 2030 (USD Million) 255
TABLE NO. 202. : Sweden Parenteral Nutrition Market Revenue, By Application, 2017 – 2022 (USD Million) .256 TABLE NO. 203. : Sweden Parenteral Nutrition Market Revenue, By Application, 2023– 2030 (USD Million) 256
TABLE NO. 204. : Sweden Parenteral Nutrition Market Revenue, By Type, 2017 – 2022 (USD Million) 257
TABLE NO. 205. : Sweden Parenteral Nutrition Market Revenue, By Type, 2023– 2030 (USD Million) 257
TABLE NO. 206. : Sweden Parenteral Nutrition Market Revenue, By Distribution Channel, 2017 – 2022 (USD Million) 258
TABLE NO. 207. : Sweden Parenteral Nutrition Market Revenue, By Distribution Channel, 2023– 2030 (USD Million) 258
TABLE NO. 208. : Poland Parenteral Nutrition Market Revenue, By Age Group, 2017 – 2022 (USD Million) 259
TABLE NO. 209. : Poland Parenteral Nutrition Market Revenue, By Age Group, 2023– 2030 (USD Million) 259
TABLE NO. 210. : Poland Parenteral Nutrition Market Revenue, By End-user, 2017 – 2022 (USD Million) 260
TABLE NO. 211. : Poland Parenteral Nutrition Market Revenue, By End-user, 2023– 2030 (USD Million) 260
TABLE NO. 212. : Poland Parenteral Nutrition Market Revenue, By Application, 2017 – 2022 (USD Million) 261
TABLE NO. 213. : Poland Parenteral Nutrition Market Revenue, By Application, 2023– 2030 (USD Million) 261
TABLE NO. 214. : Poland Parenteral Nutrition Market Revenue, By Type, 2017 – 2022 (USD Million) 262
TABLE NO. 215. : Poland Parenteral Nutrition Market Revenue, By Type, 2023– 2030 (USD Million) 262
TABLE NO. 216. : Poland Parenteral Nutrition Market Revenue, By Distribution Channel, 2017 – 2022 (USD Million) 263
TABLE NO. 217. : Poland Parenteral Nutrition Market Revenue, By Distribution Channel, 2023– 2030 (USD Million) 263
TABLE NO. 218. : Denmark Parenteral Nutrition Market Revenue, By Age Group, 2017 – 2022 (USD Million).264 TABLE NO. 219. : Denmark Parenteral Nutrition Market Revenue, By Age Group, 2023– 2030 (USD Million).264 TABLE NO. 220. : Denmark Parenteral Nutrition Market Revenue, By End-user, 2017 – 2022 (USD Million) 265
TABLE NO. 221. : Denmark Parenteral Nutrition Market Revenue, By End-user, 2023– 2030 (USD Million) 265
TABLE NO. 222. : Denmark Parenteral Nutrition Market Revenue, By Application, 2017 – 2022 (USD Million)266 TABLE NO 223. : Denmark Parenteral Nutrition Market Revenue, By Application, 2023– 2030 (USD Million)266
TABLE NO. 224. : Denmark Parenteral Nutrition Market Revenue, By Type, 2017 – 2022 (USD Million) 267
TABLE NO. 225. : Denmark Parenteral Nutrition Market Revenue, By Type, 2023– 2030 (USD Million) 267
TABLE NO 226. : Denmark Parenteral Nutrition Market Revenue, By Distribution Channel, 2017 – 2022
(USD Million) 268
TABLE NO 227. : Denmark Parenteral Nutrition Market Revenue, By Distribution Channel, 2023– 2030
(USD Million) 268
TABLE NO. 228. : Switzerland Parenteral Nutrition Market Revenue, By Age Group, 2017 – 2022 (USD
Million) 269
TABLE NO. 229. : Switzerland Parenteral Nutrition Market Revenue, By Age Group, 2023– 2030 (USD
Million) 269
TABLE NO. 230. : Switzerland Parenteral Nutrition Market Revenue, By End-user, 2017 – 2022 (USD Million)270 TABLE NO. 231. : Switzerland Parenteral Nutrition Market Revenue, By End-user, 2023– 2030 (USD Million)270 TABLE NO. 232. : Switzerland Parenteral Nutrition Market Revenue, By Application, 2017 – 2022 (USD
Million) 271
TABLE NO. 233. : Switzerland Parenteral Nutrition Market Revenue, By Application, 2023– 2030 (USD
Million) 271

TABLE NO. 234. : Switzerland Parenteral Nutrition Market Revenue, By Type, 2017 – 2022 (USD Million) 272
TABLE NO. 235. : Switzerland Parenteral Nutrition Market Revenue, By Type, 2023– 2030 (USD Million) 272
TABLE NO 236. : Switzerland Parenteral Nutrition Market Revenue, By Distribution Channel, 2017 – 2022
(USD Million) 273
TABLE NO 237. : Switzerland Parenteral Nutrition Market Revenue, By Distribution Channel, 2023– 2030
(USD Million) 273
TABLE NO. 238. : Rest of Europe Parenteral Nutrition Market Revenue, By Age Group, 2017 – 2022 (USD Million) 274
TABLE NO. 239. : Rest of Europe Parenteral Nutrition Market Revenue, By Age Group, 2023– 2030 (USD Million) 274
TABLE NO. 240. : Rest of Europe Parenteral Nutrition Market Revenue, By End-user, 2017 – 2022 (USD
Million) 275
TABLE NO. 241. : Rest of Europe Parenteral Nutrition Market Revenue, By End-user, 2023– 2030 (USD
Million) 275
TABLE NO. 242. : Rest of Europe Parenteral Nutrition Market Revenue, By Application, 2017 – 2022 (USD Million) 276
TABLE NO. 243. : Rest of Europe Parenteral Nutrition Market Revenue, By Application, 2023– 2030 (USD Million) 276
TABLE NO. 244. : Rest of Europe Parenteral Nutrition Market Revenue, By Type, 2017 – 2022 (USD Million) .277 TABLE NO. 245. : Rest of Europe Parenteral Nutrition Market Revenue, By Type, 2023– 2030 (USD Million) .277 TABLE NO 246. : Rest of Europe Parenteral Nutrition Market Revenue, By Distribution Channel, 2017 –
2022 (USD Million) 278
TABLE NO 247. : Rest of Europe Parenteral Nutrition Market Revenue, By Distribution Channel, 2023–
2030 (USD Million) 278
TABLE NO. 248. : Asia Pacific Parenteral Nutrition Market Revenue, By Country, 2017 – 2022 (USD Million) 281
TABLE NO. 249. : Asia Pacific Parenteral Nutrition Market Revenue, By Country, 2023– 2030 (USD Million) 281
TABLE NO. 250. : Asia Pacific Parenteral Nutrition Market Revenue, By Age Group, 2017 – 2022 (USD
Million) 282
TABLE NO. 251. : Asia Pacific Parenteral Nutrition Market Revenue, By Age Group, 2023– 2030 (USD
Million) 282
TABLE NO. 252. : Asia Pacific Parenteral Nutrition Market Revenue, By End-user, 2017 – 2022 (USD Million) 283 TABLE NO. 253. : Asia Pacific Parenteral Nutrition Market Revenue, By End-user, 2023– 2030 (USD Million).283 TABLE NO. 254. : Asia Pacific Parenteral Nutrition Market Revenue, By Application, 2017 – 2022 (USD
Million) 284
TABLE NO. 255. : Asia Pacific Parenteral Nutrition Market Revenue, By Application, 2023– 2030 (USD
Million) 284
TABLE NO. 256. : Asia Pacific Parenteral Nutrition Market Revenue, By Type, 2017 – 2022 (USD Million) 285
TABLE NO. 257. : Asia Pacific Parenteral Nutrition Market Revenue, By Type, 2023– 2030 (USD Million) 285
TABLE NO 258. : Asia Pacific Parenteral Nutrition Market Revenue, By Distribution Channel, 2017 – 2022
(USD Million) 286
TABLE NO 259. : Asia Pacific Parenteral Nutrition Market Revenue, By Distribution Channel, 2023– 2030
(USD Million) 286
TABLE NO. 260. : China Parenteral Nutrition Market Revenue, By Age Group, 2017 – 2022 (USD Million) 287
TABLE NO. 261. : China Parenteral Nutrition Market Revenue, By Age Group, 2023– 2030 (USD Million) 287
TABLE NO. 262. : China Parenteral Nutrition Market Revenue, By End-user, 2017 – 2022 (USD Million) 288

TABLE NO. 263. : China Parenteral Nutrition Market Revenue, By End-user, 2023– 2030 (USD Million) 288
TABLE NO. 264. : China Parenteral Nutrition Market Revenue, By Application, 2017 – 2022 (USD Million) 289
TABLE NO. 265. : China Parenteral Nutrition Market Revenue, By Application, 2023– 2030 (USD Million) 289
TABLE NO. 266. : China Parenteral Nutrition Market Revenue, By Type, 2017 – 2022 (USD Million) 290
TABLE NO. 267. : China Parenteral Nutrition Market Revenue, By Type, 2023– 2030 (USD Million) 290
TABLE NO. 268. : China Parenteral Nutrition Market Revenue, By Distribution Channel, 2017 – 2022 (USD Million) 291
TABLE NO. 269. : China Parenteral Nutrition Market Revenue, By Distribution Channel, 2023– 2030 (USD Million) 291
TABLE NO. 270. : Japan Parenteral Nutrition Market Revenue, By Age Group, 2017 – 2022 (USD Million) 292
TABLE NO. 271. : Japan Parenteral Nutrition Market Revenue, By Age Group, 2023– 2030 (USD Million) 292
TABLE NO. 272. : Japan Parenteral Nutrition Market Revenue, By End-user, 2017 – 2022 (USD Million) 293
TABLE NO. 273. : Japan Parenteral Nutrition Market Revenue, By End-user, 2023– 2030 (USD Million) 293
TABLE NO. 274. : Japan Parenteral Nutrition Market Revenue, By Application, 2017 – 2022 (USD Million) 294
TABLE NO. 275. : Japan Parenteral Nutrition Market Revenue, By Application, 2023– 2030 (USD Million) 294
TABLE NO. 276. : Japan Parenteral Nutrition Market Revenue, By Type, 2017 – 2022 (USD Million) 295
TABLE NO. 277. : Japan Parenteral Nutrition Market Revenue, By Type, 2023– 2030 (USD Million) 295
TABLE NO. 278. : Japan Parenteral Nutrition Market Revenue, By Distribution Channel, 2017 – 2022 (USD Million) 296
TABLE NO. 279. : Japan Parenteral Nutrition Market Revenue, By Distribution Channel, 2023– 2030 (USD Million) 296
TABLE NO. 280. : South Korea Parenteral Nutrition Market Revenue, By Age Group, 2017 – 2022 (USD
Million) 297
TABLE NO. 281. : South Korea Parenteral Nutrition Market Revenue, By Age Group, 2023– 2030 (USD
Million) 297
TABLE NO. 282. : South Korea Parenteral Nutrition Market Revenue, By End-user, 2017 – 2022 (USD
Million) 298
TABLE NO. 283. : South Korea Parenteral Nutrition Market Revenue, By End-user, 2023– 2030 (USD
Million) 298
TABLE NO. 284. : South Korea Parenteral Nutrition Market Revenue, By Application, 2017 – 2022 (USD
Million) 299
TABLE NO. 285. : South Korea Parenteral Nutrition Market Revenue, By Application, 2023– 2030 (USD
Million) 299
TABLE NO. 286. : South Korea Parenteral Nutrition Market Revenue, By Type, 2017 – 2022 (USD Million) 300
TABLE NO. 287. : South Korea Parenteral Nutrition Market Revenue, By Type, 2023– 2030 (USD Million) 300
TABLE NO 288. : South Korea Parenteral Nutrition Market Revenue, By Distribution Channel, 2017 – 2022
(USD Million) 301
TABLE NO 289. : South Korea Parenteral Nutrition Market Revenue, By Distribution Channel, 2023– 2030
(USD Million) 301
TABLE NO. 290. : India Parenteral Nutrition Market Revenue, By Age Group, 2017 – 2022 (USD Million) 302
TABLE NO. 291. : India Parenteral Nutrition Market Revenue, By Age Group, 2023– 2030 (USD Million) 302
TABLE NO. 292. : India Parenteral Nutrition Market Revenue, By End-user, 2017 – 2022 (USD Million) 303
TABLE NO. 293. : India Parenteral Nutrition Market Revenue, By End-user, 2023– 2030 (USD Million) 303
TABLE NO. 294. : India Parenteral Nutrition Market Revenue, By Application, 2017 – 2022 (USD Million) 304
TABLE NO. 295. : India Parenteral Nutrition Market Revenue, By Application, 2023– 2030 (USD Million) 304

TABLE NO. 296. : India Parenteral Nutrition Market Revenue, By Type, 2017 – 2022 (USD Million) 305
TABLE NO. 297. : India Parenteral Nutrition Market Revenue, By Type, 2023– 2030 (USD Million) 305
TABLE NO. 298. : India Parenteral Nutrition Market Revenue, By Distribution Channel, 2017 – 2022 (USD Million) 306
TABLE NO. 299. : India Parenteral Nutrition Market Revenue, By Distribution Channel, 2023– 2030 (USD Million) 306
TABLE NO. 300. : Australia Parenteral Nutrition Market Revenue, By Age Group, 2017 – 2022 (USD Million) .307 TABLE NO. 301. : Australia Parenteral Nutrition Market Revenue, By Age Group, 2023– 2030 (USD Million) .307 TABLE NO. 302. : Australia Parenteral Nutrition Market Revenue, By End-user, 2017 – 2022 (USD Million) 308
TABLE NO. 303. : Australia Parenteral Nutrition Market Revenue, By End-user, 2023– 2030 (USD Million) 308
TABLE NO. 304. : Australia Parenteral Nutrition Market Revenue, By Application, 2017 – 2022 (USD Million) 309 TABLE NO 305. : Australia Parenteral Nutrition Market Revenue, By Application, 2023– 2030 (USD Million) 309
TABLE NO. 306. : Australia Parenteral Nutrition Market Revenue, By Type, 2017 – 2022 (USD Million) 310
TABLE NO. 307. : Australia Parenteral Nutrition Market Revenue, By Type, 2023– 2030 (USD Million) 310
TABLE NO 308. : Australia Parenteral Nutrition Market Revenue, By Distribution Channel, 2017 – 2022
(USD Million) 311
TABLE NO 309. : Australia Parenteral Nutrition Market Revenue, By Distribution Channel, 2023– 2030
(USD Million) 311
TABLE NO. 310. : Thailand Parenteral Nutrition Market Revenue, By Age Group, 2017 – 2022 (USD Million) .312 TABLE NO. 311. : Thailand Parenteral Nutrition Market Revenue, By Age Group, 2023– 2030 (USD Million) 312
TABLE NO. 312. : Thailand Parenteral Nutrition Market Revenue, By End-user, 2017 – 2022 (USD Million) 313
TABLE NO. 313. : Thailand Parenteral Nutrition Market Revenue, By End-user, 2023– 2030 (USD Million) 313
TABLE NO. 314. : Thailand Parenteral Nutrition Market Revenue, By Application, 2017 – 2022 (USD Million) 314 TABLE NO. 315. : Thailand Parenteral Nutrition Market Revenue, By Application, 2023– 2030 (USD Million).314 TABLE NO. 316. : Thailand Parenteral Nutrition Market Revenue, By Type, 2017 – 2022 (USD Million) 315
TABLE NO. 317. : Thailand Parenteral Nutrition Market Revenue, By Type, 2023– 2030 (USD Million) 315
TABLE NO. 318. : Thailand Parenteral Nutrition Market Revenue, By Distribution Channel, 2017 – 2022 (USD Million) 316
TABLE NO. 319. : Thailand Parenteral Nutrition Market Revenue, By Distribution Channel, 2023– 2030 (USD Million) 316
TABLE NO. 320. : Indonesia Parenteral Nutrition Market Revenue, By Age Group, 2017 – 2022 (USD Million)317 TABLE NO 321. : Indonesia Parenteral Nutrition Market Revenue, By Age Group, 2023– 2030 (USD Million)317
TABLE NO. 322. : Indonesia Parenteral Nutrition Market Revenue, By End-user, 2017 – 2022 (USD Million) 318
TABLE NO. 323. : Indonesia Parenteral Nutrition Market Revenue, By End-user, 2023– 2030 (USD Million) 318
TABLE NO. 324. : Indonesia Parenteral Nutrition Market Revenue, By Application, 2017 – 2022 (USD
Million) 319
TABLE NO. 325. : Indonesia Parenteral Nutrition Market Revenue, By Application, 2023– 2030 (USD
Million) 319
TABLE NO. 326. : Indonesia Parenteral Nutrition Market Revenue, By Type, 2017 – 2022 (USD Million) 320
TABLE NO. 327. : Indonesia Parenteral Nutrition Market Revenue, By Type, 2023– 2030 (USD Million) 320
TABLE NO 328. : Indonesia Parenteral Nutrition Market Revenue, By Distribution Channel, 2017 – 2022
(USD Million) 321
TABLE NO 329. : Indonesia Parenteral Nutrition Market Revenue, By Distribution Channel, 2023– 2030
(USD Million) 321
TABLE NO. 330. : Vietnam Parenteral Nutrition Market Revenue, By Age Group, 2017 – 2022 (USD Million) 322

TABLE NO. 331. : Vietnam Parenteral Nutrition Market Revenue, By Age Group, 2023– 2030 (USD Million)..322 TABLE NO. 332. : Vietnam Parenteral Nutrition Market Revenue, By End-user, 2017 – 2022 (USD Million) 323
TABLE NO. 333. : Vietnam Parenteral Nutrition Market Revenue, By End-user, 2023– 2030 (USD Million) 323
TABLE NO. 334. : Vietnam Parenteral Nutrition Market Revenue, By Application, 2017 – 2022 (USD Million).324 TABLE NO. 335. : Vietnam Parenteral Nutrition Market Revenue, By Application, 2023– 2030 (USD Million).324 TABLE NO. 336. : Vietnam Parenteral Nutrition Market Revenue, By Type, 2017 – 2022 (USD Million) 325
TABLE NO. 337. : Vietnam Parenteral Nutrition Market Revenue, By Type, 2023– 2030 (USD Million) 325
TABLE NO. 338. : Vietnam Parenteral Nutrition Market Revenue, By Distribution Channel, 2017 – 2022 (USD Million) 326
TABLE NO. 339. : Vietnam Parenteral Nutrition Market Revenue, By Distribution Channel, 2023– 2030 (USD Million) 326
TABLE NO. 340. : Malaysia Parenteral Nutrition Market Revenue, By Age Group, 2017 – 2022 (USD Million) .327 TABLE NO. 341. : Malaysia Parenteral Nutrition Market Revenue, By Age Group, 2023– 2030 (USD Million) .327 TABLE NO. 342. : Malaysia Parenteral Nutrition Market Revenue, By End-user, 2017 – 2022 (USD Million) 328
TABLE NO. 343. : Malaysia Parenteral Nutrition Market Revenue, By End-user, 2023– 2030 (USD Million) 328
TABLE NO. 344. : Malaysia Parenteral Nutrition Market Revenue, By Application, 2017 – 2022 (USD Million) 329 TABLE NO 345. : Malaysia Parenteral Nutrition Market Revenue, By Application, 2023– 2030 (USD Million) 329
TABLE NO. 346. : Malaysia Parenteral Nutrition Market Revenue, By Type, 2017 – 2022 (USD Million) 330
TABLE NO. 347. : Malaysia Parenteral Nutrition Market Revenue, By Type, 2023– 2030 (USD Million) 330
TABLE NO 348. : Malaysia Parenteral Nutrition Market Revenue, By Distribution Channel, 2017 – 2022
(USD Million) 331
TABLE NO 349. : Malaysia Parenteral Nutrition Market Revenue, By Distribution Channel, 2023– 2030
(USD Million) 331
TABLE NO. 350. : Philippines Parenteral Nutrition Market Revenue, By Age Group, 2017 – 2022 (USD
Million) 332
TABLE NO. 351. : Philippines Parenteral Nutrition Market Revenue, By Age Group, 2023– 2030 (USD
Million) 332
TABLE NO. 352. : Philippines Parenteral Nutrition Market Revenue, By End-user, 2017 – 2022 (USD Million).333 TABLE NO. 353. : Philippines Parenteral Nutrition Market Revenue, By End-user, 2023– 2030 (USD Million).333 TABLE NO. 354. : Philippines Parenteral Nutrition Market Revenue, By Application, 2017 – 2022 (USD
Million) 334
TABLE NO. 355. : Philippines Parenteral Nutrition Market Revenue, By Application, 2023– 2030 (USD
Million) 334
TABLE NO. 356. : Philippines Parenteral Nutrition Market Revenue, By Type, 2017 – 2022 (USD Million) 335
TABLE NO. 357. : Philippines Parenteral Nutrition Market Revenue, By Type, 2023– 2030 (USD Million) 335
TABLE NO 358. : Philippines Parenteral Nutrition Market Revenue, By Distribution Channel, 2017 – 2022
(USD Million) 336
TABLE NO 359. : Philippines Parenteral Nutrition Market Revenue, By Distribution Channel, 2023– 2030
(USD Million) 336
TABLE NO. 360. : Indonesia Parenteral Nutrition Market Revenue, By Age Group, 2017 – 2022 (USD Million)337 TABLE NO 361. : Indonesia Parenteral Nutrition Market Revenue, By Age Group, 2023– 2030 (USD Million)337
TABLE NO. 362. : Indonesia Parenteral Nutrition Market Revenue, By End-user, 2017 – 2022 (USD Million) 338
TABLE NO. 363. : Indonesia Parenteral Nutrition Market Revenue, By End-user, 2023– 2030 (USD Million) 338
TABLE NO. 364. : Indonesia Parenteral Nutrition Market Revenue, By Application, 2017 – 2022 (USD
Million) 339

TABLE NO. 365. : Indonesia Parenteral Nutrition Market Revenue, By Application, 2023– 2030 (USD
Million) 339
TABLE NO. 366. : Indonesia Parenteral Nutrition Market Revenue, By Type, 2017 – 2022 (USD Million) 340
TABLE NO. 367. : Indonesia Parenteral Nutrition Market Revenue, By Type, 2023– 2030 (USD Million) 340
TABLE NO 368. : Indonesia Parenteral Nutrition Market Revenue, By Distribution Channel, 2017 – 2022
(USD Million) 341
TABLE NO 369. : Indonesia Parenteral Nutrition Market Revenue, By Distribution Channel, 2023– 2030
(USD Million) 341
TABLE NO 370. : Rest of Asia Pacific Parenteral Nutrition Market Revenue, By Age Group, 2017 – 2022
(USD Million) 342
TABLE NO 371. : Rest of Asia Pacific Parenteral Nutrition Market Revenue, By Age Group, 2023– 2030
(USD Million) 342
TABLE NO. 372. : Rest of Asia Pacific Parenteral Nutrition Market Revenue, By End-user, 2017 – 2022 (USD Million) 343
TABLE NO. 373. : Rest of Asia Pacific Parenteral Nutrition Market Revenue, By End-user, 2023– 2030 (USD Million) 343
TABLE NO 374. : Rest of Asia Pacific Parenteral Nutrition Market Revenue, By Application, 2017 – 2022
(USD Million) 344
TABLE NO 375. : Rest of Asia Pacific Parenteral Nutrition Market Revenue, By Application, 2023– 2030
(USD Million) 344
TABLE NO. 376. : Rest of Asia Pacific Parenteral Nutrition Market Revenue, By Type, 2017 – 2022 (USD
Million) 345
TABLE NO. 377. : Rest of Asia Pacific Parenteral Nutrition Market Revenue, By Type, 2023– 2030 (USD
Million) 345
TABLE NO 378. : Rest of Asia Pacific Parenteral Nutrition Market Revenue, By Distribution Channel, 2017 –
2022 (USD Million) 346
TABLE NO 379. : Rest of Asia Pacific Parenteral Nutrition Market Revenue, By Distribution Channel, 2023–
2030 (USD Million) 346
TABLE NO. 380. : Latin America Parenteral Nutrition Market Revenue, By Country, 2017 – 2022 (USD
Million) 349
TABLE NO. 381. : Latin America Parenteral Nutrition Market Revenue, By Country, 2023– 2030 (USD
Million) 349
TABLE NO. 382. : Latin America Parenteral Nutrition Market Revenue, By Age Group, 2017 – 2022 (USD Million) 350
TABLE NO. 383. : Latin America Parenteral Nutrition Market Revenue, By Age Group, 2023– 2030 (USD Million) 350
TABLE NO. 384. : Latin America Parenteral Nutrition Market Revenue, By End-user, 2017 – 2022 (USD
Million) 351
TABLE NO. 385. : Latin America Parenteral Nutrition Market Revenue, By End-user, 2023– 2030 (USD
Million) 351
TABLE NO. 386. : Latin America Parenteral Nutrition Market Revenue, By Application, 2017 – 2022 (USD Million) 352
TABLE NO. 387. : Latin America Parenteral Nutrition Market Revenue, By Application, 2023– 2030 (USD Million) 352
TABLE NO. 388. : Latin America Parenteral Nutrition Market Revenue, By Type, 2017 – 2022 (USD Million) 353

TABLE NO. 389. : Latin America Parenteral Nutrition Market Revenue, By Type, 2023– 2030 (USD Million)…353 TABLE NO. 390. : Latin America Parenteral Nutrition Market Revenue, By Distribution Channel, 2017 – 2022
(USD Million) 354
TABLE NO 391. : Latin America Parenteral Nutrition Market Revenue, By Distribution Channel, 2023– 2030
(USD Million) 354
TABLE NO. 392. : Brazil Parenteral Nutrition Market Revenue, By Age Group, 2017 – 2022 (USD Million) 355
TABLE NO. 393. : Brazil Parenteral Nutrition Market Revenue, By Age Group, 2023– 2030 (USD Million) 355
TABLE NO. 394. : Brazil Parenteral Nutrition Market Revenue, By End-user, 2017 – 2022 (USD Million) 356
TABLE NO. 395. : Brazil Parenteral Nutrition Market Revenue, By End-user, 2023– 2030 (USD Million) 356
TABLE NO. 396. : Brazil Parenteral Nutrition Market Revenue, By Application, 2017 – 2022 (USD Million) 357
TABLE NO. 397. : Brazil Parenteral Nutrition Market Revenue, By Application, 2023– 2030 (USD Million) 357
TABLE NO. 398. : Brazil Parenteral Nutrition Market Revenue, By Type, 2017 – 2022 (USD Million) 358
TABLE NO. 399. : Brazil Parenteral Nutrition Market Revenue, By Type, 2023– 2030 (USD Million) 358
TABLE NO. 400. : Brazil Parenteral Nutrition Market Revenue, By Distribution Channel, 2017 – 2022 (USD Million) 359
TABLE NO. 401. : Brazil Parenteral Nutrition Market Revenue, By Distribution Channel, 2023– 2030 (USD Million) 359
TABLE NO. 402. : Argentina Parenteral Nutrition Market Revenue, By Age Group, 2017 – 2022 (USD Million)360 TABLE NO 403. : Argentina Parenteral Nutrition Market Revenue, By Age Group, 2023– 2030 (USD Million)360
TABLE NO. 404. : Argentina Parenteral Nutrition Market Revenue, By End-user, 2017 – 2022 (USD Million) 361
TABLE NO. 405. : Argentina Parenteral Nutrition Market Revenue, By End-user, 2023– 2030 (USD Million) 361
TABLE NO. 406. : Argentina Parenteral Nutrition Market Revenue, By Application, 2017 – 2022 (USD
Million) 362
TABLE NO. 407. : Argentina Parenteral Nutrition Market Revenue, By Application, 2023– 2030 (USD
Million) 362
TABLE NO. 408. : Argentina Parenteral Nutrition Market Revenue, By Type, 2017 – 2022 (USD Million) 363
TABLE NO. 409. : Argentina Parenteral Nutrition Market Revenue, By Type, 2023– 2030 (USD Million) 363
TABLE NO 410. : Argentina Parenteral Nutrition Market Revenue, By Distribution Channel, 2017 – 2022
(USD Million) 364
TABLE NO 411. : Argentina Parenteral Nutrition Market Revenue, By Distribution Channel, 2023– 2030
(USD Million) 364
TABLE NO. 412. : Peru Parenteral Nutrition Market Revenue, By Age Group, 2017 – 2022 (USD Million) 365
TABLE NO. 413. : Peru Parenteral Nutrition Market Revenue, By Age Group, 2023– 2030 (USD Million) 365
TABLE NO. 414. : Peru Parenteral Nutrition Market Revenue, By End-user, 2017 – 2022 (USD Million) 366
TABLE NO. 415. : Peru Parenteral Nutrition Market Revenue, By End-user, 2023– 2030 (USD Million) 366
TABLE NO. 416. : Peru Parenteral Nutrition Market Revenue, By Application, 2017 – 2022 (USD Million) 367
TABLE NO. 417. : Peru Parenteral Nutrition Market Revenue, By Application, 2023– 2030 (USD Million) 367
TABLE NO. 418. : Peru Parenteral Nutrition Market Revenue, By Type, 2017 – 2022 (USD Million) 368
TABLE NO. 419. : Peru Parenteral Nutrition Market Revenue, By Type, 2023– 2030 (USD Million) 368
TABLE NO. 420. : Peru Parenteral Nutrition Market Revenue, By Distribution Channel, 2017 – 2022 (USD Million) 369
TABLE NO. 421. : Peru Parenteral Nutrition Market Revenue, By Distribution Channel, 2023– 2030 (USD Million) 369
TABLE NO. 422. : Chile Parenteral Nutrition Market Revenue, By Age Group, 2017 – 2022 (USD Million) 370
TABLE NO. 423. : Chile Parenteral Nutrition Market Revenue, By Age Group, 2023– 2030 (USD Million) 370

TABLE NO. 424. : Chile Parenteral Nutrition Market Revenue, By End-user, 2017 – 2022 (USD Million) 371
TABLE NO. 425. : Chile Parenteral Nutrition Market Revenue, By End-user, 2023– 2030 (USD Million) 371
TABLE NO. 426. : Chile Parenteral Nutrition Market Revenue, By Application, 2017 – 2022 (USD Million) 372
TABLE NO. 427. : Chile Parenteral Nutrition Market Revenue, By Application, 2023– 2030 (USD Million) 372
TABLE NO. 428. : Chile Parenteral Nutrition Market Revenue, By Type, 2017 – 2022 (USD Million) 373
TABLE NO. 429. : Chile Parenteral Nutrition Market Revenue, By Type, 2023– 2030 (USD Million) 373
TABLE NO. 430. : Chile Parenteral Nutrition Market Revenue, By Distribution Channel, 2017 – 2022 (USD Million) 374
TABLE NO. 431. : Chile Parenteral Nutrition Market Revenue, By Distribution Channel, 2023– 2030 (USD Million) 374
TABLE NO. 432. : Colombia Parenteral Nutrition Market Revenue, By Age Group, 2017 – 2022 (USD Million) 375 TABLE NO 433. : Colombia Parenteral Nutrition Market Revenue, By Age Group, 2023– 2030 (USD Million) 375
TABLE NO. 434. : Colombia Parenteral Nutrition Market Revenue, By End-user, 2017 – 2022 (USD Million) 376
TABLE NO. 435. : Colombia Parenteral Nutrition Market Revenue, By End-user, 2023– 2030 (USD Million) 376
TABLE NO. 436. : Colombia Parenteral Nutrition Market Revenue, By Application, 2017 – 2022 (USD Million)377 TABLE NO 437. : Colombia Parenteral Nutrition Market Revenue, By Application, 2023– 2030 (USD Million)377
TABLE NO. 438. : Colombia Parenteral Nutrition Market Revenue, By Type, 2017 – 2022 (USD Million) 378
TABLE NO. 439. : Colombia Parenteral Nutrition Market Revenue, By Type, 2023– 2030 (USD Million) 378
TABLE NO 440. : Colombia Parenteral Nutrition Market Revenue, By Distribution Channel, 2017 – 2022
(USD Million) 379
TABLE NO 441. : Colombia Parenteral Nutrition Market Revenue, By Distribution Channel, 2023– 2030
(USD Million) 379
TABLE NO 442. : Rest of Latin America Parenteral Nutrition Market Revenue, By Age Group, 2017 – 2022
(USD Million) 380
TABLE NO 443. : Rest of Latin America Parenteral Nutrition Market Revenue, By Age Group, 2023– 2030
(USD Million) 380
TABLE NO. 444. : Rest of Latin America Parenteral Nutrition Market Revenue, By End-user, 2017 – 2022
(USD Million) 381
TABLE NO. 445. : Rest of Latin America Parenteral Nutrition Market Revenue, By End-user, 2023– 2030
(USD Million) 381
TABLE NO 446. : Rest of Latin America Parenteral Nutrition Market Revenue, By Application, 2017 – 2022
(USD Million) 382
TABLE NO 447. : Rest of Latin America Parenteral Nutrition Market Revenue, By Application, 2023– 2030
(USD Million) 382
TABLE NO. 448. : Rest of Latin America Parenteral Nutrition Market Revenue, By Type, 2017 – 2022 (USD Million) 383
TABLE NO. 449. : Rest of Latin America Parenteral Nutrition Market Revenue, By Type, 2023– 2030 (USD Million) 383
TABLE NO. 450. : Rest of Latin America Parenteral Nutrition Market Revenue, By Distribution Channel,
2017 – 2022 (USD Million) 384
TABLE NO. 451. : Rest of Latin America Parenteral Nutrition Market Revenue, By Distribution Channel,
2023– 2030 (USD Million) 384
TABLE NO. 452. : Middle East Parenteral Nutrition Market Revenue, By Country, 2017 – 2022 (USD Million).387 TABLE NO. 453. : Middle East Parenteral Nutrition Market Revenue, By Country, 2023– 2030 (USD Million).387

TABLE NO. 454. : Middle East Parenteral Nutrition Market Revenue, By Age Group, 2017 – 2022 (USD
Million) 388
TABLE NO. 455. : Middle East Parenteral Nutrition Market Revenue, By Age Group, 2023– 2030 (USD
Million) 388
TABLE NO. 456. : Middle East Parenteral Nutrition Market Revenue, By End-user, 2017 – 2022 (USD Million)389 TABLE NO. 457. : Middle East Parenteral Nutrition Market Revenue, By End-user, 2023– 2030 (USD Million)389 TABLE NO. 458. : Middle East Parenteral Nutrition Market Revenue, By Application, 2017 – 2022 (USD
Million) 390
TABLE NO. 459. : Middle East Parenteral Nutrition Market Revenue, By Application, 2023– 2030 (USD
Million) 390
TABLE NO. 460. : Middle East Parenteral Nutrition Market Revenue, By Type, 2017 – 2022 (USD Million) 391
TABLE NO. 461. : Middle East Parenteral Nutrition Market Revenue, By Type, 2023– 2030 (USD Million) 391
TABLE NO 462. : Middle East Parenteral Nutrition Market Revenue, By Distribution Channel, 2017 – 2022
(USD Million) 392
TABLE NO 463. : Middle East Parenteral Nutrition Market Revenue, By Distribution Channel, 2023– 2030
(USD Million) 392
TABLE NO. 464. : UAE Parenteral Nutrition Market Revenue, By Age Group, 2017 – 2022 (USD Million) 393
TABLE NO. 465. : UAE Parenteral Nutrition Market Revenue, By Age Group, 2023– 2030 (USD Million) 393
TABLE NO. 466. : UAE Parenteral Nutrition Market Revenue, By End-user, 2017 – 2022 (USD Million) 394
TABLE NO. 467. : UAE Parenteral Nutrition Market Revenue, By End-user, 2023– 2030 (USD Million) 394
TABLE NO. 468. : UAE Parenteral Nutrition Market Revenue, By Application, 2017 – 2022 (USD Million) 395
TABLE NO. 469. : UAE Parenteral Nutrition Market Revenue, By Application, 2023– 2030 (USD Million) 395
TABLE NO. 470. : UAE Parenteral Nutrition Market Revenue, By Type, 2017 – 2022 (USD Million) 396
TABLE NO. 471. : UAE Parenteral Nutrition Market Revenue, By Type, 2023– 2030 (USD Million) 396
TABLE NO. 472. : UAE Parenteral Nutrition Market Revenue, By Distribution Channel, 2017 – 2022 (USD Million) 397
TABLE NO. 473. : UAE Parenteral Nutrition Market Revenue, By Distribution Channel, 2023– 2030 (USD Million) 397
TABLE NO. 474. : KSA Parenteral Nutrition Market Revenue, By Age Group, 2017 – 2022 (USD Million) 398
TABLE NO. 475. : KSA Parenteral Nutrition Market Revenue, By Age Group, 2023– 2030 (USD Million) 398
TABLE NO. 476. : KSA Parenteral Nutrition Market Revenue, By End-user, 2017 – 2022 (USD Million) 399
TABLE NO. 477. : KSA Parenteral Nutrition Market Revenue, By End-user, 2023– 2030 (USD Million) 399
TABLE NO. 478. : KSA Parenteral Nutrition Market Revenue, By Application, 2017 – 2022 (USD Million) 400
TABLE NO. 479. : KSA Parenteral Nutrition Market Revenue, By Application, 2023– 2030 (USD Million) 400
TABLE NO. 480. : KSA Parenteral Nutrition Market Revenue, By Type, 2017 – 2022 (USD Million) 401
TABLE NO. 481. : KSA Parenteral Nutrition Market Revenue, By Type, 2023– 2030 (USD Million) 401
TABLE NO. 482. : KSA Parenteral Nutrition Market Revenue, By Distribution Channel, 2017 – 2022 (USD Million) 402
TABLE NO. 483. : KSA Parenteral Nutrition Market Revenue, By Distribution Channel, 2023– 2030 (USD Million) 402
TABLE NO. 484. : Israel Parenteral Nutrition Market Revenue, By Age Group, 2017 – 2022 (USD Million) 403
TABLE NO. 485. : Israel Parenteral Nutrition Market Revenue, By Age Group, 2023– 2030 (USD Million) 403
TABLE NO. 486. : Israel Parenteral Nutrition Market Revenue, By End-user, 2017 – 2022 (USD Million) 404
TABLE NO. 487. : Israel Parenteral Nutrition Market Revenue, By End-user, 2023– 2030 (USD Million) 404
TABLE NO. 488. : Israel Parenteral Nutrition Market Revenue, By Application, 2017 – 2022 (USD Million) 405

TABLE NO. 489. : Israel Parenteral Nutrition Market Revenue, By Application, 2023– 2030 (USD Million) 405
TABLE NO. 490. : Israel Parenteral Nutrition Market Revenue, By Type, 2017 – 2022 (USD Million) 406
TABLE NO. 491. : Israel Parenteral Nutrition Market Revenue, By Type, 2023– 2030 (USD Million) 406
TABLE NO. 492. : Israel Parenteral Nutrition Market Revenue, By Distribution Channel, 2017 – 2022 (USD Million) 407
TABLE NO. 493. : Israel Parenteral Nutrition Market Revenue, By Distribution Channel, 2023– 2030 (USD Million) 407
TABLE NO. 494. : Turkey Parenteral Nutrition Market Revenue, By Age Group, 2017 – 2022 (USD Million) 408
TABLE NO. 495. : Turkey Parenteral Nutrition Market Revenue, By Age Group, 2023– 2030 (USD Million) 408
TABLE NO. 496. : Turkey Parenteral Nutrition Market Revenue, By End-user, 2017 – 2022 (USD Million) 409
TABLE NO. 497. : Turkey Parenteral Nutrition Market Revenue, By End-user, 2023– 2030 (USD Million) 409
TABLE NO. 498. : Turkey Parenteral Nutrition Market Revenue, By Application, 2017 – 2022 (USD Million) 410
TABLE NO. 499. : Turkey Parenteral Nutrition Market Revenue, By Application, 2023– 2030 (USD Million) 410
TABLE NO. 500. : Turkey Parenteral Nutrition Market Revenue, By Type, 2017 – 2022 (USD Million) 411
TABLE NO. 501. : Turkey Parenteral Nutrition Market Revenue, By Type, 2023– 2030 (USD Million) 411
TABLE NO. 502. : Turkey Parenteral Nutrition Market Revenue, By Distribution Channel, 2017 – 2022 (USD Million) 412
TABLE NO. 503. : Turkey Parenteral Nutrition Market Revenue, By Distribution Channel, 2023– 2030 (USD Million) 412
TABLE NO. 504. : Iran Parenteral Nutrition Market Revenue, By Age Group, 2017 – 2022 (USD Million) 413
TABLE NO. 505. : Iran Parenteral Nutrition Market Revenue, By Age Group, 2023– 2030 (USD Million) 413
TABLE NO. 506. : Iran Parenteral Nutrition Market Revenue, By End-user, 2017 – 2022 (USD Million) 414
TABLE NO. 507. : Iran Parenteral Nutrition Market Revenue, By End-user, 2023– 2030 (USD Million) 414
TABLE NO. 508. : Iran Parenteral Nutrition Market Revenue, By Application, 2017 – 2022 (USD Million) 415
TABLE NO. 509. : Iran Parenteral Nutrition Market Revenue, By Application, 2023– 2030 (USD Million) 415
TABLE NO. 510. : Iran Parenteral Nutrition Market Revenue, By Type, 2017 – 2022 (USD Million) 416
TABLE NO. 511. : Iran Parenteral Nutrition Market Revenue, By Type, 2023– 2030 (USD Million) 416
TABLE NO. 512. : Iran Parenteral Nutrition Market Revenue, By Distribution Channel, 2017 – 2022 (USD Million) 417
TABLE NO. 513. : Iran Parenteral Nutrition Market Revenue, By Distribution Channel, 2023– 2030 (USD Million) 417
TABLE NO 514. : Rest of Middle East Parenteral Nutrition Market Revenue, By Age Group, 2017 – 2022
(USD Million) 418
TABLE NO 515. : Rest of Middle East Parenteral Nutrition Market Revenue, By Age Group, 2023– 2030
(USD Million) 418
TABLE NO. 516. : Rest of Middle East Parenteral Nutrition Market Revenue, By End-user, 2017 – 2022 (USD Million) 419
TABLE NO. 517. : Rest of Middle East Parenteral Nutrition Market Revenue, By End-user, 2023– 2030 (USD Million) 419
TABLE NO 518. : Rest of Middle East Parenteral Nutrition Market Revenue, By Application, 2017 – 2022
(USD Million) 420
TABLE NO 519. : Rest of Middle East Parenteral Nutrition Market Revenue, By Application, 2023– 2030
(USD Million) 420
TABLE NO. 520. : Rest of Middle East Parenteral Nutrition Market Revenue, By Type, 2017 – 2022 (USD
Million) 421

TABLE NO. 521. : Rest of Middle East Parenteral Nutrition Market Revenue, By Type, 2023– 2030 (USD
Million) 421
TABLE NO 522. : Rest of Middle East Parenteral Nutrition Market Revenue, By Distribution Channel, 2017 –
2022 (USD Million) 422
TABLE NO 523. : Rest of Middle East Parenteral Nutrition Market Revenue, By Distribution Channel, 2023–
2030 (USD Million) 422
TABLE NO. 524. : Africa Parenteral Nutrition Market Revenue, By Country, 2017 – 2022 (USD Million) 425
TABLE NO. 525. : Africa Parenteral Nutrition Market Revenue, By Country, 2023– 2030 (USD Million) 425
TABLE NO. 526. : Africa Parenteral Nutrition Market Revenue, By Age Group, 2017 – 2022 (USD Million) 426
TABLE NO. 527. : Africa Parenteral Nutrition Market Revenue, By Age Group, 2023– 2030 (USD Million) 426
TABLE NO. 528. : Africa Parenteral Nutrition Market Revenue, By End-user, 2017 – 2022 (USD Million) 427
TABLE NO. 529. : Africa Parenteral Nutrition Market Revenue, By End-user, 2023– 2030 (USD Million) 427
TABLE NO. 530. : Africa Parenteral Nutrition Market Revenue, By Application, 2017 – 2022 (USD Million) 428
TABLE NO. 531. : Africa Parenteral Nutrition Market Revenue, By Application, 2023– 2030 (USD Million) 428
TABLE NO. 532. : Africa Parenteral Nutrition Market Revenue, By Type, 2017 – 2022 (USD Million) 429
TABLE NO. 533. : Africa Parenteral Nutrition Market Revenue, By Type, 2023– 2030 (USD Million) 429
TABLE NO. 534. : Africa Parenteral Nutrition Market Revenue, By Distribution Channel, 2017 – 2022 (USD Million) 430
TABLE NO. 535. : Africa Parenteral Nutrition Market Revenue, By Distribution Channel, 2023– 2030 (USD Million) 430
TABLE NO. 536. : South Africa Parenteral Nutrition Market Revenue, By Age Group, 2017 – 2022 (USD
Million) 431
TABLE NO. 537. : South Africa Parenteral Nutrition Market Revenue, By Age Group, 2023– 2030 (USD
Million) 431
TABLE NO. 538. : South Africa Parenteral Nutrition Market Revenue, By End-user, 2017 – 2022 (USD
Million) 432
TABLE NO. 539. : South Africa Parenteral Nutrition Market Revenue, By End-user, 2023– 2030 (USD
Million) 432
TABLE NO. 540. : South Africa Parenteral Nutrition Market Revenue, By Application, 2017 – 2022 (USD
Million) 433
TABLE NO. 541. : South Africa Parenteral Nutrition Market Revenue, By Application, 2023– 2030 (USD
Million) 433
TABLE NO. 542. : South Africa Parenteral Nutrition Market Revenue, By Type, 2017 – 2022 (USD Million) 434
TABLE NO. 543. : South Africa Parenteral Nutrition Market Revenue, By Type, 2023– 2030 (USD Million) 434
TABLE NO 544. : South Africa Parenteral Nutrition Market Revenue, By Distribution Channel, 2017 – 2022
(USD Million) 435
TABLE NO 545. : South Africa Parenteral Nutrition Market Revenue, By Distribution Channel, 2023– 2030
(USD Million) 435
TABLE NO. 546. : Egypt Parenteral Nutrition Market Revenue, By Age Group, 2017 – 2022 (USD Million) 436
TABLE NO. 547. : Egypt Parenteral Nutrition Market Revenue, By Age Group, 2023– 2030 (USD Million) 436
TABLE NO. 548. : Egypt Parenteral Nutrition Market Revenue, By End-user, 2017 – 2022 (USD Million) 437
TABLE NO. 549. : Egypt Parenteral Nutrition Market Revenue, By End-user, 2023– 2030 (USD Million) 437
TABLE NO. 550. : Egypt Parenteral Nutrition Market Revenue, By Application, 2017 – 2022 (USD Million) 438
TABLE NO. 551. : Egypt Parenteral Nutrition Market Revenue, By Application, 2023– 2030 (USD Million) 438
TABLE NO. 552. : Egypt Parenteral Nutrition Market Revenue, By Type, 2017 – 2022 (USD Million) 439

TABLE NO. 553. : Egypt Parenteral Nutrition Market Revenue, By Type, 2023– 2030 (USD Million) 439
TABLE NO. 554. : Egypt Parenteral Nutrition Market Revenue, By Distribution Channel, 2017 – 2022 (USD Million) 440
TABLE NO. 555. : Egypt Parenteral Nutrition Market Revenue, By Distribution Channel, 2023– 2030 (USD Million) 440
TABLE NO. 556. : Nigeria Parenteral Nutrition Market Revenue, By Age Group, 2017 – 2022 (USD Million) 441
TABLE NO. 557. : Nigeria Parenteral Nutrition Market Revenue, By Age Group, 2023– 2030 (USD Million) 441
TABLE NO. 558. : Nigeria Parenteral Nutrition Market Revenue, By End-user, 2017 – 2022 (USD Million) 442
TABLE NO. 559. : Nigeria Parenteral Nutrition Market Revenue, By End-user, 2023– 2030 (USD Million) 442
TABLE NO. 560. : Nigeria Parenteral Nutrition Market Revenue, By Application, 2017 – 2022 (USD Million) 443
TABLE NO. 561. : Nigeria Parenteral Nutrition Market Revenue, By Application, 2023– 2030 (USD Million) 443
TABLE NO. 562. : Nigeria Parenteral Nutrition Market Revenue, By Type, 2017 – 2022 (USD Million) 444
TABLE NO. 563. : Nigeria Parenteral Nutrition Market Revenue, By Type, 2023– 2030 (USD Million) 444
TABLE NO. 564. : Nigeria Parenteral Nutrition Market Revenue, By Distribution Channel, 2017 – 2022 (USD Million) 445
TABLE NO. 565. : Nigeria Parenteral Nutrition Market Revenue, By Distribution Channel, 2023– 2030 (USD Million) 445
TABLE NO. 566. : Algeria Parenteral Nutrition Market Revenue, By Age Group, 2017 – 2022 (USD Million) 446
TABLE NO. 567. : Algeria Parenteral Nutrition Market Revenue, By Age Group, 2023– 2030 (USD Million) 446
TABLE NO. 568. : Algeria Parenteral Nutrition Market Revenue, By End-user, 2017 – 2022 (USD Million) 447
TABLE NO. 569. : Algeria Parenteral Nutrition Market Revenue, By End-user, 2023– 2030 (USD Million) 447
TABLE NO. 570. : Algeria Parenteral Nutrition Market Revenue, By Application, 2017 – 2022 (USD Million) 448
TABLE NO. 571. : Algeria Parenteral Nutrition Market Revenue, By Application, 2023– 2030 (USD Million) 448
TABLE NO. 572. : Algeria Parenteral Nutrition Market Revenue, By Type, 2017 – 2022 (USD Million) 449
TABLE NO. 573. : Algeria Parenteral Nutrition Market Revenue, By Type, 2023– 2030 (USD Million) 449
TABLE NO. 574. : Algeria Parenteral Nutrition Market Revenue, By Distribution Channel, 2017 – 2022 (USD Million) 450
TABLE NO. 575. : Algeria Parenteral Nutrition Market Revenue, By Distribution Channel, 2023– 2030 (USD Million) 450
TABLE NO. 576. : Morocco Parenteral Nutrition Market Revenue, By Age Group, 2017 – 2022 (USD Million).451 TABLE NO. 577. : Morocco Parenteral Nutrition Market Revenue, By Age Group, 2023– 2030 (USD Million) .451 TABLE NO. 578. : Morocco Parenteral Nutrition Market Revenue, By End-user, 2017 – 2022 (USD Million) 452
TABLE NO. 579. : Morocco Parenteral Nutrition Market Revenue, By End-user, 2023– 2030 (USD Million) 452
TABLE NO. 580. : Morocco Parenteral Nutrition Market Revenue, By Application, 2017 – 2022 (USD Million)453 TABLE NO 581. : Morocco Parenteral Nutrition Market Revenue, By Application, 2023– 2030 (USD Million) 453
TABLE NO. 582. : Morocco Parenteral Nutrition Market Revenue, By Type, 2017 – 2022 (USD Million) 454
TABLE NO. 583. : Morocco Parenteral Nutrition Market Revenue, By Type, 2023– 2030 (USD Million) 454
TABLE NO 584. : Morocco Parenteral Nutrition Market Revenue, By Distribution Channel, 2017 – 2022
(USD Million) 455
TABLE NO 585. : Morocco Parenteral Nutrition Market Revenue, By Distribution Channel, 2023– 2030
(USD Million) 455
TABLE NO. 586. : Rest of Africa Parenteral Nutrition Market Revenue, By Age Group, 2017 – 2022 (USD
Million) 456
TABLE NO. 587. : Rest of Africa Parenteral Nutrition Market Revenue, By Age Group, 2023– 2030 (USD
Million) 456

TABLE NO. 588. : Rest of Africa Parenteral Nutrition Market Revenue, By End-user, 2017 – 2022 (USD
Million) 457
TABLE NO. 589. : Rest of Africa Parenteral Nutrition Market Revenue, By End-user, 2023– 2030 (USD
Million) 457
TABLE NO. 590. : Rest of Africa Parenteral Nutrition Market Revenue, By Application, 2017 – 2022 (USD Million) 458
TABLE NO. 591. : Rest of Africa Parenteral Nutrition Market Revenue, By Application, 2023– 2030 (USD Million) 458
TABLE NO. 592. : Rest of Africa Parenteral Nutrition Market Revenue, By Type, 2017 – 2022 (USD Million) 459
TABLE NO. 593. : Rest of Africa Parenteral Nutrition Market Revenue, By Type, 2023– 2030 (USD Million) 459
TABLE NO 594. : Rest of Africa Parenteral Nutrition Market Revenue, By Distribution Channel, 2017 – 2022
(USD Million) 460
TABLE NO 595. : Rest of Africa Parenteral Nutrition Market Revenue, By Distribution Channel, 2023– 2030
(USD Million) 460


Frequently Asked Questions

What is the current size of the global Parenteral Nutrition Market?

The global Parenteral Nutrition Market was valued at USD 6.8 Billion in 2022.

What is the expected growth rate of the Parenteral Nutrition Market between 2023 and 2030?

The Parenteral Nutrition Market is expected to grow at a CAGR of 6.50% between 2023 and 2030, reaching USD 10.5 Billion in 2030.

Which segment is leading the market share in terms of Nutrient Type?

The single-dose amino acid solution segment held the greatest market share of more than 30.5% in 2022.

Which consumer type segment governs the demand for Parenteral Nutritions in the world?

The adult segment contributes the rest to the demand for Parenteral Nutritions.

Which segment is expected to post the highest CAGR during the forecast period?

The hospitals end-use category accounted for the highest CAGR in the global market.

Which region is fueling the growth of the Parenteral Nutrition industry?

In 2022, North America held the biggest market share of more than 41%.

Who are the major players in the global Parenteral Nutrition Market?

The top players include Baxter, Otsuka Pharmaceutical Factory, Inc., Forbes Media LLC. Other major players include B.Braun Melsungen AG, Fresenius SE & Co. KGaA,Grifols S.A and Pfizer, Inc.

What are the major market drivers of the Parenteral Nutrition industry?

Chronic illness Prevalence is rising, as is the demand for home parenteral nutrition is the major market drivers.

What are the major market restraints of the Parenteral Nutrition industry?

The key market restrictions are that parenteral nutrition products are expensive and raise the risk of infections and consequences; alternatives are available.

What are the major market opportunities of the Parenteral Nutrition industry?

Increasing Use in Critical Care Settings and an Ageing Population are the major opportunities in the Parenteral Nutrition industry.

Molecular Transport Medium Market

Published:
Report ID: 35092

Angiotensin Converting Enzyme (ACE) Inhibitors Market

Published:
Report ID: 12832

Stroke Management Market

Published:
Report ID: 34872

Pulmonary Embolism Market

Published:
Report ID: 34866

Oral Macromolecular Formulation Market

Published:
Report ID: 34861

Metastatic Melanoma Cancer Diagnostics Market

Published:
Report ID: 34855

Cytomegalovirus (CMV) Infection Treatment Market

Published:
Report ID: 4417

Immune Checkpoint Inhibitors Market

Published:
Report ID: 34697

Intraosseous Devices Market

Published:
Report ID: 7197

Dermatophytic Onychomycosis Therapeutics Market

Published:
Report ID: 34653

Africa Pharmaceutical Market

Published:
Report ID: 34584

Allergic Rhinitis Treatment Market

Published:
Report ID: 34575

Purchase Options

$2999
Delivery Format: Excel.
$4999
Designed for the individual purchaser.
$6999
Users located at a single corporate site or regional office.
$7999
Allowed for unlimited sharing globally within one company.
Smallform of Sample request

Have a question?

User Profile

Don’t settle for less – trust Mitul to help you find the best solution.

Report delivery within 24 to 48 hours

– Other Info –

What people say?-

User Review

I am very impressed with the information in this report. The author clearly did their research when they came up with this product and it has already given me a lot of ideas.

Jana Schmidt
CEDAR CX Technologies

– Connect with us –

Phone

+91 6232 49 3207


support

24/7 Research Support


sales@credenceresearch.com

– Research Methodology –

Going beyond the basics: advanced techniques in research methodology

– Trusted By –

Pepshi, LG, Nestle
Motorola, Honeywell, Johnson and johnson
LG Chem, SIEMENS, Pfizer
Unilever, Samsonite, QIAGEN