Market Overview
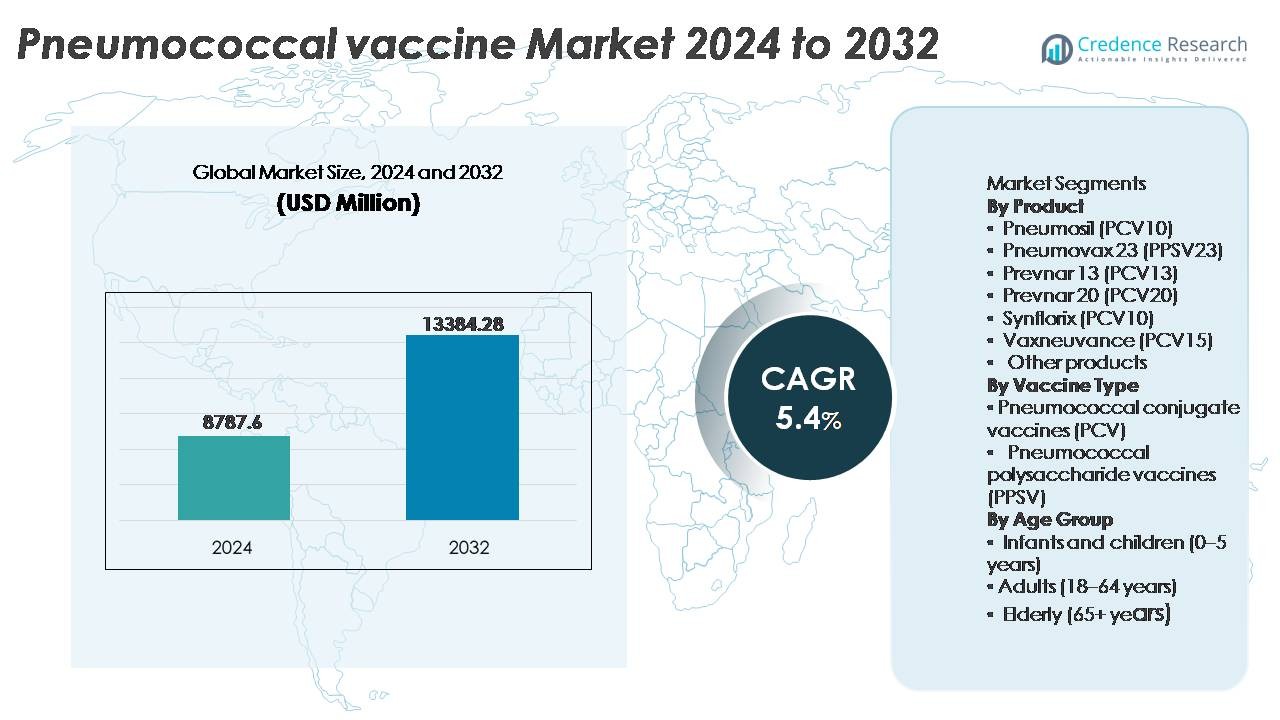
The pneumococcal vaccine market was valued at USD 8,787.6 million in 2024 and is anticipated to reach USD 13,384.28 million by 2032, expanding at a CAGR of 5.4% during the forecast period.
| REPORT ATTRIBUTE |
DETAILS |
| Historical Period |
2020-2023 |
| Base Year |
2024 |
| Forecast Period |
2025-2032 |
| Pneumococcal Vaccine Market Size 2024 |
USD 8,787.6 Million |
| Pneumococcal Vaccine Market, CAGR |
5.4% |
| Pneumococcal Vaccine Market Size 2032 |
USD 13,384.28 Million |
The pneumococcal vaccine market is led by major global manufacturers including GlaxoSmithKline, Pfizer, Merck & Co., Serum Institute of India, Walvax Biotechnology, Beijing Minhai Biological Technology, and Bio-Manguinhos/Fiocruz, each advancing vaccine formulations with broader serotype coverage and enhanced immunogenicity. The competitive landscape is shaped by strong portfolios in conjugate vaccines, long-term procurement contracts, and expansion into emerging immunization programs. North America dominates the global market with approximately 56–60% share, driven by robust healthcare systems, high vaccination compliance across pediatric and geriatric groups, and rapid adoption of higher-valency PCVs. Asia-Pacific follows as the fastest-growing region, supported by large birth cohorts and expanding national vaccination initiatives.
Access crucial information at unmatched prices!
Request your sample report today & start making informed decisions powered by Credence Research Inc.!
Download Sample
Market Insights
- The global pneumococcal vaccine market was valued at USD 8,787.6 million in 2024 and is projected to reach USD 13,384.28 million by 2032, growing at a CAGR of 5.4% during the forecast period.
- Market growth is driven by expanding national immunization schedules, rising adult and elderly vaccination adoption, and increasing burden of antimicrobial-resistant pneumococcal infections promoting prevention-focused healthcare strategies.
- Key trends include rapid transition toward higher-valency conjugate vaccines, local manufacturing partnerships for affordable supply, and growing private-sector vaccination uptake in developing economies.
- Competitive intensity remains high with leading players such as Pfizer, Merck & Co., GlaxoSmithKline, Serum Institute of India, and Walvax Biotechnology competing on efficacy, serotype coverage, and pricing in public procurement programs.
- North America leads with approximately 56-60% market share, followed by Europe at 15-20% and Asia-Pacific at 15-18%, while conjugate vaccines represent the dominant segment, accounting for the majority of global demand.
Market Segmentation Analysis:
By Product:
Prevnar 13 (PCV13) represents the dominant product segment, accounting for the largest market share due to its extensive adoption in national immunization schedules and strong clinical evidence preventing invasive pneumococcal disease in pediatric populations. The continued use of Pneumosil (PCV10) and Synflorix (PCV10) remains notable in cost-sensitive markets, driven by procurement under global health initiatives. Meanwhile, Pneumovax 23 (PPSV23) and emerging Vaxneuvance (PCV15) and Prevnar 20 (PCV20) are gaining traction among adults and older adults, as broader serotype coverage is prioritized, especially in regions experiencing rising antimicrobial resistance.
- For instance, Pfizer reported that global distribution of Prevnar 13 surpassed 1 billion cumulative doses as of 2021, supported by clinical trial evidence across over 44 countries, where post-vaccination surveillance demonstrated significant reductions in serotype-specific invasive disease in children.
By Vaccine Type:
Pneumococcal conjugate vaccines (PCV) hold the dominant market share, supported by superior immunogenicity, long-term memory response, and strong recommendation by global immunization guidelines for children and high-risk adults. PCVs have become the preferred choice due to increased coverage of disease-causing serotypes and their demonstrated effectiveness in reducing nasopharyngeal carriage, contributing to herd immunity. Pneumococcal polysaccharide vaccines (PPSV) continue to serve critical use cases among older adults and immune-compromised populations; however, the lack of mucosal immunity and lower durability of protection positions PPSV as complementary rather than primary in large-scale vaccination programs.
- For instance, Pfizer’s clinical evaluation of Prevnar 13 involved over 37,000 pediatric and adult participants globally, with documented data showing a measurable reduction in vaccine-type carriage across multiple population cohorts, strengthening its role in both direct and indirect protection strategies.
By Age Group:
Infants and children (0-5 years) form the dominant age-group segment, driven by compulsory immunization schedules, strong government procurement, and the high disease burden within early childhood populations. PCV products remain essential in this segment due to proven reduction in invasive disease, meningitis, and pneumonia in young children. The adult (18-64 years) segment is expanding as workplace and travel-associated preventive vaccination rises, while the elderly (65+) segment benefits from PPSV and higher-valency PCVs due to increased susceptibility and co-morbidity-driven risk profiles, creating consistent demand for booster and catch-up doses.
Key Growth Drivers
Expanding Immunization Programs and Government Funding
Global expansion of national immunization programs serves as the primary growth engine for the pneumococcal vaccine market. Governments and public health agencies increasingly allocate budgetary support for pneumococcal conjugate vaccines (PCVs) for newborns, school-entry children, and high-risk adult populations. International healthcare alliances continue providing procurement assistance, improving uptake in low- and middle-income countries and widening access for underserved demographics. Booster-dose recommendations and catch-up vaccination strategies further reinforce sustained volume demand, especially in regions transitioning from pilot introduction to nationwide coverage. Policy shifts encouraging broader adult vaccination particularly in population segments with chronic respiratory conditions, diabetes, or immunosuppressive disorders contribute to market stability. These initiatives, combined with rising global healthcare expenditure and routine vaccination integration into maternal and geriatric care pathways, ensure consistent long-term demand for pneumococcal vaccines, strengthening market penetration across both developed and emerging economies.
- For instance, Gavi, the Vaccine Alliance, has facilitated the delivery of over one billion doses of pneumococcal conjugate vaccines (PCVs) to eligible countries, helping to protect more than 300 million children across approximately 60 lower-income countries, strengthening childhood pneumococcal immunization capacity across Africa and South Asia.
Advancements in Higher-Valency and Broader Coverage Vaccines
R&D investment in next-generation higher-valency pneumococcal conjugate vaccines is accelerating market adoption as manufacturers focus on extending serotype coverage, enhancing durability, and improving immune response in adults and elderly populations. Innovations targeting coverage of emerging serotypes linked to antimicrobial resistance are reshaping clinical preferences and procurement priorities. Product development focused on immunogenicity improvement in immunocompromised patients and older adults is driving replacement demand for legacy PCV10 and PCV13 formulations. Additionally, evolving technologies in carrier protein selection, adjuvant optimization, and scalable production platforms support accelerated regulatory approvals and supply resilience. As pipeline vaccines aim to reduce booster dependency and address regional serotype diversity, health systems increasingly view advanced PCVs as cost-effective preventive interventions. These scientific advancements create long-term competitive differentiation and reinforce global transition toward newer, multi-valent pneumococcal vaccines.
- For instance, Pfizer’s Prevnar 20 expands immune protection to 20 distinct serotypes, supported by a development program comprising six Phase 3 clinical studies evaluating immunogenicity and safety in more than 5,400 adults, ranging from 18 years to over 85 years of age.
Rising Disease Incidence and Antibiotic Resistance Concerns
Increasing incidence of pneumococcal pneumonia and invasive pneumococcal disease among infants, geriatric populations, and patients with comorbidities fuels the urgency for preventive vaccination strategies. Escalating resistance to frontline antibiotics including macrolides and penicillin intensifies reliance on vaccines as a primary defense mechanism. Healthcare systems and clinical guidelines advocate vaccination to reduce hospitalization, intensive care admissions, and recurrent infection risks that strain healthcare resources. Seasonal fluctuations in respiratory infections further heighten awareness and accelerate uptake, particularly in densely populated urban regions. Vaccine-driven herd immunity continues to demonstrate significant reduction in community transmission, reinforcing preventive value. With aging demographics and rising prevalence of chronic pulmonary disorders, the global pneumococcal burden is projected to remain high, making vaccination a strategic public health imperative, thereby sustaining market growth.
Key Trends & Opportunities
Transition Toward Adult and Senior Vaccination Markets
A notable market trend lies in the rapid shift from child-focused immunization toward broader adult and senior vaccination strategies. Aging populations with increased mortality risk from pneumococcal infections are pushing healthcare systems to adopt lifelong vaccination frameworks, including booster schedules for adults over 50 and routine vaccination for those above 65. Education campaigns and employer-sponsored vaccination programs expand access, while pharmacies and retail clinics emerge as alternative distribution channels. Growing emphasis on occupational risk particularly in healthcare, transportation, and manufacturing creates new avenues for adult vaccination. As clinical data supports cost reduction through prevention rather than treatment, payer policies increasingly reimburse adult vaccination, positioning this demographic as a high-value growth segment.
- For instance,”Pfizer’s adult Phase 3 clinical program for Prevnar 20 comprised three studies that collectively enrolled more than 6,000 adult participants. These trials included adults across various age groups, including those aged 65 years and older (some over 85), both with and without prior pneumococcal vaccination history.
Public–Private Partnerships and Global Health Procurement Models
Collaborations between vaccine manufacturers, global health organizations, and government procurement bodies are creating new distribution and funding opportunities. Partnerships enable cost-sharing, production scale, and streamlined supply chain logistics for low-income regions where disease burden is highest. Long-term procurement contracts stabilize pricing and supply predictability, encouraging manufacturers to allocate capacity for underserved markets. Additionally, vaccine security strategies, including regional manufacturing hubs and technology-transfer programs, strengthen domestic capabilities and reduce disruptions from global uncertainties. As sustainability and access equity drive public health discourse, these cross-sector partnerships unlock multi-year market potential and broaden pneumococcal vaccine access.
- For instance, Serum Institute of India partnered with PATH to develop Pneumosil under a program that enabled manufacturing at scale exceeding 100 million doses per year, specifically geared for affordable distribution in LMICs.
Key Challenges
Pricing Pressure and Procurement Cost Constraints
Despite strong demand, the pneumococcal vaccine market faces persistent pricing pressure due to budget constraints in emerging economies and the high cost of next-generation higher-valency formulations. Tender-based procurement models demand competitive pricing, reducing margins for multinational manufacturers while challenging smaller companies to scale production economically. Affordability remains a barrier for private-pay markets without reimbursement support. Moreover, the cost of storage, transport, and cold-chain compliance increases overall program expenditure, particularly in rural and remote geographies. These constraints influence formulary decisions and slow adoption of newer vaccines, creating disparities in access across income tiers and regions.
Complex Serotype Dynamics and Variant Emergence
Pneumococcal serotype evolution presents an ongoing challenge as dominant strains vary geographically and may shift over time in response to vaccination pressure. Replacement serotypes and regional serotype gaps limit the universal effectiveness of standardized vaccine formulations. This necessitates continuous surveillance, serotype mapping, and iterative vaccine development cycles, which require extensive investment and regulatory scrutiny. Emerging serotypes associated with antimicrobial resistance underscore the clinical urgency, yet aligning global vaccine composition to regional disease patterns remains complex. These epidemiological uncertainties create strategic planning challenges for manufacturers and public health authorities, impacting vaccine selection, forecasting, and long-term disease control outcomes.
Regional Analysis
North America
North America remains the largest regional market for pneumococcal vaccines, accounting for roughly 56-60% of global revenue in 2024. This dominance reflects well-established immunization guidelines, high vaccine awareness, strong public and private healthcare infrastructure, and widespread adult as well as pediatric vaccine uptake. The United States and Canada benefit from advanced cold-chain logistics, routine pediatric PCV programs, and expanding adult/elderly vaccination initiatives. Continued regulatory support and adoption of high-valency conjugate vaccines maintain robust demand, ensuring North America’s central role in the global pneumococcal vaccine market.
Europe
Europe represents about 15-20% of the global pneumococcal vaccine market. The region’s share is buoyed by comprehensive national immunization programs, especially for infants and children, and growing adult/elderly vaccination coverage. Conjugate vaccines (PCVs) dominate, supported by public funding and unified health-policy frameworks. Western European countries lead uptake, aided by strong public health infrastructure, consistent supply chains, and high public acceptance. Rising incidence of pneumococcal disease in older populations and enhanced antibiotic-resistance awareness further drive demand, reinforcing Europe’s position as a stable and sizable regional market.
Asia-Pacific
The Asia-Pacific region contributes approximately 15-18% of the global pneumococcal vaccine market, emerging as one of the fastest-growing segments. Rapid population growth, expanding birth cohorts, increasing healthcare investment, and scaling immunization programs particularly in countries like China, India, and other emerging economies fuel demand. The entry of locally manufactured PCVs and growing private-sector vaccine uptake improve affordability and access. Urbanization, rising middle-class incomes, and expanding awareness about adult and pediatric vaccination further strengthen growth potential. As governments broaden vaccine coverage and infrastructure improves, Asia-Pacific is poised to rise in market significance.
Latin America
Latin America accounts for an estimated 5-7% of the global pneumococcal vaccine market. Public immunization programs especially in childhood underpin demand, though adult vaccine uptake lags due to economic variability and limited reimbursement in some countries. Urban areas witness better coverage supported by improved healthcare access, but rural and underserved regions remain challenging. International health-aid programs and regional public-private partnerships help sustain supply and affordability. Growing awareness of pneumococcal disease burden and periodic national vaccination campaigns keep Latin America as a steady, albeit smaller, regional contributor.
Middle East & Africa
The Middle East and Africa together represent around 3-5% of the global pneumococcal vaccine market. Although market share remains modest, increasing investment in healthcare infrastructure, donor-funded immunization drives, and expansion of cold-chain capabilities gradually improve access. Many countries prioritize infant and early-childhood vaccination under national immunization programs, often aided by international funding. Challenges including logistical distribution, economic constraints, and uneven urban-rural coverage limit adult vaccination. Nonetheless, rising recognition of pneumococcal disease risk, especially in vulnerable populations, signals gradual but steady long-term growth potential in the region.
Market Segmentations:
By Product
- Pneumosil (PCV10)
- Pneumovax 23 (PPSV23)
- Prevnar 13 (PCV13)
- Prevnar 20 (PCV20)
- Synflorix (PCV10)
- Vaxneuvance (PCV15)
- Other products
By Vaccine Type
- Pneumococcal conjugate vaccines (PCV)
- Pneumococcal polysaccharide vaccines (PPSV)
By Age Group
- Infants and children (0–5 years)
- Adults (18–64 years)
- Elderly (65+ years)
By Geography
- North America
- Europe
- Germany
- France
- U.K.
- Italy
- Spain
- Rest of Europe
- Asia Pacific
- China
- Japan
- India
- South Korea
- South-east Asia
- Rest of Asia Pacific
- Latin America
- Brazil
- Argentina
- Rest of Latin America
- Middle East & Africa
- GCC Countries
- South Africa
- Rest of the Middle East and Africa
Competitive Landscape
The competitive landscape of the pneumococcal vaccine market is characterized by the dominance of a few multinational pharmaceutical companies, intensified R&D investment, and continuous product innovation focused on higher-valency conjugate vaccines. Market leaders compete on immunogenicity, serotype coverage, safety profiles, and pricing strategies tailored to public procurement models. Strategic collaborations with global health organizations, technology transfers, and long-term supply agreements play a crucial role in securing market presence, particularly in emerging economies. Companies expand portfolios through lifecycle management, label extensions, and the introduction of adult-focused formulations amid rising geriatric vaccination demand. Manufacturing scale, cold-chain capabilities, and regulatory agility remain differentiating factors, influencing tender awards and competitive negotiation with national immunization programs. As antibiotic resistance and regional serotype shifts shape future requirements, the market is likely to see accelerated innovation cycles and potential new entrants, intensifying competition in both premium and cost-sensitive segments.
Shape Your Report to Specific Countries or Regions & Enjoy 30% Off!
Key Player Analysis
Recent Developments
- In June 2024, Merck & Co. received U.S. FDA approval for its 21-valent conjugate vaccine CAPVAXIVE, intended to prevent invasive pneumococcal disease in adults.
- In April 2023, Pfizer announced the approval of its PREVNAR 20, a 20-valent pneumococcal conjugate vaccine, by the U.S. Food and Drug Administration (FDA), indicated for the prevention of invasive pneumococcal disease in children aged between six weeks and 17 years. The vaccine was also indicated for use in children aged between six weeks and five years for the prevention of otitis media. This approval significantly expanded the company’s existing dominant position in the market.
Report Coverage
The research report offers an in-depth analysis based on Product, Vaccine type, Age group and Geography. It details leading market players, providing an overview of their business, product offerings, investments, revenue streams, and key applications. Additionally, the report includes insights into the competitive environment, SWOT analysis, current market trends, as well as the primary drivers and constraints. Furthermore, it discusses various factors that have driven market expansion in recent years. The report also explores market dynamics, regulatory scenarios, and technological advancements that are shaping the industry. It assesses the impact of external factors and global economic changes on market growth. Lastly, it provides strategic recommendations for new entrants and established companies to navigate the complexities of the market.
Future Outlook
-
- Higher-valency pneumococcal vaccines will gain accelerated adoption as countries update immunization schedules.
- Adult and elderly vaccination will expand as preventive healthcare becomes a global priority.
- Local manufacturing partnerships and technology transfer will improve affordability and supply security.
- Combination vaccines targeting multiple respiratory pathogens will emerge as competitive differentiators.
- Digital vaccination records and surveillance systems will enhance coverage tracking and disease monitoring.
- Cold-chain optimization and single-dose formats will improve accessibility in remote regions.
- Public-private partnerships will strengthen national procurement and long-term supply contracts.
- Increasing focus on antimicrobial resistance will reinforce vaccines as frontline prevention.
- Lifecycle management and label expansion will extend the use of existing vaccine portfolios.
- Investment in emerging markets will drive volume growth as infrastructure and awareness improve.


