
Sepsis, respiratory peaks and MRI access lift scan volumes
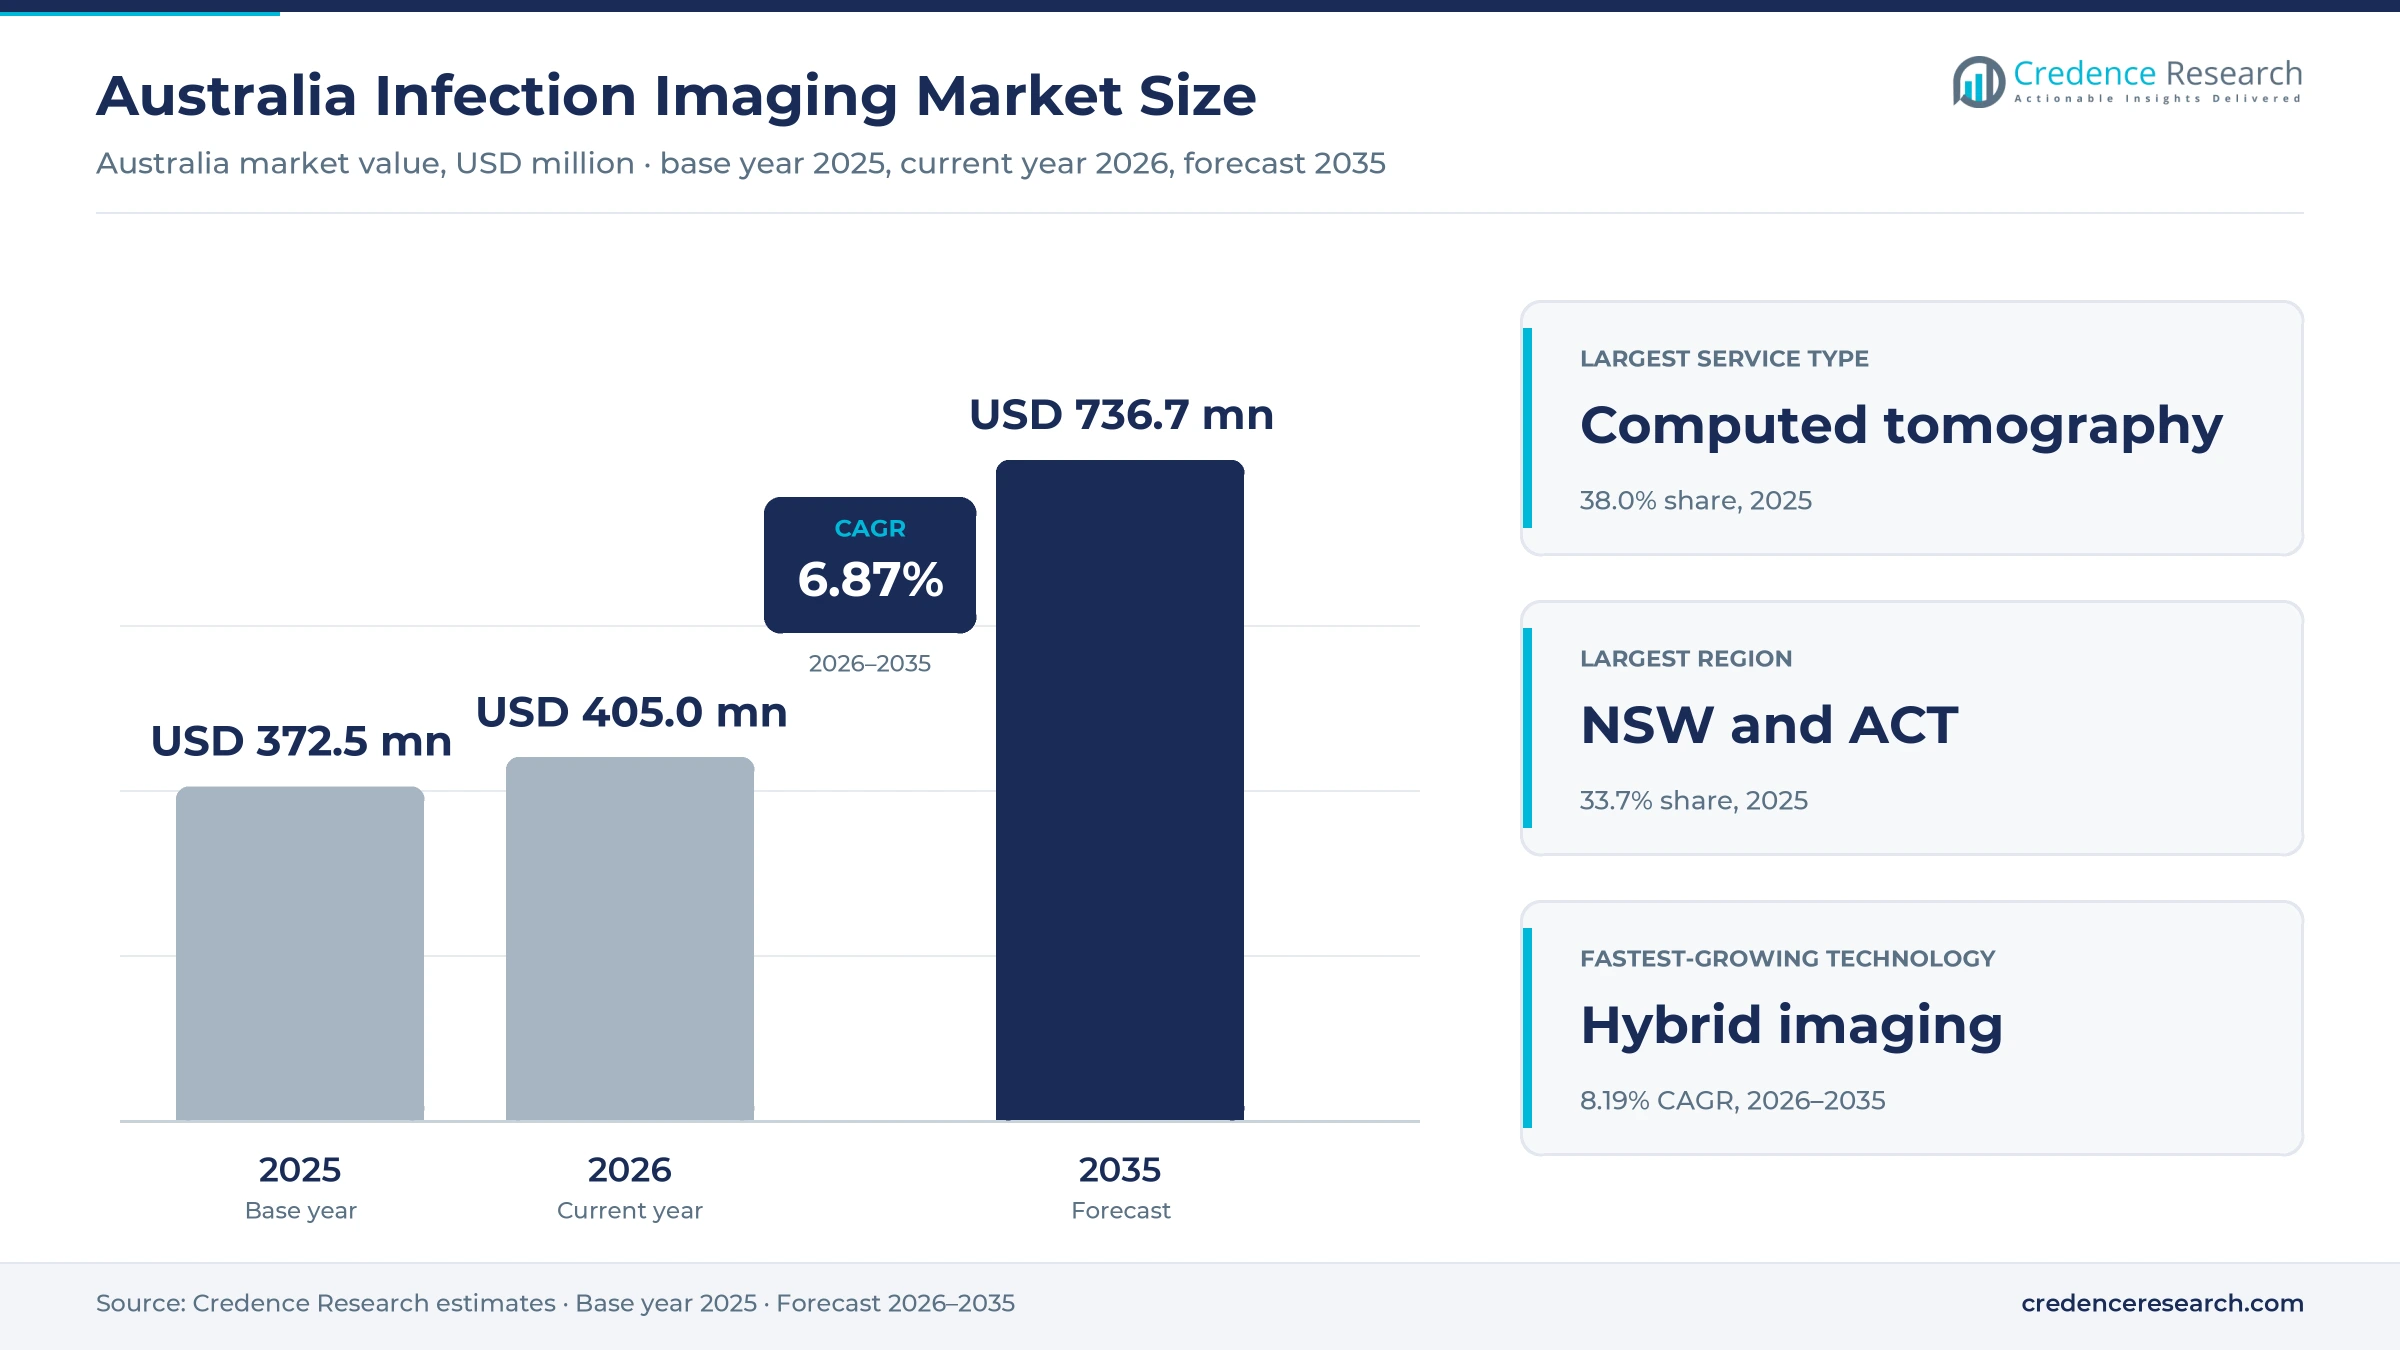
The Australia infection imaging market was valued at USD 372.5 million in 2025 and is projected to increase from USD 405.0 million in 2026 to USD 736.7 million by 2035, registering a CAGR of 6.87% during 2026–2035. Demand comes from a heavy acute infection caseload in public hospitals, from Medicare reforms that widen access to funded MRI, and from clinicians who use PET and SPECT scans when standard tests fail to find a source of fever. New South Wales and Australian Capital Territory held the largest share, 33.7% in 2025, because the region has the most residents and the most PET units. Queensland is the fastest-growing region at 7.30% a year, after a record influenza season in 2025 raised hospital admissions. In turn, MRI units at licensed comprehensive practices in metropolitan areas gained full Medicare eligibility on July 1, 2025, which shifts more infection workups into community clinics.
Which scans for suspected infection does the estimate count?
The estimate counts spending on diagnostic scans ordered to find, localize or monitor infection in Australian patients, including CT, MRI, nuclear medicine, radiography and ultrasound studies. It covers inpatient and outpatient work in public and private hospitals as well as community imaging practices, whether funded by Medicare, state health budgets, private insurers or patients.
The estimate excludes laboratory tests such as blood cultures, cancer staging scans, screening programs and the sale of scanners or radiotracers as products. The value chain runs from isotope producers and equipment makers through hospital radiology departments and private radiology networks to the general practitioners, specialists and emergency clinicians who request each scan.
Australia Infection Imaging Market Insights
- The Australia infection imaging market was valued at USD 372.5 million in 2025 and is projected to reach USD 736.7 million by 2035, registering a CAGR of 6.87% during 2026–2035.
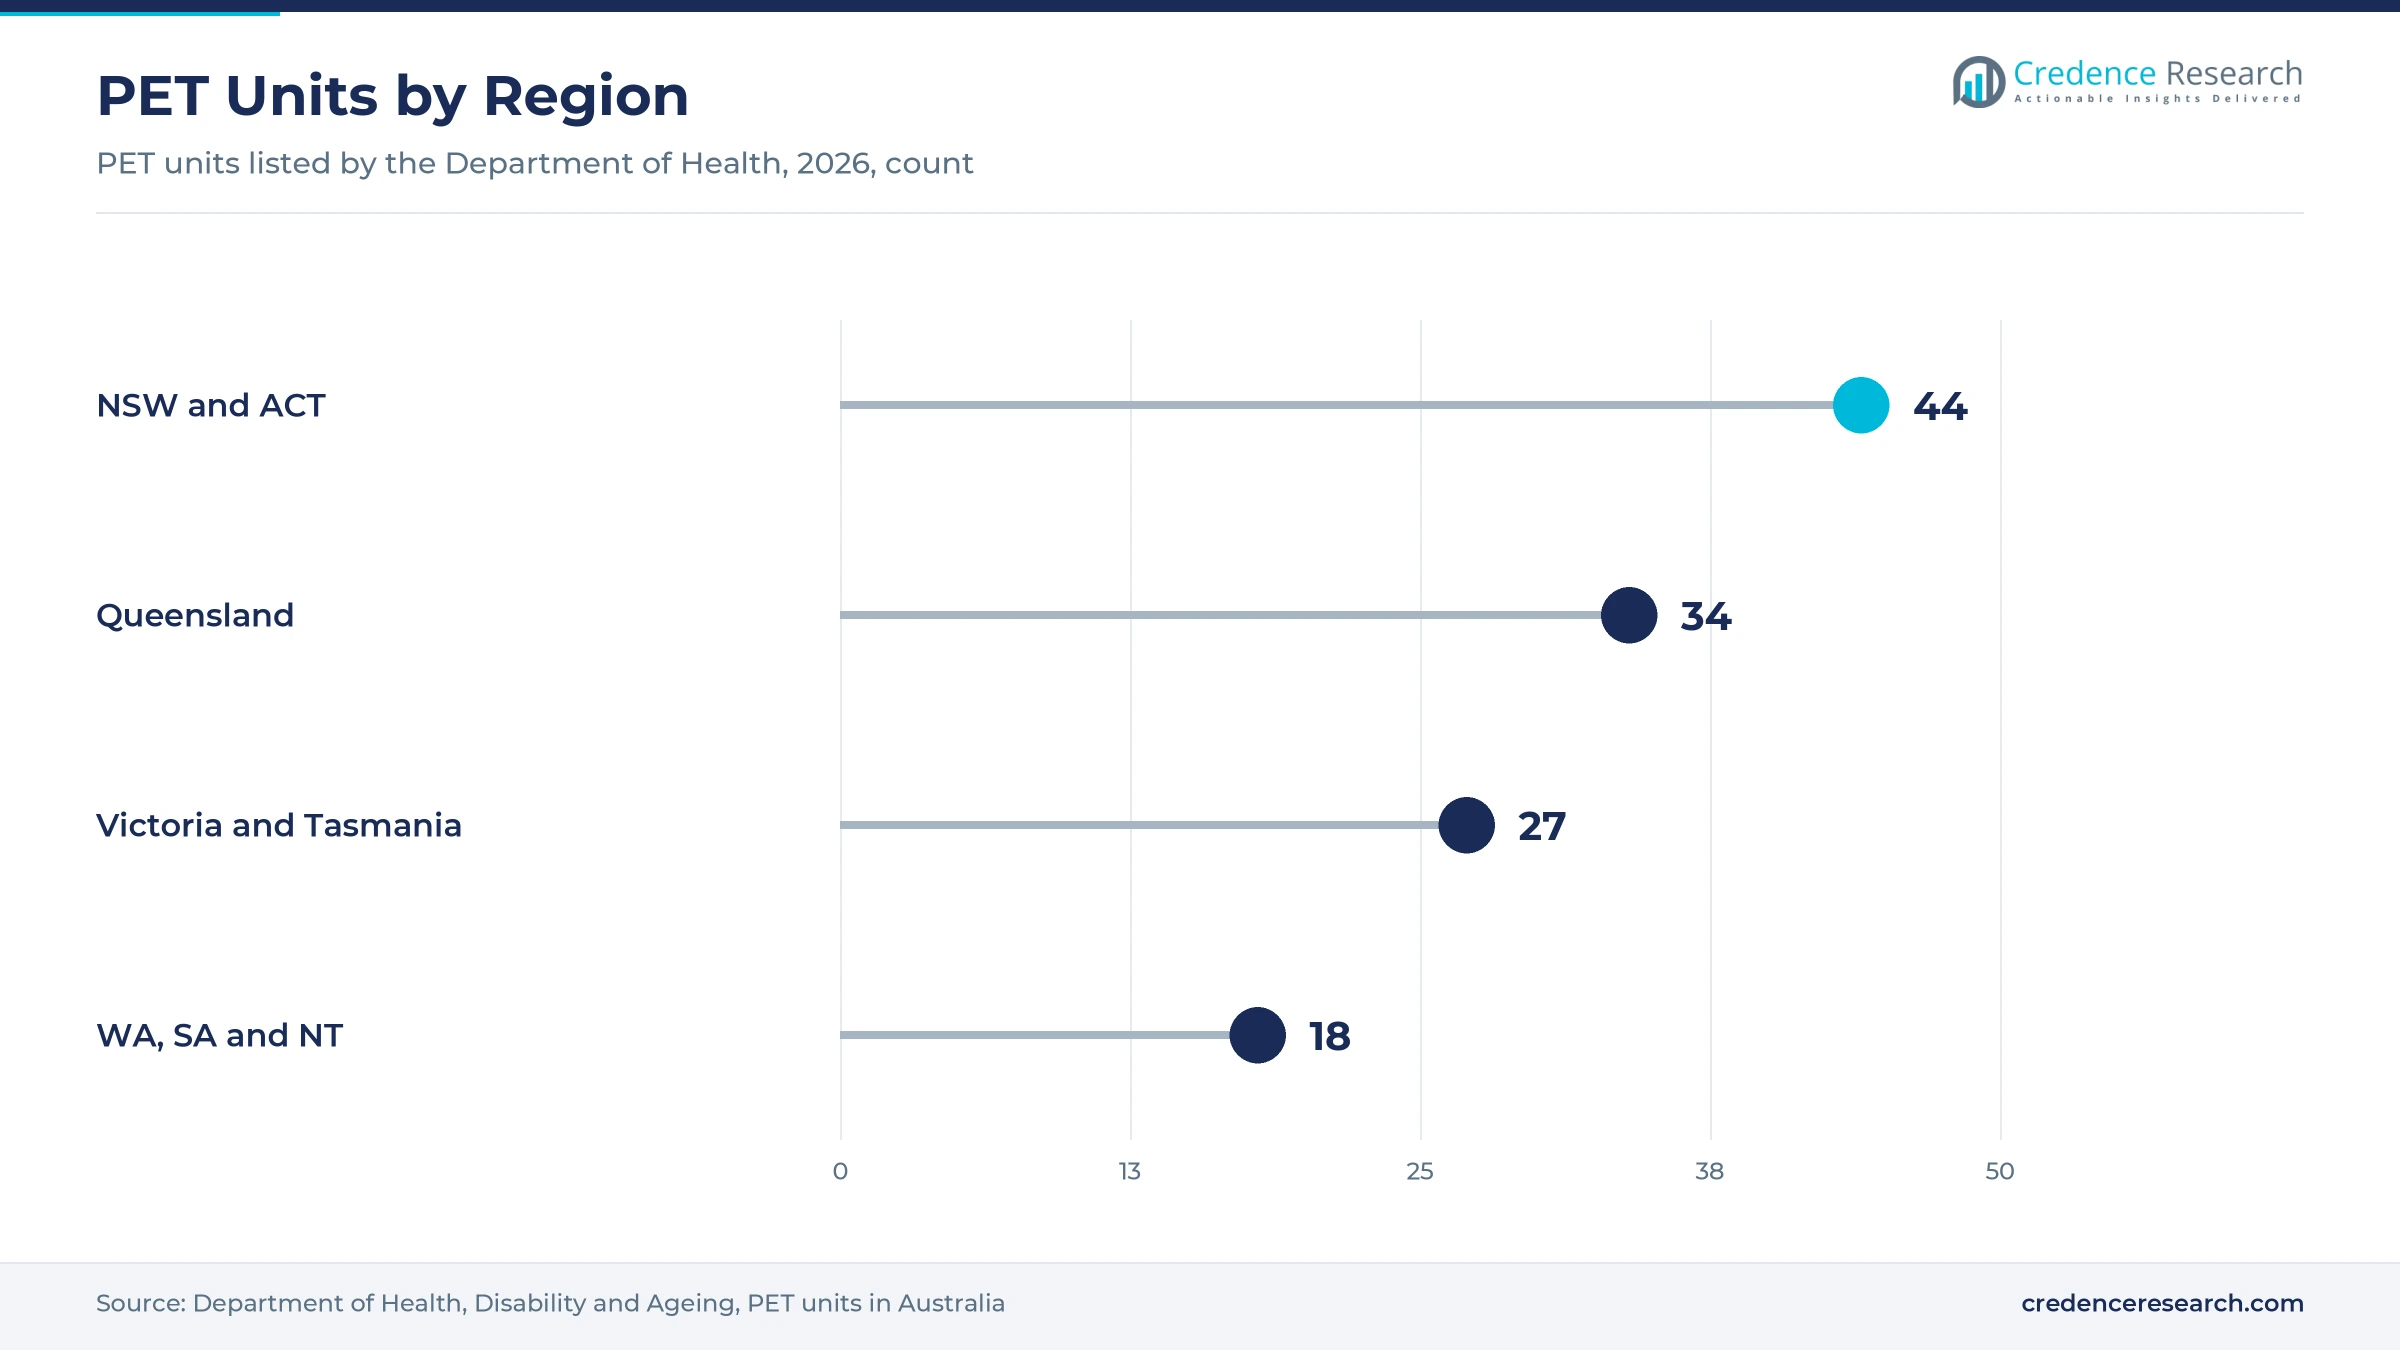
- New South Wales and Australian Capital Territory held a 33.7% share of 2025 value, supported by 44 listed PET units across the two jurisdictions.
- Computed tomography led service types with a 38.0% share of 2025 value, because CT is the first scan for most suspected chest, abdominal and spinal infections.
- MRI units at licensed comprehensive practices in metropolitan areas gained full Medicare eligibility on July 1, 2025, and all licensing requirements are set to end on July 1, 2027.
- Hybrid imaging grows fastest among technologies at 8.19% a year during 2026–2035, as an application to fund FDG PET for complex infection moves through review.
CT leads while hybrid PET and SPECT scans grow fastest
Why does computed tomography hold the largest share?
Based on service type, the market is categorized into Computed tomography, Magnetic resonance imaging, Nuclear medicine and Radiography and ultrasound. Computed tomography led with a 38.0% share of 2025 value, because emergency teams use it first for suspected chest, abdominal and spinal infection. Nuclear medicine grows fastest at 8.02% a year, as PET and white cell studies with radiopharmaceuticals resolve unclear cases.
Where are most infection scans performed?
Based on care setting, the market is categorized into Hospital inpatient, Hospital outpatient and Community imaging. Hospital inpatient led with a 46.0% share of 2025 value, because sepsis, pneumonia and bone infections are usually worked up after admission. Community imaging grows fastest at 7.31% a year, as fully funded MRI and PET-CT clinics move follow-up scans out of hospitals.
Which infection types drive the most scans?
Based on disease area, the market is categorized into Bone, joint and soft-tissue infections, Thoracic infections, Cardiovascular infections and Systemic and abdominal infections. Thoracic infections led with a 34.0% share of 2025 value, because pneumonia and influenza produce the largest volume of chest scans. Cardiovascular infections grow fastest at 7.78% a year, as endocarditis and device infections increasingly receive PET-CT.
How fast are hybrid scans gaining share?
Based on technology, the market is categorized into Anatomical imaging, Functional radionuclide imaging and Hybrid imaging. Anatomical imaging led with a 78.0% share of 2025 value, because CT, MRI, X-ray and ultrasound handle first-line diagnosis in nearly every hospital. Hybrid imaging grows fastest at 8.19% a year, as clinicians combine metabolic and anatomical views to locate hidden infection in fever, spine and prosthesis cases.
| Segment Group | Leading Sub-segment | Share, 2025 | Fastest-growing Sub-segment | CAGR, 2026–2035 |
|---|---|---|---|---|
| By Service Type | Computed tomography | 38.0% | Nuclear medicine | 8.02% |
| By Care Setting | Hospital inpatient | 46.0% | Community imaging | 7.31% |
| By Disease Area | Thoracic infections | 34.0% | Cardiovascular infections | 7.78% |
| By Technology | Anatomical imaging | 78.0% | Hybrid imaging | 8.19% |
Request a Free Sample
Fill in your details and we'll send you a free sample report.
- Sample data tables & charts
- Research methodology
Acute infections, MRI funding and PET pathways add scans
How does the acute infection workload keep scanners busy?
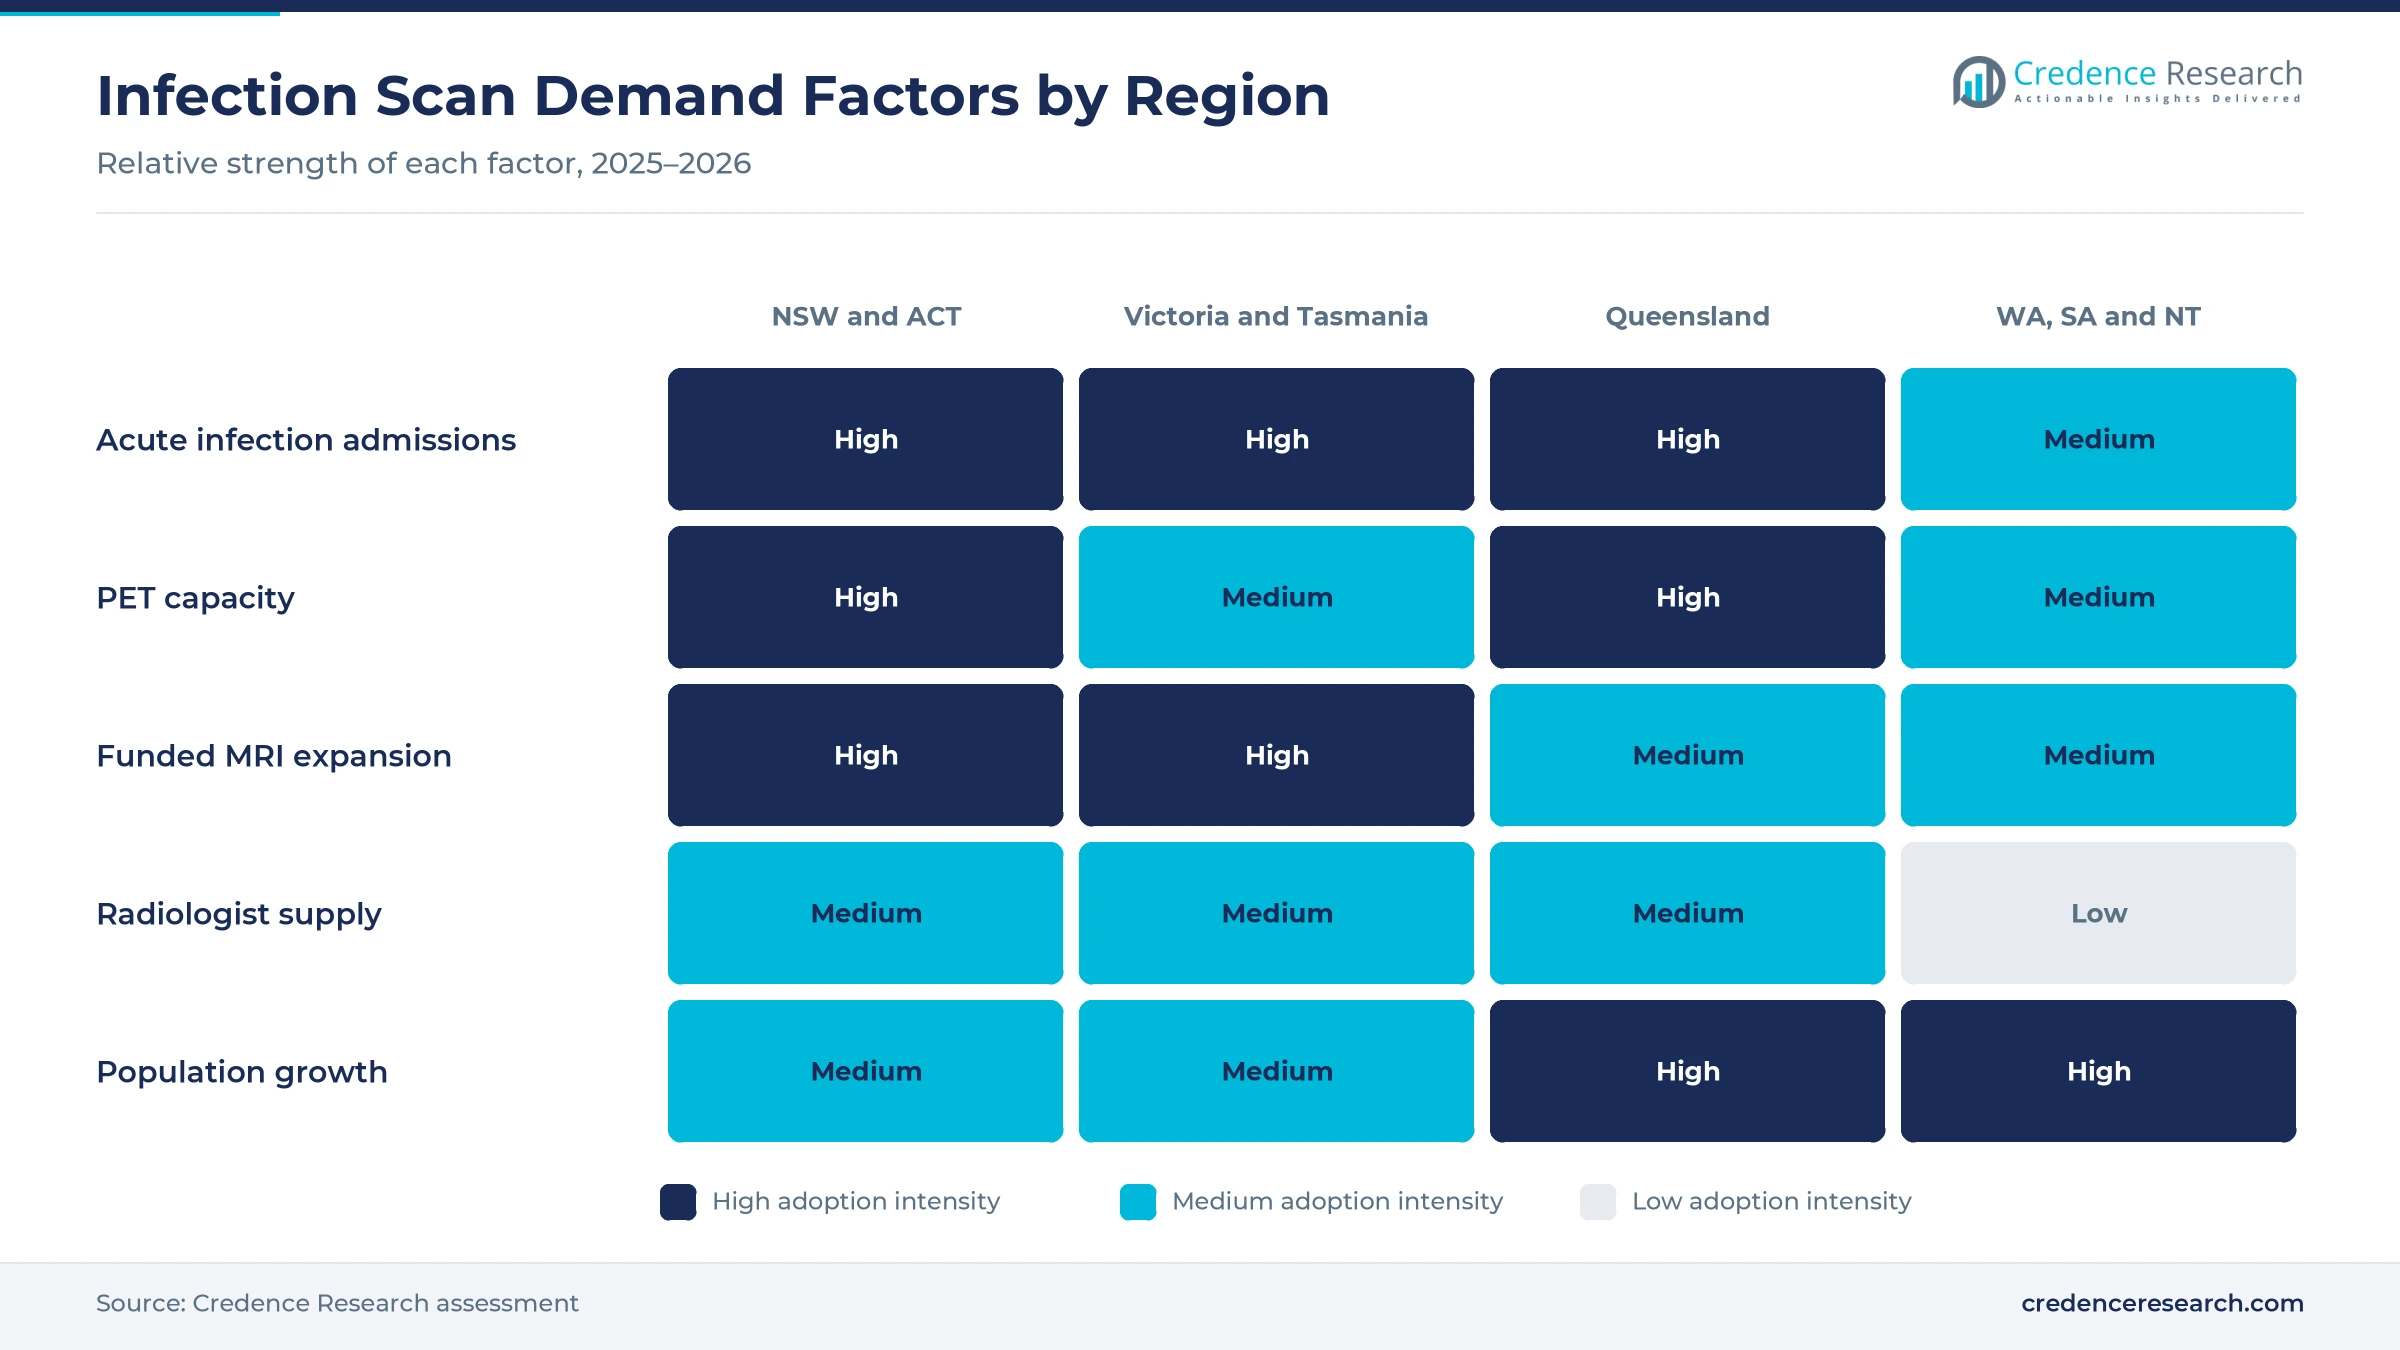
A large and rising acute infection caseload creates steady demand for chest, abdominal and spinal scans in hospitals across Australia. The Australian Commission on Safety and Quality in Health Care reported more than 84,000 sepsis hospitalizations in public hospitals in 2022-23, well above the earlier estimate of about 55,000 cases a year. The same Sepsis Epidemiology Report counted more than 900,000 sepsis-related hospitalizations over the ten years to 2022-23. Respiratory infections add seasonal peaks, and Queensland alone recorded 9,688 influenza hospital admissions in 2025, up from 7,017 in 2024. As a result, Thoracic infections lead disease areas with 34.0% of 2025 value, while sepsis diagnostics and scans are often ordered together.
Why does broader MRI funding lift community scanning?
Medicare reform is removing the old licensing limits that kept many MRI units from billing all funded MRI services, which matters for spinal, bone and soft-tissue infection workups. Under the 2024-25 Budget diagnostic imaging reforms, MRI units at licensed comprehensive practices in metropolitan areas gained full Medicare eligibility on July 1, 2025. From July 1, 2027, all MRI licensing requirements are set to end, so every eligible unit at a comprehensive practice can claim funded MRI services. The Department of Health noted that CT was the largest imaging expenditure, with A$1.5 billion in Medicare benefits paid in 2022-23. Consequently, Community imaging grows fastest among care settings at 7.31% a year.
How are hybrid scans entering complex infection pathways?
Clinicians increasingly turn to PET-CT and SPECT-CT when CT, MRI and blood tests fail to locate an infection, and a formal funding pathway is now under review. Queensland X-Ray, part of Sonic Healthcare, lodged Medical Services Advisory Committee application 1822 for FDG PET in complex infection, fever of unknown origin and neutropenic fever, with a proposed fee of A$953 per scan. The applicant estimates about 5,000 fever of unknown origin patients a year remain undiagnosed after initial tests, and about 1,000 endocarditis patients a year are not diagnosed by first-line tests. Its first full year forecasts about 2,000 fever patients and 650 complex infection patients. As a result, Hybrid imaging grows fastest at 8.19% a year.
How does an older population raise infection scan demand?
An aging population carries more joint replacements, cardiac devices and chronic conditions, which raises the number of hard-to-diagnose infections that need imaging. People aged 65 and over made up 18.1% of the Australian population in 2025, up from 15.9% in 2019, according to the World Bank. The Australian Orthopaedic Association National Joint Replacement Registry recorded its one millionth hip replacement in September 2025, and prosthetic joint infection is one of the cases named in the PET application. Patients with implants and cardiac devices often need repeat scans when an infection fails to clear after first treatment. Consequently, Hospital inpatient work keeps 46.0% of 2025 value, while older patients drive repeat scans.
FDG PET funding bids and network consolidation advance
Why is the shift to funded FDG PET for infection emerging?
Funding for FDG PET in infection is shifting from self-paid scans toward a possible Medicare item, which would widen access for public and private patients. The Medical Services Advisory Committee scheduled application 1822 for its PASC meeting on Aug. 13 and 14, 2026, after public consultation closed in July 2026. The application covers spinal infection, osteomyelitis, pediatric bone and joint infection, prosthetic joint infection, infective endocarditis and high-risk bacteremia. It claims accuracy consistently above 85% across these indications and positions PET as superior to second-line scans such as gallium and white cell studies. In turn, providers are expanding PET-CT scanners in community clinics ahead of any listing.
How is the rise of national radiology networks reshaping supply?
Ownership of Australian radiology is consolidating into larger networks, which changes how scanners, radiologists and reporting capacity are shared across states. Integral Diagnostics completed its merger with Capitol Health on Dec. 20, 2024, after the Australian Competition and Consumer Commission accepted an undertaking to divest one clinic in Melton West. Healius completed the sale of Lumus Imaging, which runs about 150 sites, to funds managed by Affinity Equity Partners in May 2025. Jardine Matheson then completed its acquisition of I-MED, which runs 215 clinics and performs about seven million procedures a year, in October 2026. As a result, large networks can route complex infection scans to sites with PET and wide-bore MRI.
Can PET access gaps outside the capitals become growth sites?
Uneven PET coverage creates an opening for providers that add hybrid scanners in outer suburbs and regional centers. The FDG PET application to the Medical Services Advisory Committee notes that PET is not available in every hospital and that about 15% of the population lives in areas with no PET service. The Department of Health lists 123 PET units nationally, but only one in the Northern Territory and three in Tasmania. Perth Radiological Clinic now runs PET at five sites, including Armadale North and Joondalup, which shows how private groups extend coverage. Consequently, Nuclear medicine grows fastest among service types at 8.02% a year.
Can secure isotope supply support more white cell scans?
A reliable domestic isotope supply gives providers room to grow nuclear medicine infection studies such as gallium and labeled white cell scans. The Australian Nuclear Science and Technology Organisation produces about 12,000 patient doses a week for around 250 hospitals and medical centers, according to the federal industry minister. ANSTO also supplies about 75% to 80% of the nuclear medicine isotopes used in Australia, and the government has backed a new manufacturing facility at Lucas Heights for the early to mid 2030s. Benson Radiology already runs six nuclear medicine sites in South Australia. In turn, Cardiovascular infections gain from wider access to functional scans for endocarditis and device infection.
Radiologist gaps, CT fee cuts and uneven PET access
How do radiologist shortages limit reporting capacity?
A shortage of radiologists slows reporting of complex infection scans, especially outside the capitals. The Department of Health, Disability and Ageing projects a national shortfall of 51.2 full-time equivalent radiologists in 2025, rising to 292.8 by 2038. Tasmania faces a 2025 gap equal to 27.2% of supply, while South Australia faces 9.7%. As a result, providers lean on teleradiology and subspecialty reporting hubs to keep turnaround times acceptable.
Why do CT fee cuts squeeze provider margins?
Federal fee changes reduce the return on the most common infection scan. The 2024-25 Budget cut the schedule fee for all CT services by 2% from Nov. 1, 2024, while nuclear medicine received a one-off 3.5% increase for non-PET services. As a result, providers face pressure on CT margins just as demand for chest and abdominal scans keeps rising. Larger networks respond by pushing higher-value MRI and PET services and by improving scanner use.
How does uneven PET coverage delay diagnosis?
Patients far from a PET unit often wait longer for an answer when standard tests fail to locate infection. The Northern Territory has one listed PET unit and Tasmania has three, compared with 40 in New South Wales. As a result, regional clinicians may rely on repeated CT or gallium scans, which can add hospital days. Providers respond with patient transfer pathways and new PET sites in outer suburbs and regional centers.
Why does the self-funded status of infection PET slow uptake?
FDG PET for infection has no dedicated Medicare item, so many patients or hospitals pay for the scan themselves. The MSAC application describes the service as currently self-funded and proposes a fee of A$953. As a result, referrers in private practice may choose cheaper second-line scans even when PET would answer the question faster. A funding decision after the 2026 review process would remove much of this barrier for eligible patients.
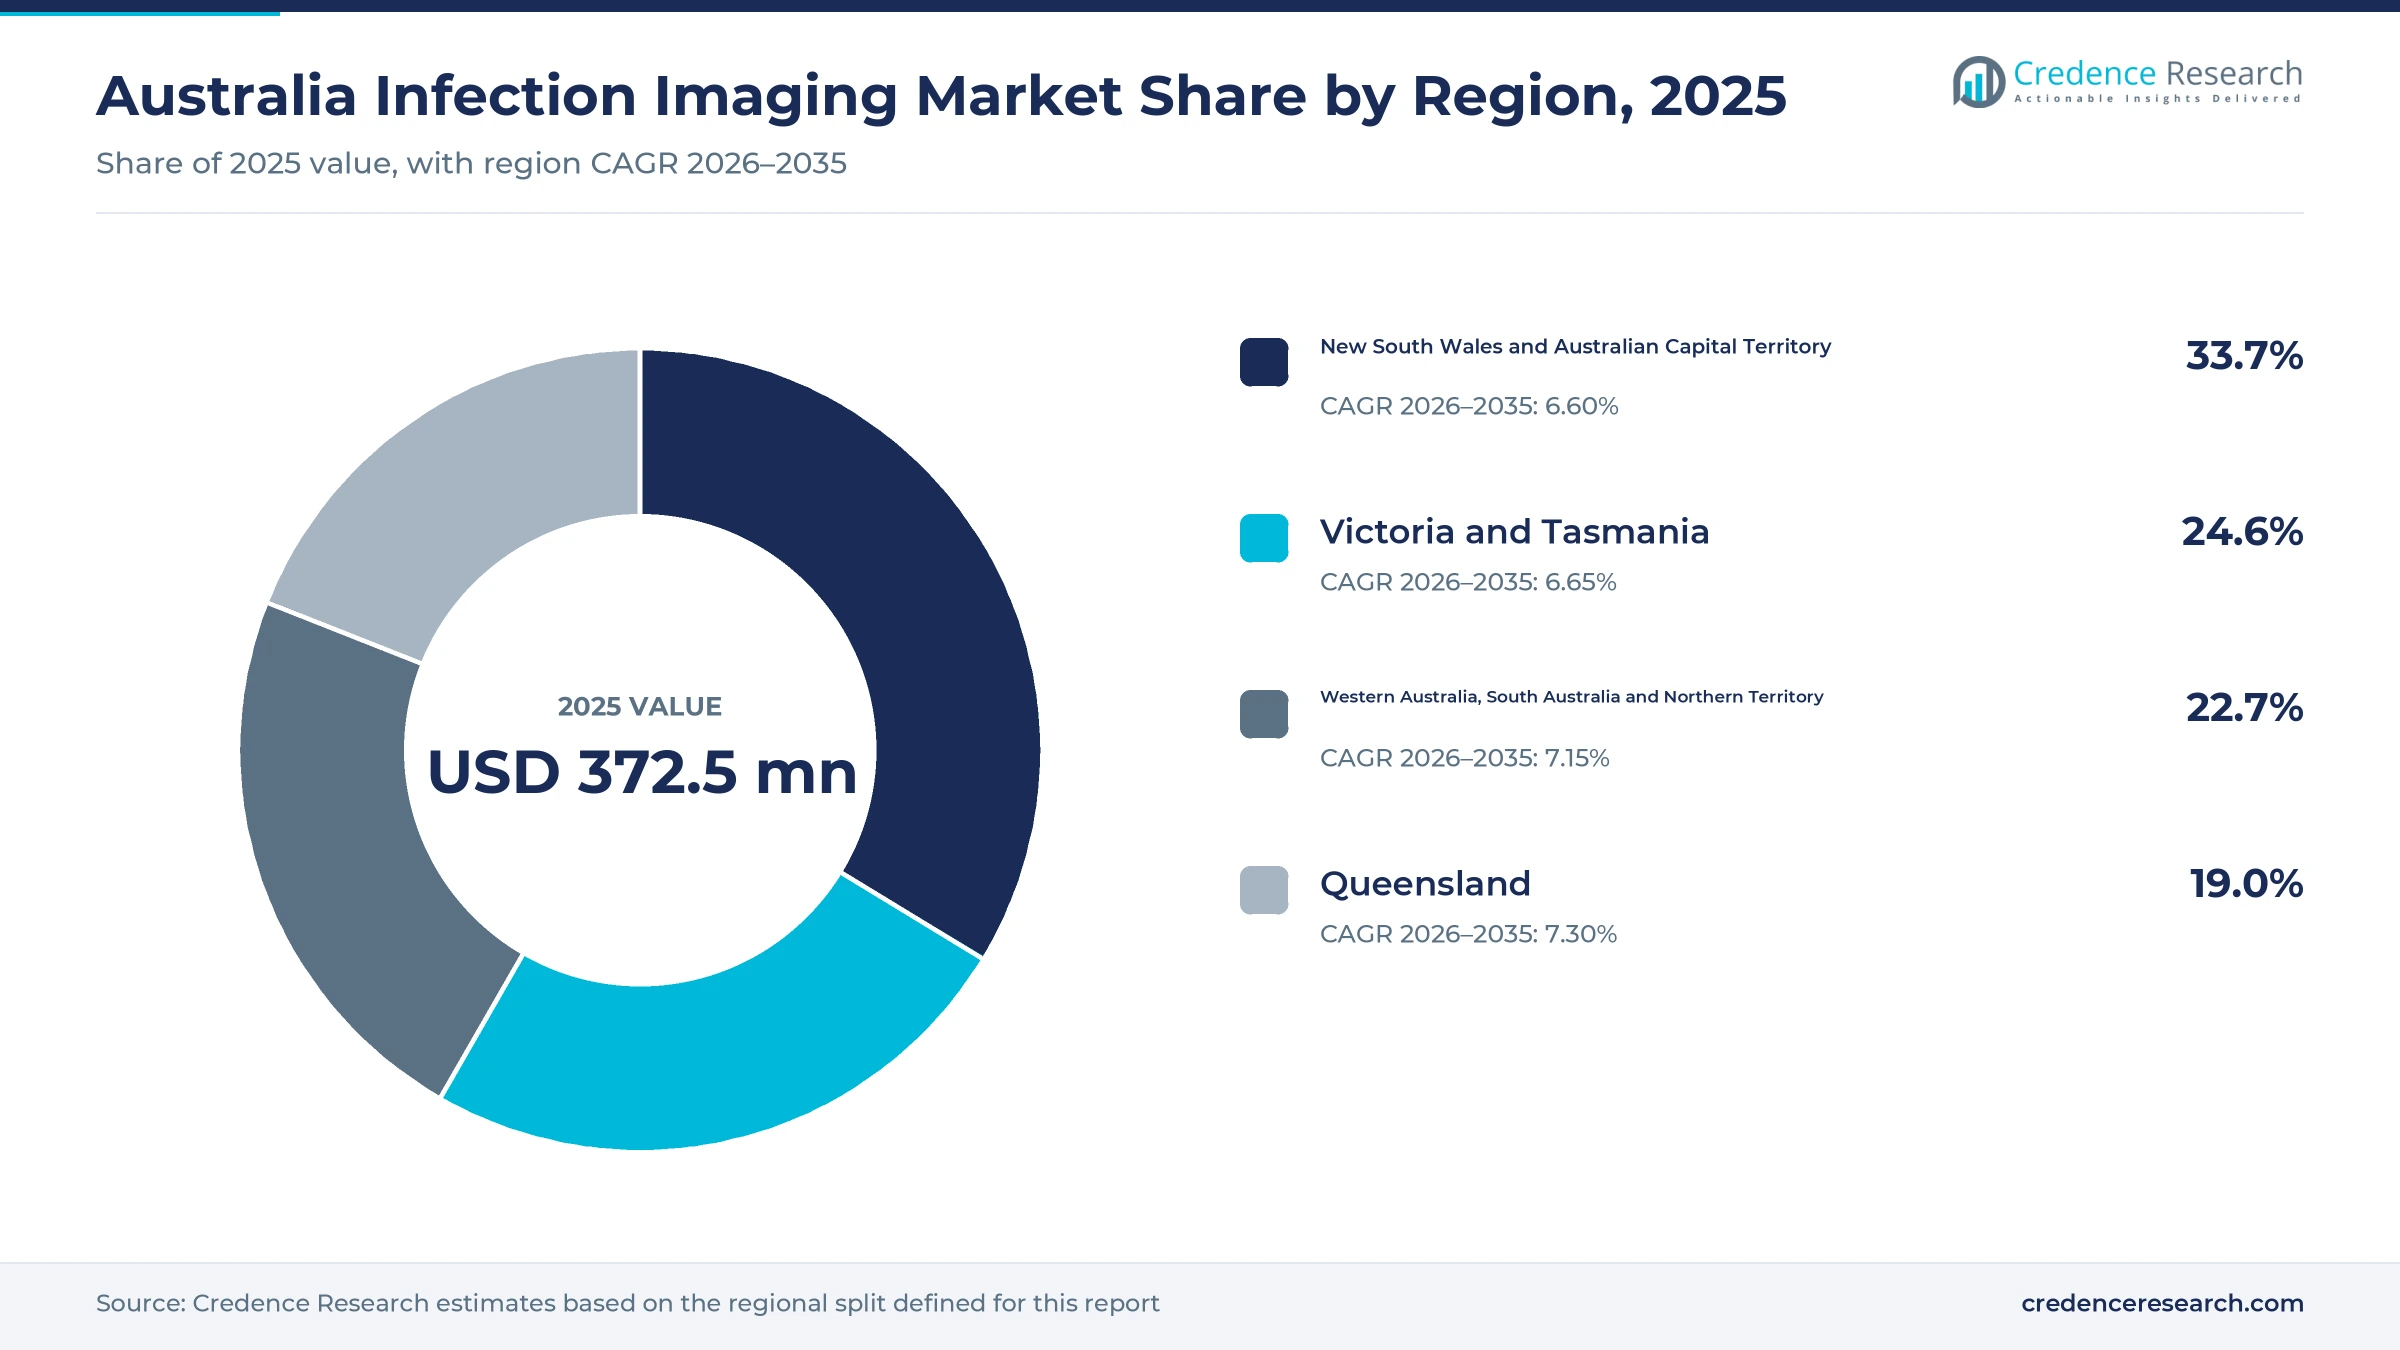
New South Wales and ACT lead while Queensland grows fastest
| Region | Value, 2025 (USD million) | Share, 2025 | CAGR, 2026–2035 |
|---|---|---|---|
| New South Wales and Australian Capital Territory | 125.5 | 33.7% | 6.60% |
| Victoria and Tasmania | 91.6 | 24.6% | 6.65% |
| Western Australia, South Australia and Northern Territory | 84.6 | 22.7% | 7.15% |
| Queensland | 70.8 | 19.0% | 7.30% |
Why do population and PET capacity keep New South Wales ahead?
New South Wales and Australian Capital Territory held 33.7% of 2025 value and grow at 6.60% a year, because the region combines the largest population with the deepest PET network. The Department of Health lists 40 PET units in New South Wales and four in the Australian Capital Territory. New South Wales had 8.67 million residents at March 31, 2026. ANSTO also produces most of the country's medical isotopes at Lucas Heights in southern Sydney.
How do merged radiology groups shape Victoria and Tasmania?
Victoria and Tasmania held a 24.6% share of 2025 value and grow at 6.65% a year, as merged networks expand MRI and PET capacity. Before their merger, Integral Diagnostics ran 21 clinics in Victoria and Capitol Health ran 46, according to the ACCC. Victoria added population at 1.6% in the year to March 2026, while Tasmania grew 0.6%. Tasmania also faces a projected 2025 radiologist gap equal to 27.2% of supply, which increases reliance on remote reporting.
Why does Queensland grow fastest to 2035?
Queensland held a 19.0% share of 2025 value and grows fastest at 7.30% a year, as heavy respiratory seasons meet strong PET capacity. Queensland Health recorded 99,984 influenza notifications in 2025, its highest since influenza became notifiable in 2001. The Department of Health lists 34 PET units in the state, and Queensland X-Ray lodged the national application for funded FDG PET in infection. Queensland's population also grew 1.6% in the year to March 2026.
What adds demand in the west, south and north?
Western Australia, South Australia and Northern Territory held a 22.7% share of 2025 value and grow at 7.15% a year. Western Australia recorded the fastest state population growth at 2.1% in the year to March 2026. The region has 18 listed PET units, including 11 in Western Australia. Benson Radiology runs 32 clinics in South Australia, while Jones Radiology runs 28 clinics from South Australia to Alice Springs.
Funding reforms, mergers and PET reviews, 2024–2026
| Development | Status and market relevance |
|---|---|
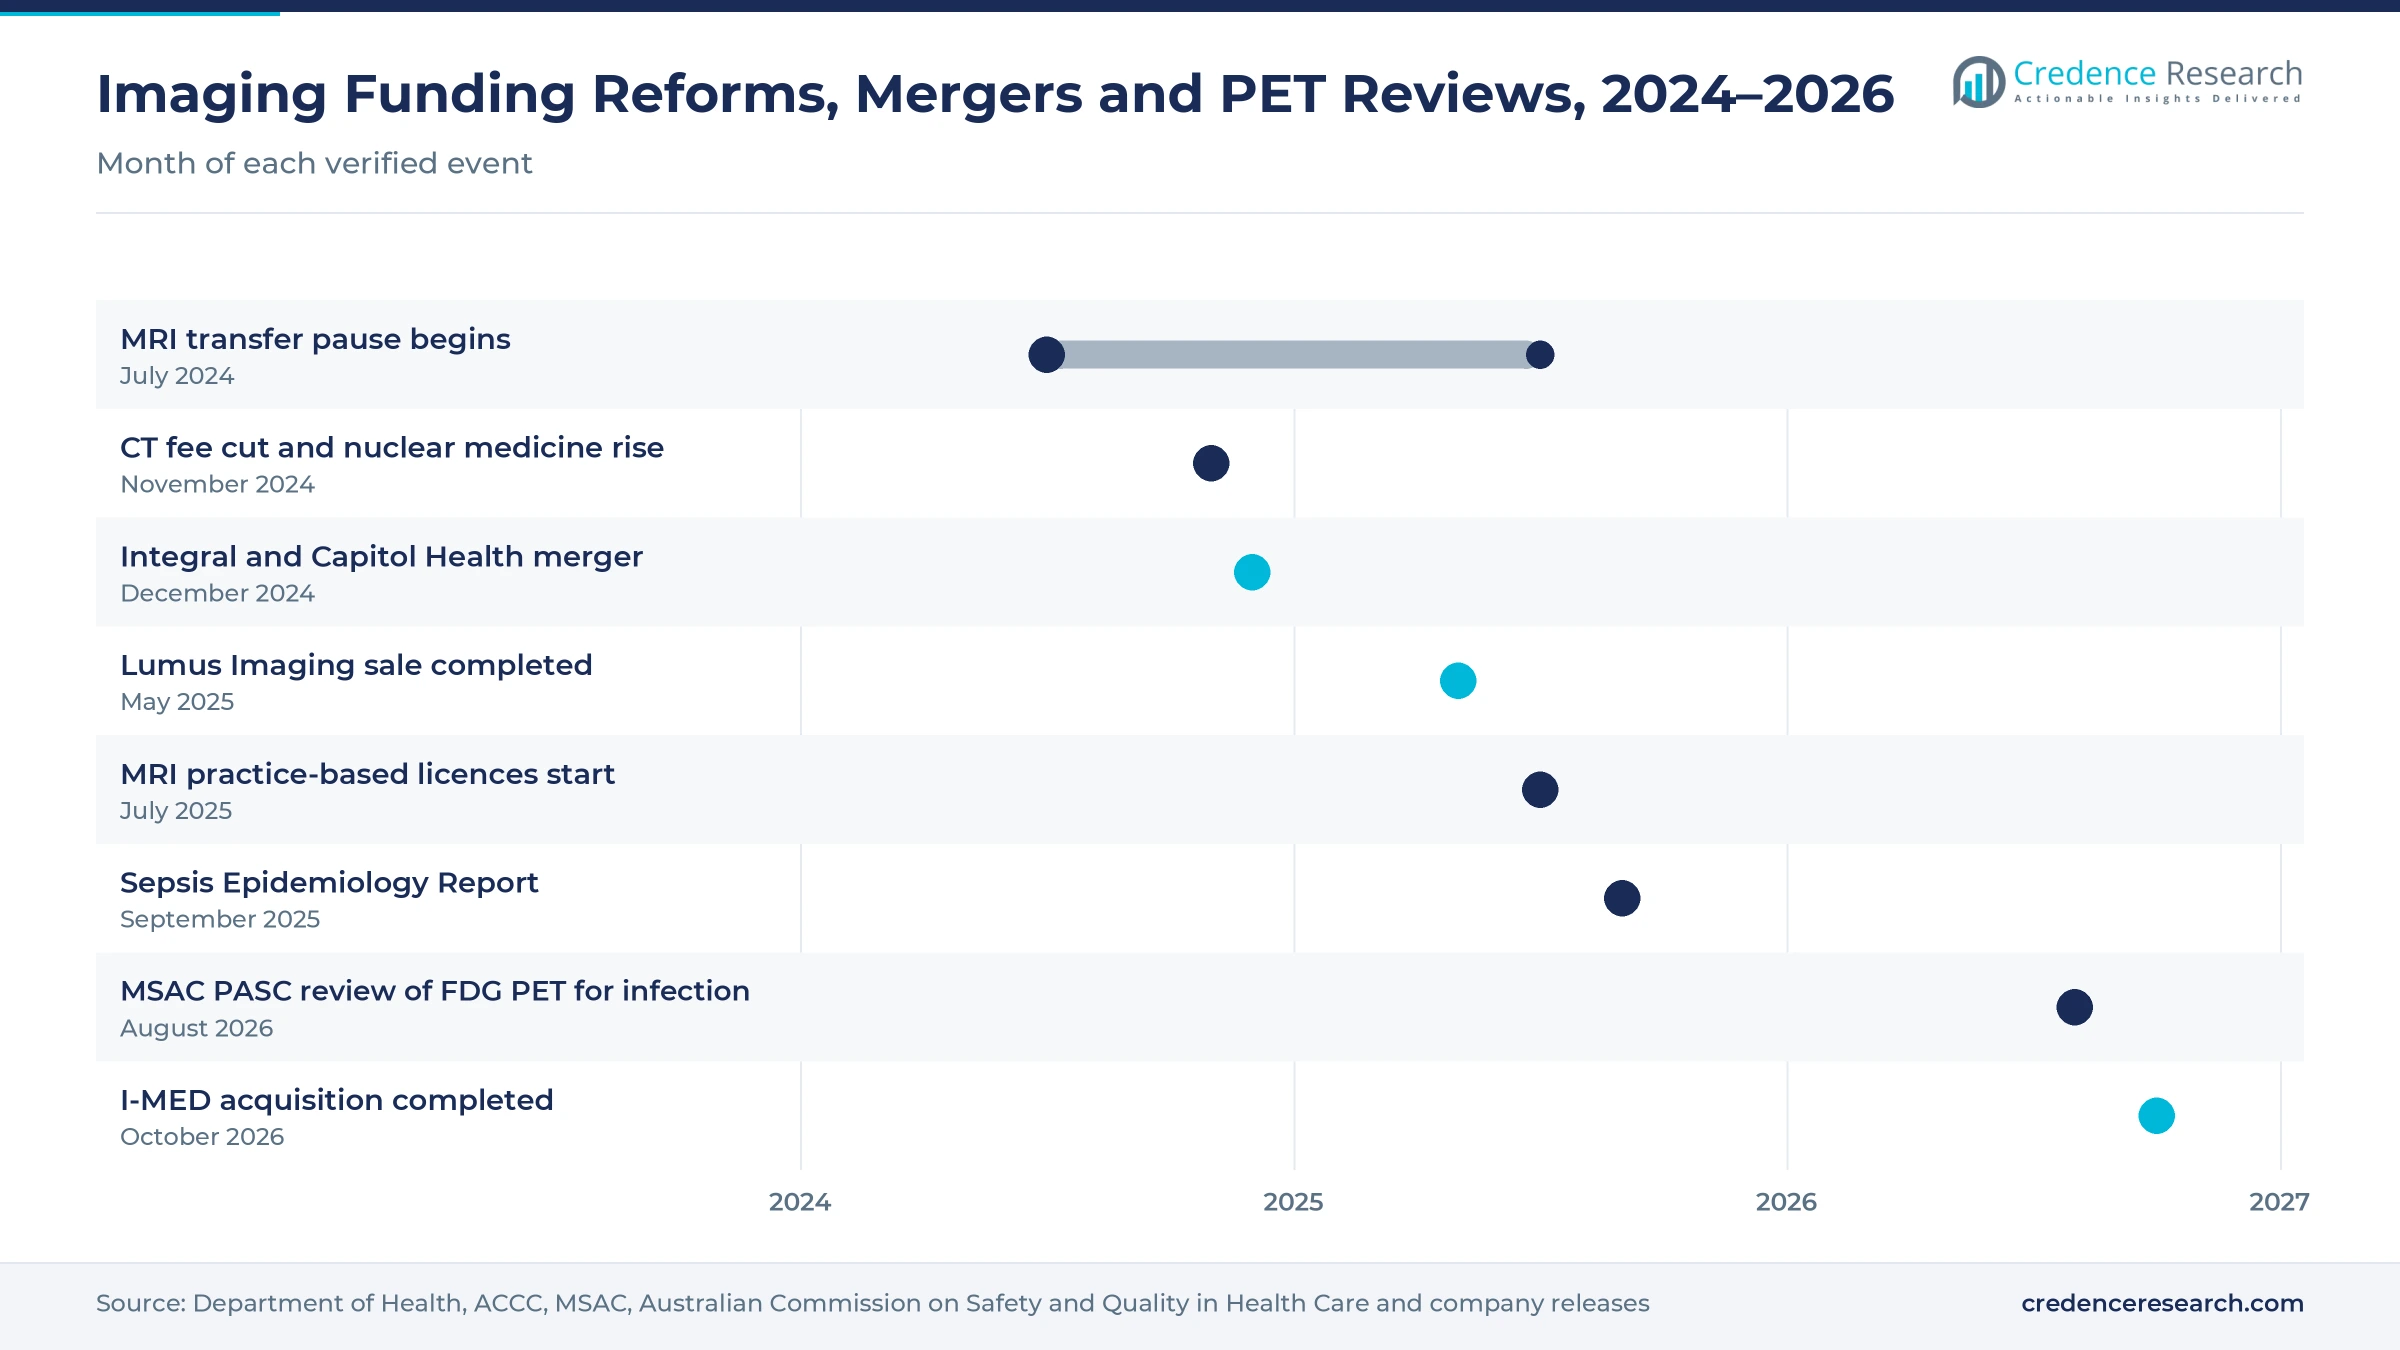
| In July 2024, the Department of Health paused most non-essential transfers of Medicare-eligible MRI units ahead of the move to practice-based licences. | Prepared the ground for wider funded MRI access |
| In November 2024, the schedule fee for all CT services fell by 2%, while non-PET nuclear medicine fees rose by a one-off 3.5%. | Shifted the economics between CT and nuclear medicine |
| In December 2024, Integral Diagnostics completed its merger with Capitol Health after ACCC clearance with a divestment undertaking. | Created a larger network in Victoria and Western Australia |
| In July 2025, MRI units at licensed comprehensive practices in metropolitan areas gained full Medicare eligibility. | Widened funded MRI for spinal and bone infection workups |
| In August 2026, application 1822 on FDG PET for complex infection went to the PASC meeting of the Medical Services Advisory Committee. | Opens a path to Medicare funding for infection PET |
CT, MRI and hybrid scans split the diagnostic workload
- Computed tomography remains the first scan for suspected pneumonia complications, abscesses and spinal infection in emergency departments.
- Magnetic resonance imaging is the standard comparator for musculoskeletal infection named in the MSAC application, and wider Medicare eligibility now brings it closer to patients.
- Functional radionuclide imaging uses gallium or labeled white cells to find inflammation when anatomy looks normal, and clinicians read results alongside in vitro diagnostics such as blood cultures.
- Hybrid imaging joins PET or SPECT with CT, which helps locate infection in fever of unknown origin, endocarditis and prosthetic joints.
Need a Custom Version of This Report?
Tailor the scope, geography, or segments to your exact requirements.
- Custom geography or segment scope
- Direct access to our analyst team
Large radiology networks and doctor-led practices compete
Competition in Australian infection imaging splits between national radiology networks and doctor-led regional practices that hold strong hospital relationships. I-MED Radiology Network runs 215 clinics and was acquired by Jardine Matheson in October 2026. Sonic Healthcare operates radiology brands including Queensland X-Ray, which offers PET-CT and lodged the national application to fund FDG PET in infection. Integral Diagnostics widened its Victorian and Western Australian footprint through the Capitol Health merger, and Lumus Imaging runs about 150 sites. Qscan Group operates more than 40 clinics with PET-CT, including an Adelaide site opened in February 2021. Benson Radiology, Jones Radiology and Radiology SA run PET services in South Australia, while Perth Radiological Clinic runs PET at five Western Australian sites. Rivals compete on PET and wide-bore MRI access, subspecialty reporting speed and hospital contracts.
Which radiology groups lead infection scans in Australia?
| Company | Type | Role in the market |
|---|---|---|
| I-MED Radiology Network | National radiology network | 215 clinics and about seven million procedures a year; acquired by Jardine Matheson in October 2026 |
| Sonic Healthcare Australia Radiology | National radiology network | Queensland X-Ray offers PET-CT and lodged MSAC application 1822 on FDG PET for infection |
| Integral Diagnostics | National radiology network | Merged with Capitol Health in December 2024, adding clinics in Victoria and Western Australia |
| Lumus Imaging | National radiology network | About 150 sites; sold by Healius to Affinity Equity Partners in 2025 |
| Qscan Group | Multi-state radiology provider | More than 40 clinics with CT, MRI, PET-CT and nuclear medicine |
| Benson Radiology | Regional radiology practice | 32 South Australian clinics with 13 wide-bore MRI units and six nuclear medicine sites |
| Perth Radiological Clinic | Regional radiology practice | PET services at five Western Australian sites |
| Jones Radiology | Regional radiology practice | 28 clinics in South Australia and Alice Springs, with PET at SAHMRI and Tennyson |
| Radiology SA | Regional radiology practice | PET unit at Calvary Central Districts Hospital in Adelaide |
Credence Research view on scans for suspected infection
Credence Research's view is that the Australia infection imaging market will grow steadily, because sepsis, respiratory seasons and device infections keep raising the number of patients who need scans. CT will keep the largest share as the first test, while nuclear medicine and hybrid scans add the fastest growth as clinicians look for hidden infection. Wider Medicare MRI eligibility moves more work into community clinics. A positive funding decision on FDG PET for infection would be the single largest upside, while radiologist shortages and CT fee pressure will limit how quickly capacity expands.
How the infection scan estimate was built
The report uses 2025 as the base year on a calendar basis, and market values come from the Credence Research model. That model combines infection hospitalization data, Medicare funding rules, PET unit counts, population statistics and provider announcements. Segment splits and regional growth rates are Credence Research estimates, while regional shares follow the split defined for this report. Sources used are government agencies, health regulators, official statistics, international agency data and company publications, and no interviews or surveys were used.
Hybrid scans and wider MRI access carry growth to 2035
Australian infection imaging spending is expected to reach USD 736.7 million by 2035, a 6.87% CAGR during 2026–2035, as hospitals manage more sepsis and respiratory admissions and as funded MRI spreads to more clinics. Queensland should grow fastest, while New South Wales and the Australian Capital Territory keep the largest share. Hybrid PET and SPECT scans will take a larger role in fever, spine and prosthesis cases, especially if Medicare funds FDG PET for infection. Providers that combine PET capacity, wide-bore MRI and fast subspecialty reporting should win the most work.
Frequently Asked Questions
How big is the Australia infection imaging market?
Which service type leads infection imaging in Australia?
Which region leads infection imaging spending?
How does sepsis affect demand for infection scans?
How do Medicare MRI reforms affect this market?
Is FDG PET funded for infection in Australia?
Which companies lead infection imaging in Australia?
What are the main challenges for this market?
Table of Content
Chapter 1 Market Segmentation
- 1.1 Segmentation Framework
- 1.1.1 Product and Service Classification
- 1.1.2 Application and End-Use Classification
- 1.1.3 Technology and Solution Classification
- 1.1.4 Customer and Distribution Channel Classification
- 1.1.5 Geographic Segmentation
- 1.1.6 Market Segment Definitions and Boundaries
- 1.2 By Service Type
- 1.2.1 Computed tomography
- 1.2.2 Radiography and ultrasound
- 1.2.3 Magnetic resonance imaging
- 1.2.4 Nuclear medicine
- 1.3 By Care Setting
- 1.3.1 Hospital inpatient
- 1.3.2 Hospital outpatient
- 1.3.3 Community imaging
- 1.4 By Disease Area
- 1.4.1 Thoracic infections
- 1.4.2 Bone, joint and soft-tissue infections
- 1.4.3 Systemic and abdominal infections
- 1.4.4 Cardiovascular infections
- 1.5 By Technology
- 1.5.1 Anatomical imaging
- 1.5.2 Hybrid imaging
- 1.5.3 Functional radionuclide imaging
Chapter 2 Introduction
- 2.1 Report Objectives and Scope
- 2.2 Product Definition and Industry Terminology
- 2.3 Market Inclusions and Exclusions
- 2.4 Research Process
- 2.4.1 Primary Research and Expert Interviews
- 2.4.2 Secondary Research and Source Review
- 2.4.3 Top-Down and Bottom-Up Estimation
- 2.4.4 Data Triangulation and Verification
- 2.5 Market Size Measurement Basis
- 2.5.1 2025: USD 372.5 million → 2035: USD 736.7 million
- 2.6 Historical and Forecast Reference Periods
- 2.6.1 Historical Period: 2018-2025
- 2.6.2 Base Year: 2025
- 2.6.3 Forecast Period: 2025-2035
- 2.7 Research Assumptions and Limitations
Chapter 3 Executive Summary
- 3.1 Market Snapshot and Key Findings
- 3.2 Base-Year Market Size, 2025
- 3.3 Forecast Market Size, 2035
- 3.4 Revenue and Volume Growth Outlook
- 3.5 Key Demand and Supply Indicators
- 3.6 Leading Market Segments
- 3.7 Fastest-Growing Market Opportunities
- 3.8 Regional Performance Highlights
- 3.9 Technology and Industry Transformation
- 3.10 Competitive Landscape Summary
- 3.11 Analyst View and Strategic Implications
Chapter 4 Australia Infection Imaging Market Trends and Developments
- 4.1 Historical Industry Development, 2018-2025
- 4.2 Recent Market Trends and Developments
- 4.3 Demand and Customer Behavior Trends
- 4.4 Technology and Product Innovation
- 4.5 Artificial Intelligence, Automation and Digitalization
- 4.6 Local Manufacturing and Supply Chain Realignment
- 4.7 Industry Partnerships, Mergers and Acquisitions
- 4.8 Sustainability and Circular Economy Developments
- 4.9 Government and Private Sector Investment Trends
- 4.10 Emerging Business Models and Commercialization
- 4.11 Industry Developments and Announcements
Chapter 5 Australia Infection Imaging Market Production, Supply and Demand Analysis
- 5.1 Demand Trend and Consumption Analysis, 2018-2025
- 5.2 Demand Forecast, 2025-2035
- 5.3 Production and Output Trend, 2018-2025
- 5.4 Production and Output Forecast, 2025-2035
- 5.5 Installed Capacity and Capacity Utilization
- 5.6 Company-Wise Production Plants and Statistics
- 5.6.1 Installed Production Capacity
- 5.6.2 Actual Production
- 5.6.3 Planned Capacity and Expansion Targets
- 5.7 Supply Chain Structure and Procurement Trends
- 5.8 Supply-Demand Gap and Bottlenecks
- 5.9 Import Dependence and Sourcing Structure
- 5.10 Contract Manufacturing and Outsourcing
- 5.11 Regional Supply and Demand Concentration
Chapter 6 Australia Infection Imaging Market Pricing Analysis
- 6.1 Pricing Structure and Measurement
- 6.2 Historical Pricing Trends, 2018-2025
- 6.3 Pricing Outlook, 2025-2035
- 6.4 Average Selling Price and Unit Economics
- 6.5 Pricing by Product and Market Segment
- 6.6 Geographic Pricing Differences
- 6.7 Key Input, Energy, Labor and Logistics Costs
- 6.8 Contract Pricing and Purchasing Models
- 6.9 Pricing Sensitivity and Competitive Positioning
- 6.10 Price, Margin and Profitability Implications
Chapter 7 Australia Infection Imaging Market Dynamics
- 7.1 Market Growth Drivers
- 7.1.1 Demand-Side Drivers
- 7.1.2 Technology and Innovation Drivers
- 7.1.3 Infrastructure and Investment Drivers
- 7.1.4 Regulatory and Policy Drivers
- 7.2 Market Restraints
- 7.2.1 Cost and Affordability Constraints
- 7.2.2 Technology and Adoption Barriers
- 7.2.3 Supply Chain and Operational Constraints
- 7.3 Market Challenges
- 7.3.1 Competitive Pressure and Margin Erosion
- 7.3.2 Skills, Infrastructure and Implementation Gaps
- 7.4 Emerging Market Opportunities
- 7.5 Market Dynamics Impact and Time-Horizon Assessment
Chapter 8 Australia Infection Imaging Value Chain Analysis
- 8.1 Industry Value Chain Overview
- 8.2 Upstream Suppliers and Critical Inputs
- 8.3 Technology and Component Providers
- 8.4 Manufacturing or Service Delivery
- 8.5 Distribution, Channel Partners and Integrators
- 8.6 Downstream Applications and End Users
- 8.7 Value Addition and Profit Pools
- 8.8 Vertical Integration and Outsourcing
- 8.9 Supplier Concentration and Risk
- 8.10 Supply Chain Localization and Resilience
Chapter 9 Australia Infection Imaging Market Regulations and Policies
- 9.1 Relevant Laws, Standards and Compliance Frameworks
- 9.2 Product, Service, Safety and Quality Requirements
- 9.3 Government Policies, Incentives and Subsidies
- 9.4 Imports, Exports and Trade Barriers
- 9.5 Public Procurement and Local Content Requirements
- 9.6 Environmental and Sustainability Compliance
- 9.7 Upcoming Policy Changes and Market Implications
Chapter 10 Australia Infection Imaging Market Hotspots and Opportunities
- 10.1 Market Opportunity Mapping and Growth Hotspots
- 10.2 High-Growth Applications and Customer Groups
- 10.3 Underserved Markets and White-Space Opportunities
- 10.4 Emerging Technology and Product Opportunities
- 10.5 New Capacity and Investment Hotspots
- 10.6 Market Entry and Expansion Opportunities
- 10.7 Distribution and Partnership Opportunities
- 10.8 Near-Term and Long-Term Commercial Potential
- 10.9 Opportunity Attractiveness and Execution Risks
Chapter 11 Australia Infection Imaging Market Outlook, 2025-2035
- 11.1 Market Size and Analysis
- 11.1.1 Revenue (Market Measurement: 2025: USD 372.5 million → 2035: USD 736.7 million)
- 11.1.2 Market Volume and Quantity Sold
- 11.1.3 Historical Market Size, 2018-2025
- 11.1.4 Base-Year Market Size, 2025
- 11.2 Market Forecast, 2025-2035
- 11.2.1 Revenue Forecast to 2035
- 11.2.2 Volume Forecast to 2035
- 11.2.3 CAGR and Year-on-Year Growth
- 11.2.4 Incremental Revenue Opportunity
- 11.3 Forecast Assumptions and Scenario Analysis
- 11.3.1 Base-Case Forecast
- 11.3.2 Optimistic and Conservative Scenarios
- 11.3.3 Technology, Pricing and Policy Sensitivities
- 11.4 Market Attractiveness and Growth Outlook
Chapter 12 Australia Infection Imaging Market Segmentation and Outlook
- 12.1 Segmentation Summary and Market Shares, 2025
- 12.2 Largest and Fastest-Growing Segments
- 12.3 By Service Type - Market Size and Forecast, 2025-2035
- 12.3.1 Segment Definition and Scope
- 12.3.2 Historical Market Size, 2018-2025
- 12.3.3 Revenue Forecast, 2025-2035
- 12.3.4 Volume Forecast, 2025-2035
- 12.3.5 Base-Year Market Share, 2025
- 12.3.6 Segment CAGR and Growth Drivers
- 12.3.7 Subsegment Market Size and Forecast
- 12.3.7.1 Computed tomography
- 12.3.7.2 Radiography and ultrasound
- 12.3.7.3 Magnetic resonance imaging
- 12.3.7.4 Nuclear medicine
- 12.3.8 Subsegment Pricing and Adoption Trends
- 12.3.9 Leading Suppliers and Competition
- 12.3.10 Regional Demand and Opportunities
- 12.4 By Care Setting - Market Size and Forecast, 2025-2035
- 12.4.1 Segment Definition and Scope
- 12.4.2 Historical Market Size, 2018-2025
- 12.4.3 Revenue Forecast, 2025-2035
- 12.4.4 Volume Forecast, 2025-2035
- 12.4.5 Base-Year Market Share, 2025
- 12.4.6 Segment CAGR and Growth Drivers
- 12.4.7 Subsegment Market Size and Forecast
- 12.4.7.1 Hospital inpatient
- 12.4.7.2 Hospital outpatient
- 12.4.7.3 Community imaging
- 12.4.8 Subsegment Pricing and Adoption Trends
- 12.4.9 Leading Suppliers and Competition
- 12.4.10 Regional Demand and Opportunities
- 12.5 By Disease Area - Market Size and Forecast, 2025-2035
- 12.5.1 Segment Definition and Scope
- 12.5.2 Historical Market Size, 2018-2025
- 12.5.3 Revenue Forecast, 2025-2035
- 12.5.4 Volume Forecast, 2025-2035
- 12.5.5 Base-Year Market Share, 2025
- 12.5.6 Segment CAGR and Growth Drivers
- 12.5.7 Subsegment Market Size and Forecast
- 12.5.7.1 Thoracic infections
- 12.5.7.2 Bone, joint and soft-tissue infections
- 12.5.7.3 Systemic and abdominal infections
- 12.5.7.4 Cardiovascular infections
- 12.5.8 Subsegment Pricing and Adoption Trends
- 12.5.9 Leading Suppliers and Competition
- 12.5.10 Regional Demand and Opportunities
- 12.6 By Technology - Market Size and Forecast, 2025-2035
- 12.6.1 Segment Definition and Scope
- 12.6.2 Historical Market Size, 2018-2025
- 12.6.3 Revenue Forecast, 2025-2035
- 12.6.4 Volume Forecast, 2025-2035
- 12.6.5 Base-Year Market Share, 2025
- 12.6.6 Segment CAGR and Growth Drivers
- 12.6.7 Subsegment Market Size and Forecast
- 12.6.7.1 Anatomical imaging
- 12.6.7.2 Hybrid imaging
- 12.6.7.3 Functional radionuclide imaging
- 12.6.8 Subsegment Pricing and Adoption Trends
- 12.6.9 Leading Suppliers and Competition
- 12.6.10 Regional Demand and Opportunities
- 12.7 Segment Growth Comparison
- 12.8 Segment Attractiveness and Priority Matrix
Chapter 13 Australia Infection Imaging Geographic Market Outlook, 2025-2035
- 13.1 Domestic Market Distribution and Demand Clusters
- 13.2 State- or Province-Wise Market Size and Forecast, 2025-2035
- 13.3 City and Metropolitan Market Outlook
- 13.4 Industrial, Manufacturing and Commercial Clusters
- 13.5 Geographic Concentration of Key End Users
- 13.6 Local Pricing and Purchasing Differences
- 13.7 Domestic Production Facilities and Capacity Map
- 13.8 Local Infrastructure and Project Pipeline
- 13.9 State-Level Policy and Incentive Differences
- 13.10 Subnational Investment Hotspots and Opportunities
- 13.11 Distribution and Logistics Networks
- 13.12 Domestic Competitive Footprint
Chapter 14 Australia Infection Imaging Technology, Innovation and Sustainability Outlook
- 14.1 Technology Landscape and Maturity
- 14.2 Product, Process and Service Innovation
- 14.3 AI, Automation and Digital Tools in the Industry
- 14.4 Technology Adoption and Performance Benchmarking
- 14.5 Innovation Pipeline and R&D Investment
- 14.6 Patent and Intellectual Property Trends
- 14.7 Energy Efficiency and Resource Management
- 14.8 Sustainability, Recycling and Circularity
- 14.9 Technology Roadmap, 2025-2035
- 14.10 Risks of Obsolescence and Technology Substitution
Chapter 15 Australia Infection Imaging Market Key Strategic Imperatives
- 15.1 Growth and Market Entry Priorities
- 15.2 High-Return Products and Segments
- 15.3 Pricing, Profitability and Cost Optimization
- 15.4 Technology Investment and Product Differentiation
- 15.5 Supply Chain Localization and Resilience
- 15.6 Distribution and Customer Acquisition
- 15.7 Partnership, Acquisition and Capacity Strategy
- 15.8 Regional Expansion Priorities
- 15.9 Short-, Medium- and Long-Term Actions
Chapter 16 Competition Outlook
- 16.1 Industry Competition Characteristics
- 16.2 Market Structure and Concentration
- 16.3 Market Share and Competitive Positioning, 2025
- 16.4 Company-Wise Revenue and Product Benchmarking
- 16.5 Production and Service Capacity Benchmarking
- 16.6 Technology, Pricing and Differentiation
- 16.7 Regional Footprint and Distribution Strength
- 16.8 Mergers, Acquisitions and Strategic Alliances
- 16.9 New Entrants and Competitive Threats
- 16.10 Porter's Five Forces and Industry Attractiveness
- 16.11 Competitive Outlook, 2025-2035
Chapter 17 Company Profiles
- 17.1 Company Coverage and Selection Criteria
- 17.2 I-MED Radiology Network
- 17.2.1 Business Description
- 17.2.2 Company Ownership and Geographic Presence
- 17.2.3 Product and Service Portfolio
- 17.2.4 Manufacturing and Operating Footprint
- 17.2.5 Production Capacity and Expansion Plans
- 17.2.6 Financial Performance and Investment
- 17.2.7 Market Share and Competitive Position
- 17.2.8 Technology and Innovation Capabilities
- 17.2.9 Strategic Alliances or Partnerships
- 17.2.10 Recent Developments
- 17.2.11 Growth Strategy and Outlook
- 17.3 Sonic Healthcare Australia Radiology
- 17.4 Integral Diagnostics
- 17.5 Lumus Imaging
- 17.6 Qscan Group
- 17.7 Benson Radiology
- 17.8 Perth Radiological Clinic
- 17.9 Jones Radiology
- 17.10 Radiology SA
- 17.11 Adelaide MRI
- 17.12 Other Relevant Market Participants
Note: Every listed company is profiled on the structure shown under the first company. The company list is preliminary and may change based on research findings, market developments, data availability and client requirements.
Chapter 18 Disclaimer
- 18.1 Research and Forecast Disclaimer
- 18.2 Data Source and Estimation Limitations
Note: The depth of individual sections depends on data availability for this market. Volume, capacity, trade and other unit-based metrics are included where applicable.

