
Weddings, visitors and new boutiques shape spending
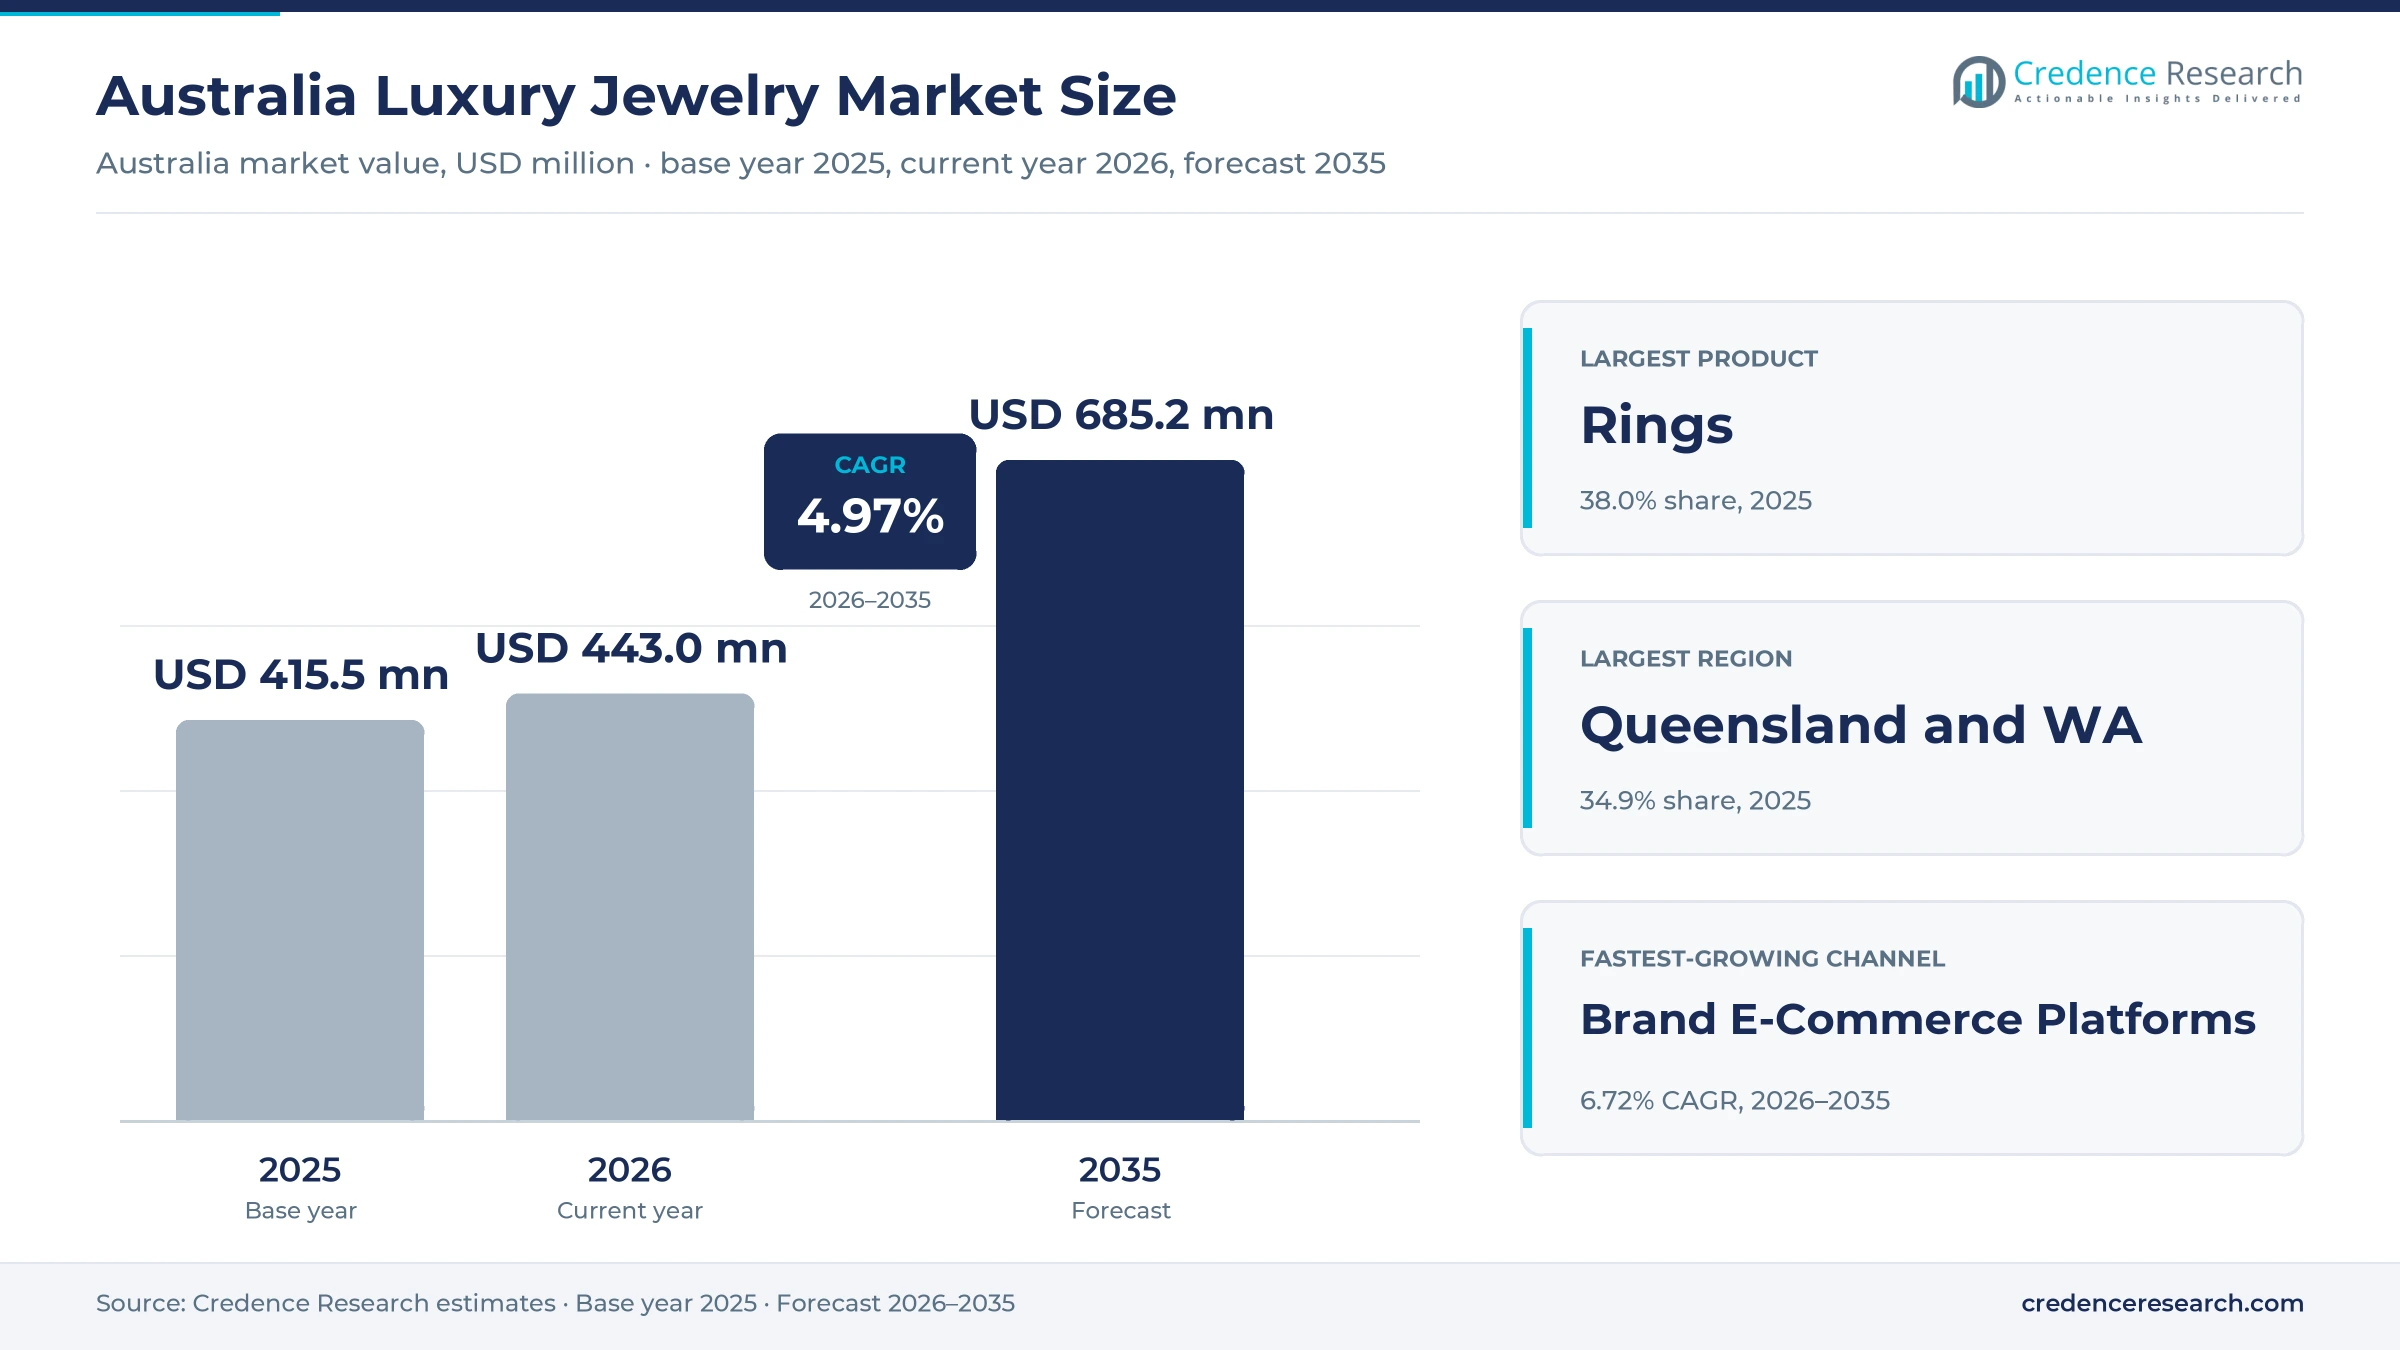
The Australia luxury jewelry market was valued at USD 415.5 million in 2025 and is projected to increase from USD 443.0 million in 2026 to USD 685.2 million by 2035, registering a CAGR of 4.97% during 2026–2035. Demand comes from engaged couples, affluent residents marking milestones, international visitors and corporate buyers who purchase rings, necklaces, earrings and bracelets from international maisons and Australian pearl and diamond houses. Queensland and Western Australia held the largest regional share, 34.9% in 2025, because Brisbane, the Gold Coast and Perth combine wealthy resident buyers with strong visitor flows. The same group is also the fastest-growing region at 5.33% a year, as global brands open their first stores outside Sydney and Melbourne. In turn, store networks are spreading beyond the two largest cities, because Cartier opened its first Western Australian boutique in August 2024 and Paspaley opened its first South Australian boutique in September 2025.
Which pieces, price points and sellers fall inside the scope?
The estimate measures retail spending in Australia on fine rings, necklaces and pendants, earrings, bracelets and brooches made from precious metals, diamonds, colored gemstones and pearls and sold under established luxury names. It covers accessible, premium, high and couture price tiers, whether buyers purchase in mono-brand boutiques, department store concessions, multi-brand retailers or brand websites.
The estimate excludes costume and silver fashion pieces, watches sold without jewelry, secondhand and auction sales, and bullion bought as an investment. The value chain runs from pearl farms, diamond and gold suppliers and workshops through brand distributors and retailers, to resident buyers, international visitors and companies that buy gifts for staff and clients.
Australia Luxury Jewelry Market Insights
- The Australia luxury jewelry market was valued at USD 415.5 million in 2025 and is projected to reach USD 685.2 million by 2035, registering a CAGR of 4.97% during 2026–2035.
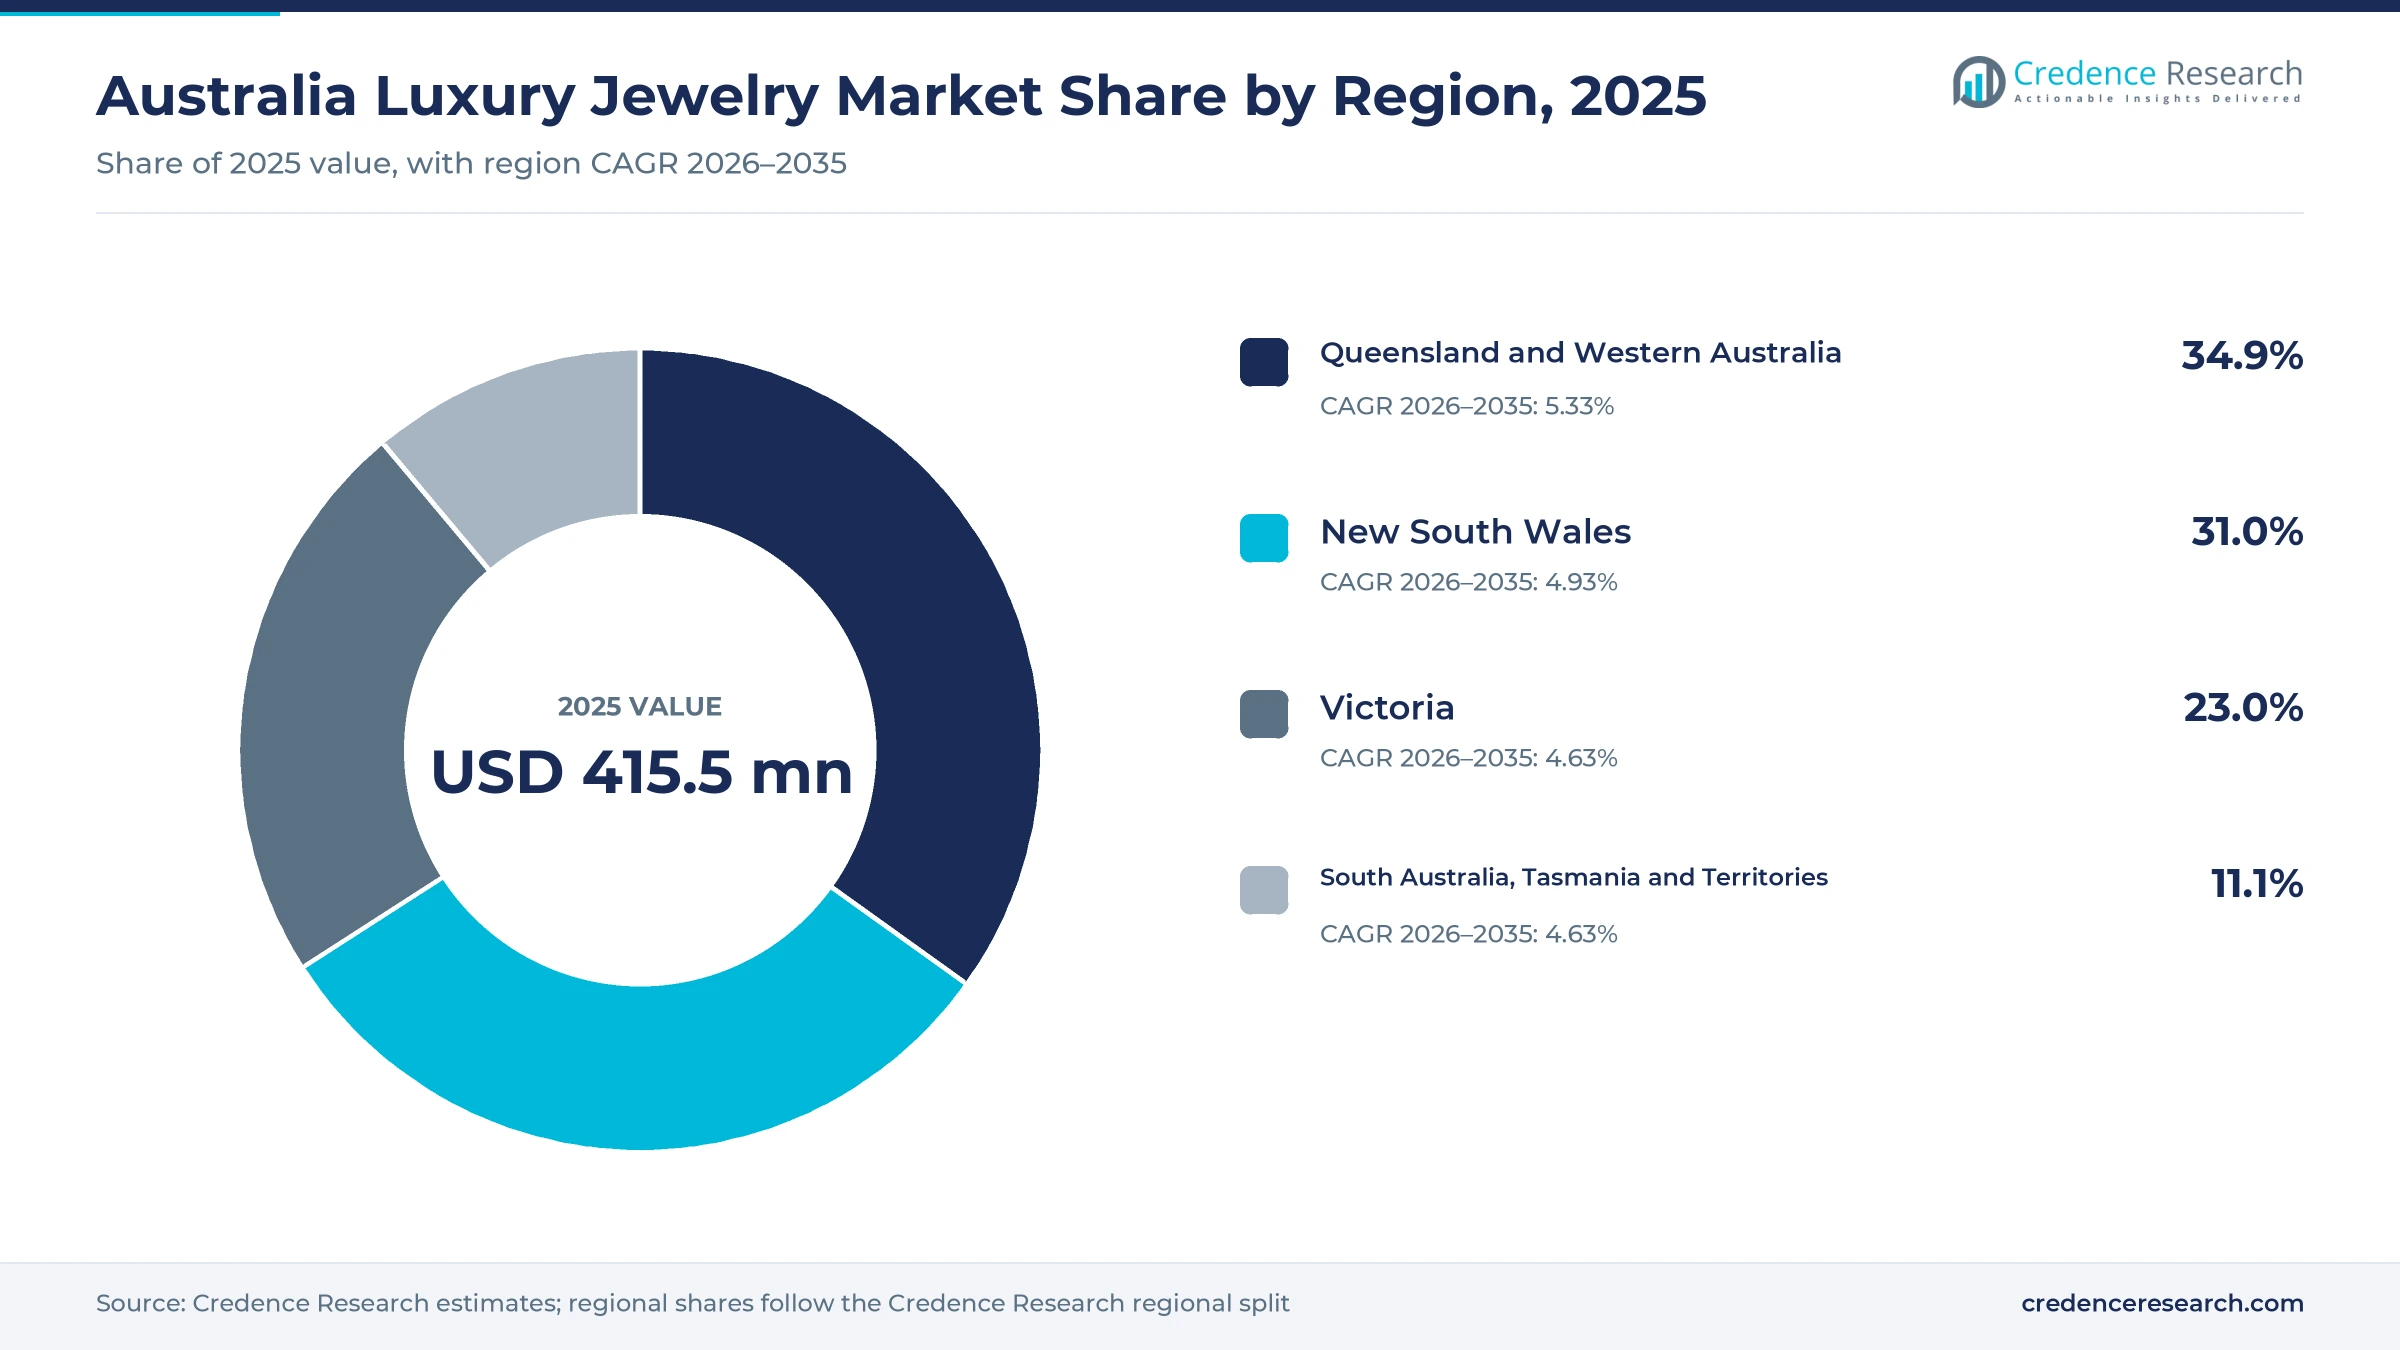
- Queensland and Western Australia held a 34.9% share of 2025 value, supported by Brisbane and Perth boutiques and fast-rising visitor spending in Western Australia.
- Rings led with a 38.0% share of 2025 value, because engagement and wedding rings remain the largest single purchase for most Australian couples.
- Cartier opened a 406-square-meter boutique at Chatswood Chase in May 2026, its seventh store in Australia, with two private salons for high jewelry.
- Brand E-Commerce Platforms grow fastest among channels at 6.72% a year during 2026–2035, as maisons add video consultations and online bridal ranges.
Rings lead while earrings and couture pieces gain ground
Why do rings still hold the largest share?
Based on product category, the market is categorized into Rings, Necklaces and Pendants, Earrings and Bracelets and Brooches. Rings led with a 38.0% share of 2025 value, because engagement, wedding and eternity rings carry the highest average ticket. Earrings grow fastest at 5.44% a year, as buyers add studs, hoops and stacked pieces that suit everyday wear and self-purchase.
How fast are couture pieces gaining value?
Based on price tier, the market is categorized into Accessible Luxury, Premium Luxury, High Luxury and Ultra-Luxury / Couture. Accessible Luxury led with a 41.0% share of 2025 value, because entry collections from the leading maisons sell in large volumes. Ultra-Luxury / Couture grows fastest at 5.82% a year, as private salons in Sydney and Melbourne show high jewelry to resident collectors and visiting clients.
Which occasions bring buyers into boutiques?
Based on purchase occasion, the market is categorized into Wedding and Family Celebrations, Personal Milestones and Self-Purchase, Festive and Relationship Gifting, and Business and Formal Dressing. Wedding and Family Celebrations led with a 37.0% share of 2025 value, because bridal rings bought alongside wedding gowns anchor annual spending. Personal Milestones and Self-Purchase grows fastest at 5.72% a year, as women buy for themselves at milestone birthdays and promotions.
How are brand websites changing the sales mix?
Based on distribution channel, the market is categorized into Mono-Brand Boutiques, Luxury Department Stores, Multi-Brand Designer Retailers and Brand E-Commerce Platforms. Mono-Brand Boutiques led with a 46.0% share of 2025 value, because maisons control pricing, service and private viewings in their own stores. Brand E-Commerce Platforms grow fastest at 6.72% a year, as brands sell bridal ranges online and book video consultations.
| Segment Group | Leading Sub-segment | Share, 2025 | Fastest-growing Sub-segment | CAGR, 2026–2035 |
|---|---|---|---|---|
| By Product Category | Rings | 38.0% | Earrings | 5.44% |
| By Price Tier | Accessible Luxury | 41.0% | Ultra-Luxury / Couture | 5.82% |
| By Purchase Occasion | Wedding and Family Celebrations | 37.0% | Personal Milestones and Self-Purchase | 5.72% |
| By Distribution Channel | Mono-Brand Boutiques | 46.0% | Brand E-Commerce Platforms | 6.72% |
Request a Free Sample
Fill in your details and we'll send you a free sample report.
- Sample data tables & charts
- Research methodology
Bridal demand, boutiques and pearls lift spending
How do steady wedding numbers anchor bridal spending?
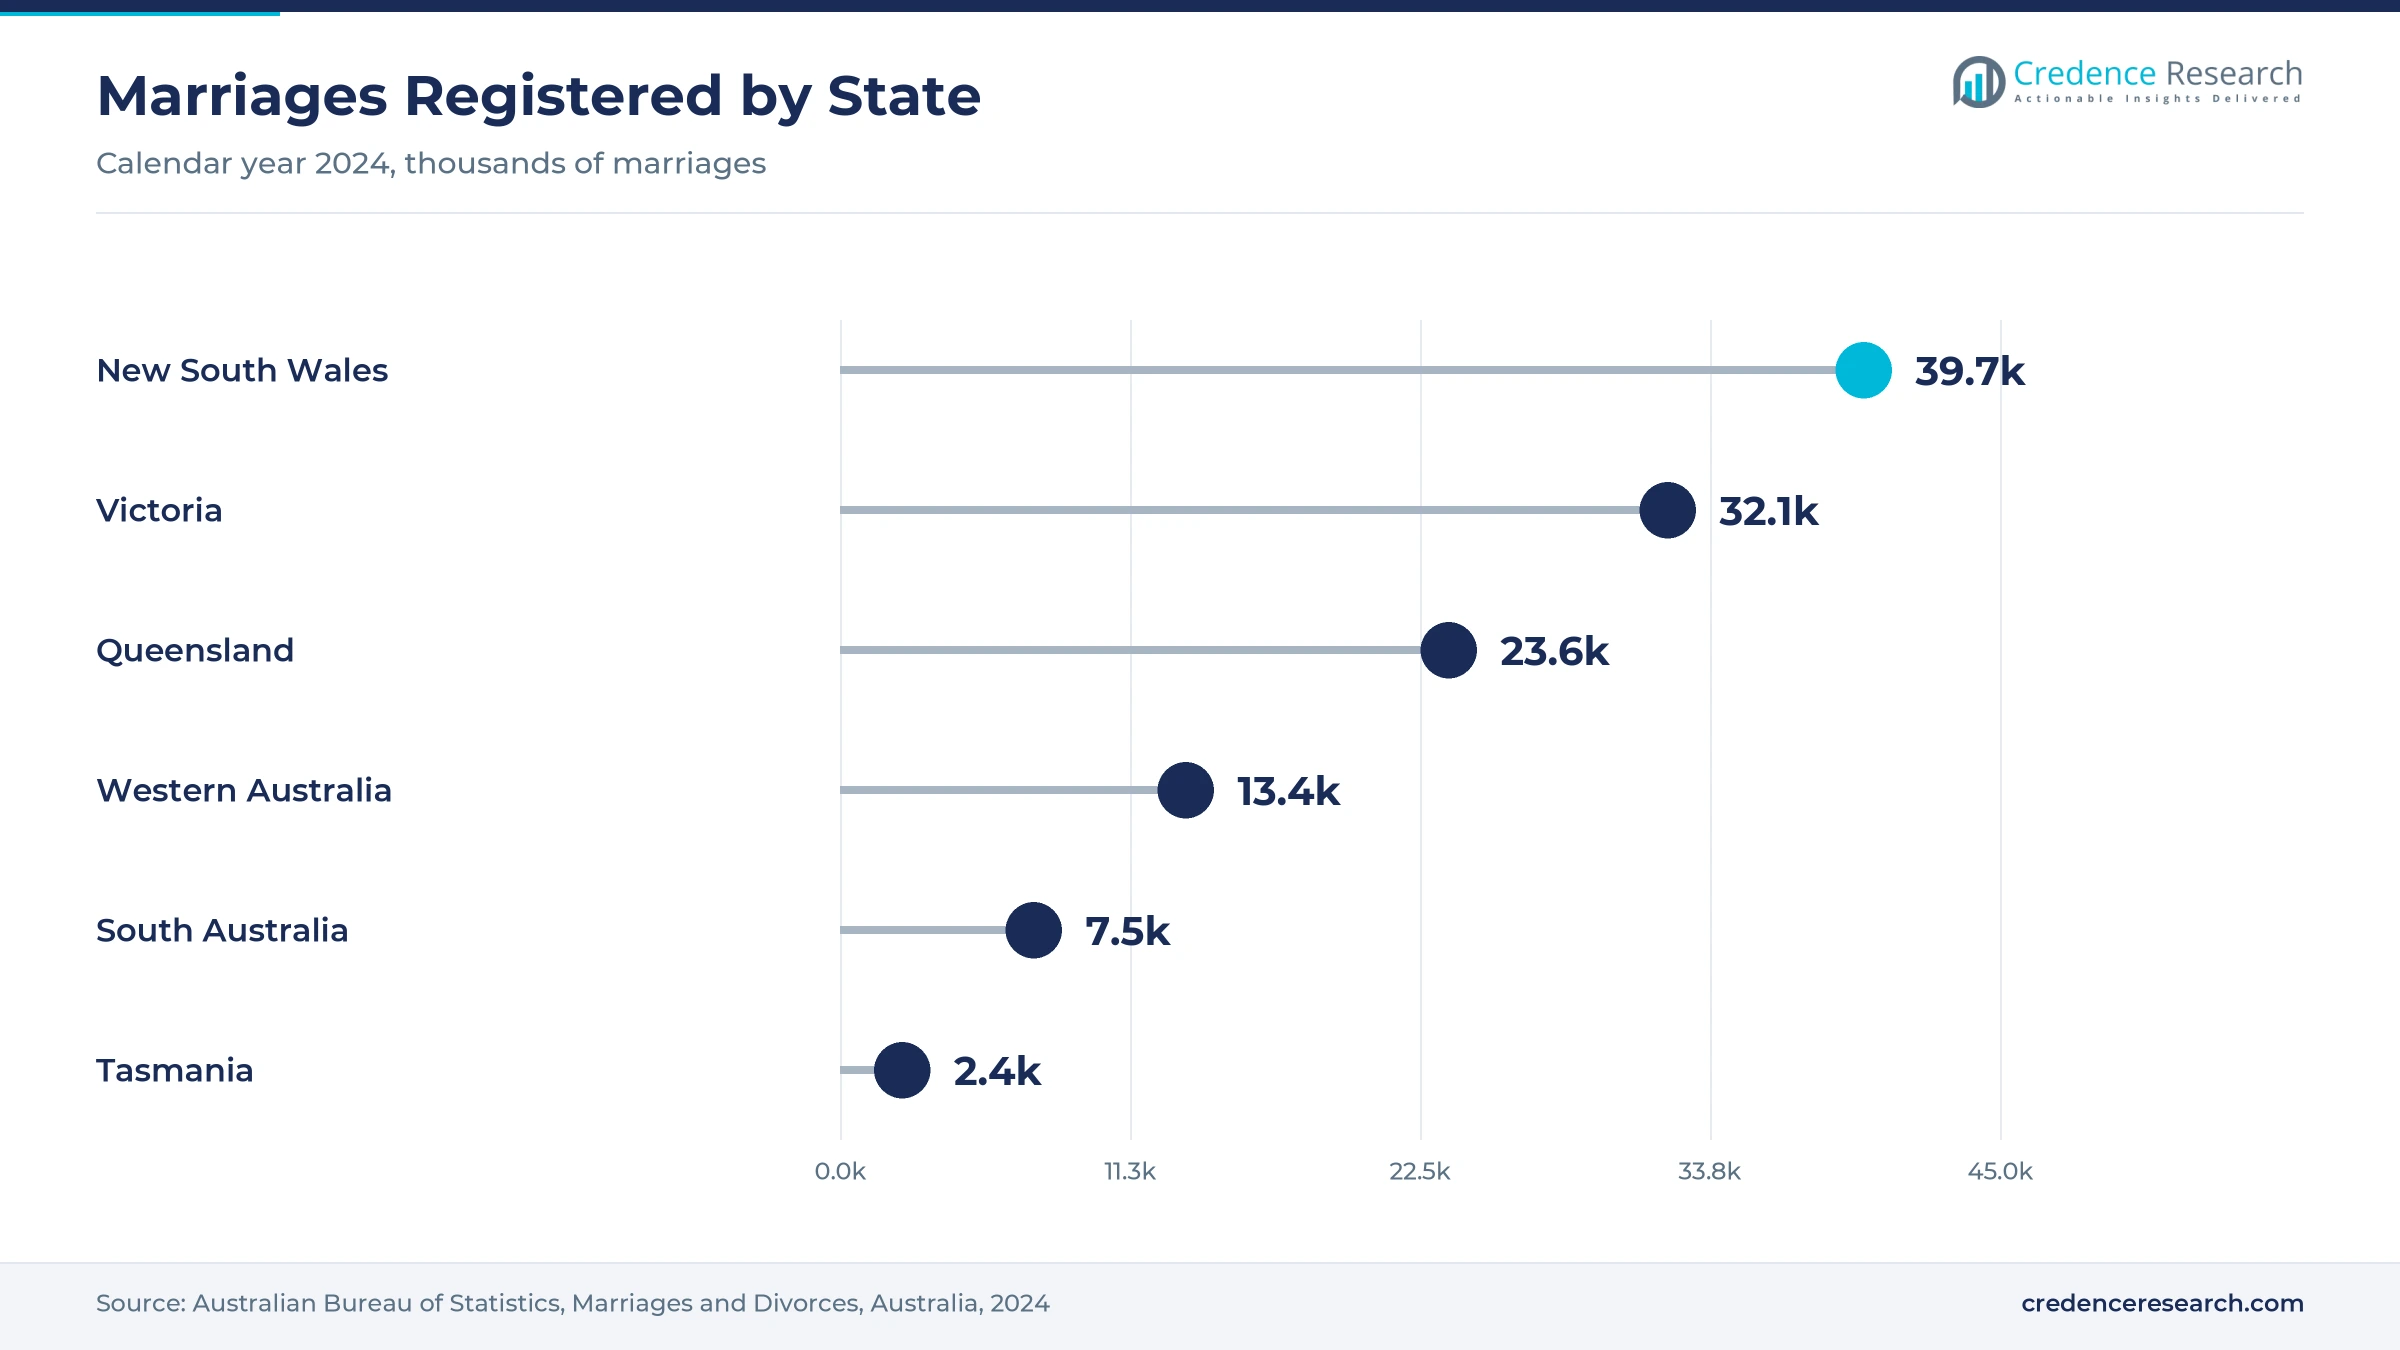
Australia registered 120,844 marriages in 2024, 2.0% more than in 2023, according to the Australian Bureau of Statistics, which keeps engagement rings, wedding bands and family gifts at the center of annual spending. Victoria recorded the largest rise, up 7.5% to 32,050 marriages, while New South Wales registered 39,659. The median age at marriage was 32.8 years for men and 31.2 years for women, which means many buyers have established incomes before they marry. As a result, Wedding and Family Celebrations held 37.0% of 2025 value, and Paspaley added its first bridal space when it opened in Adelaide in September 2025.
Why do new maison boutiques widen the buyer base?
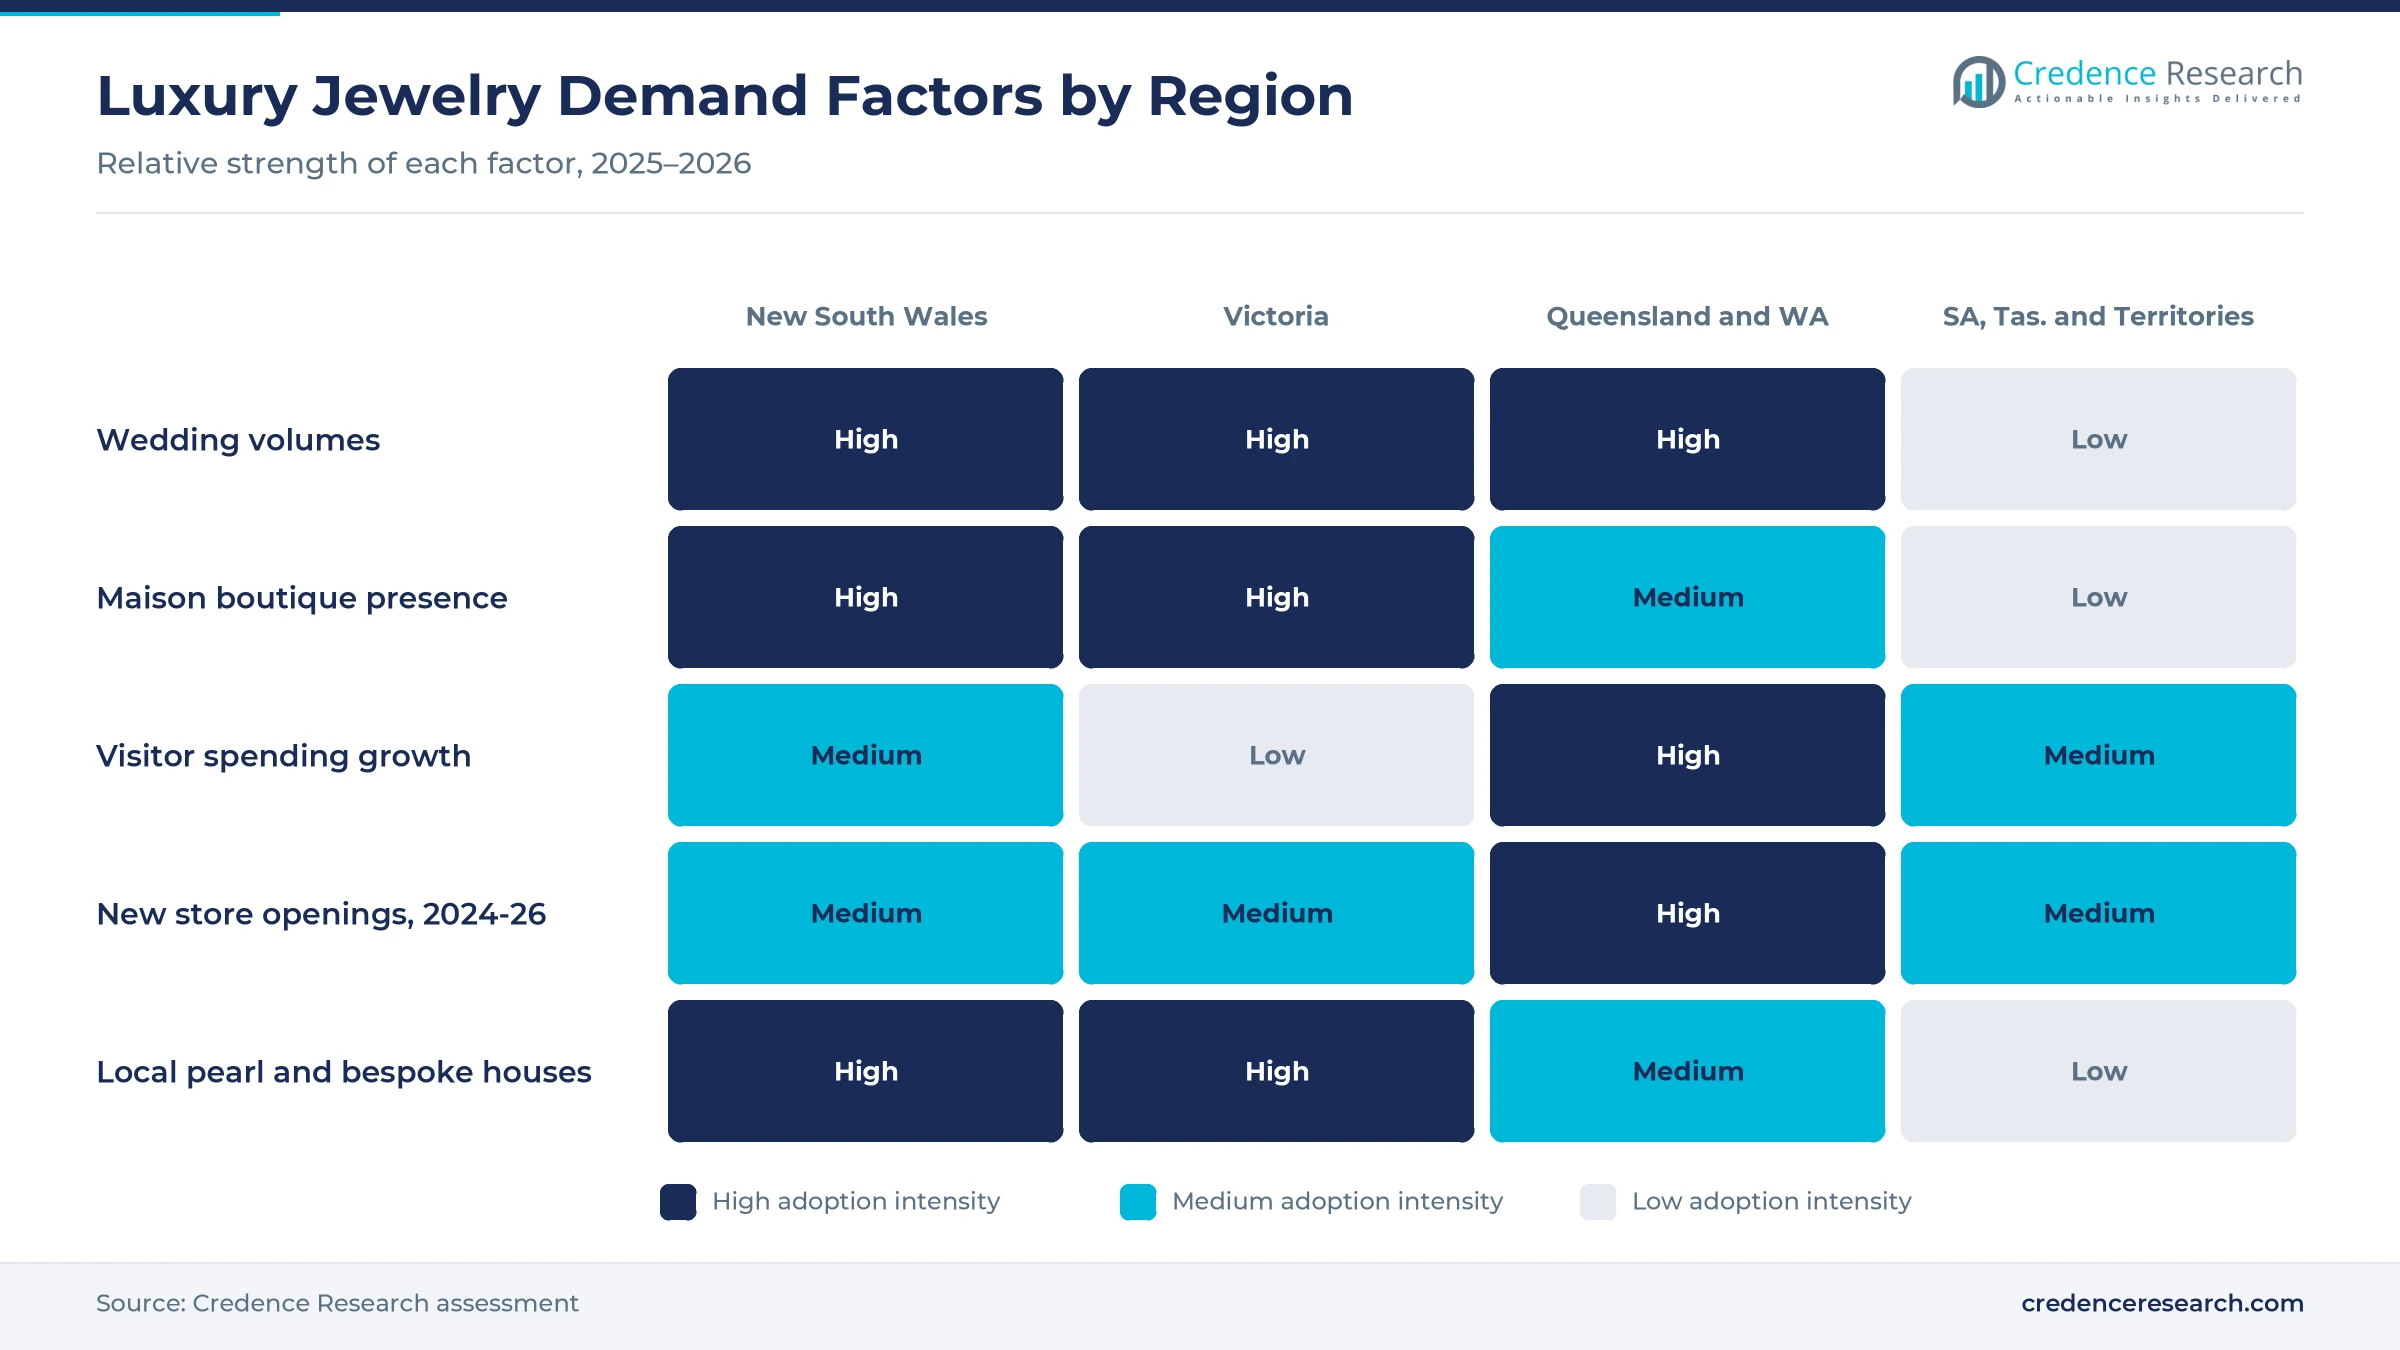
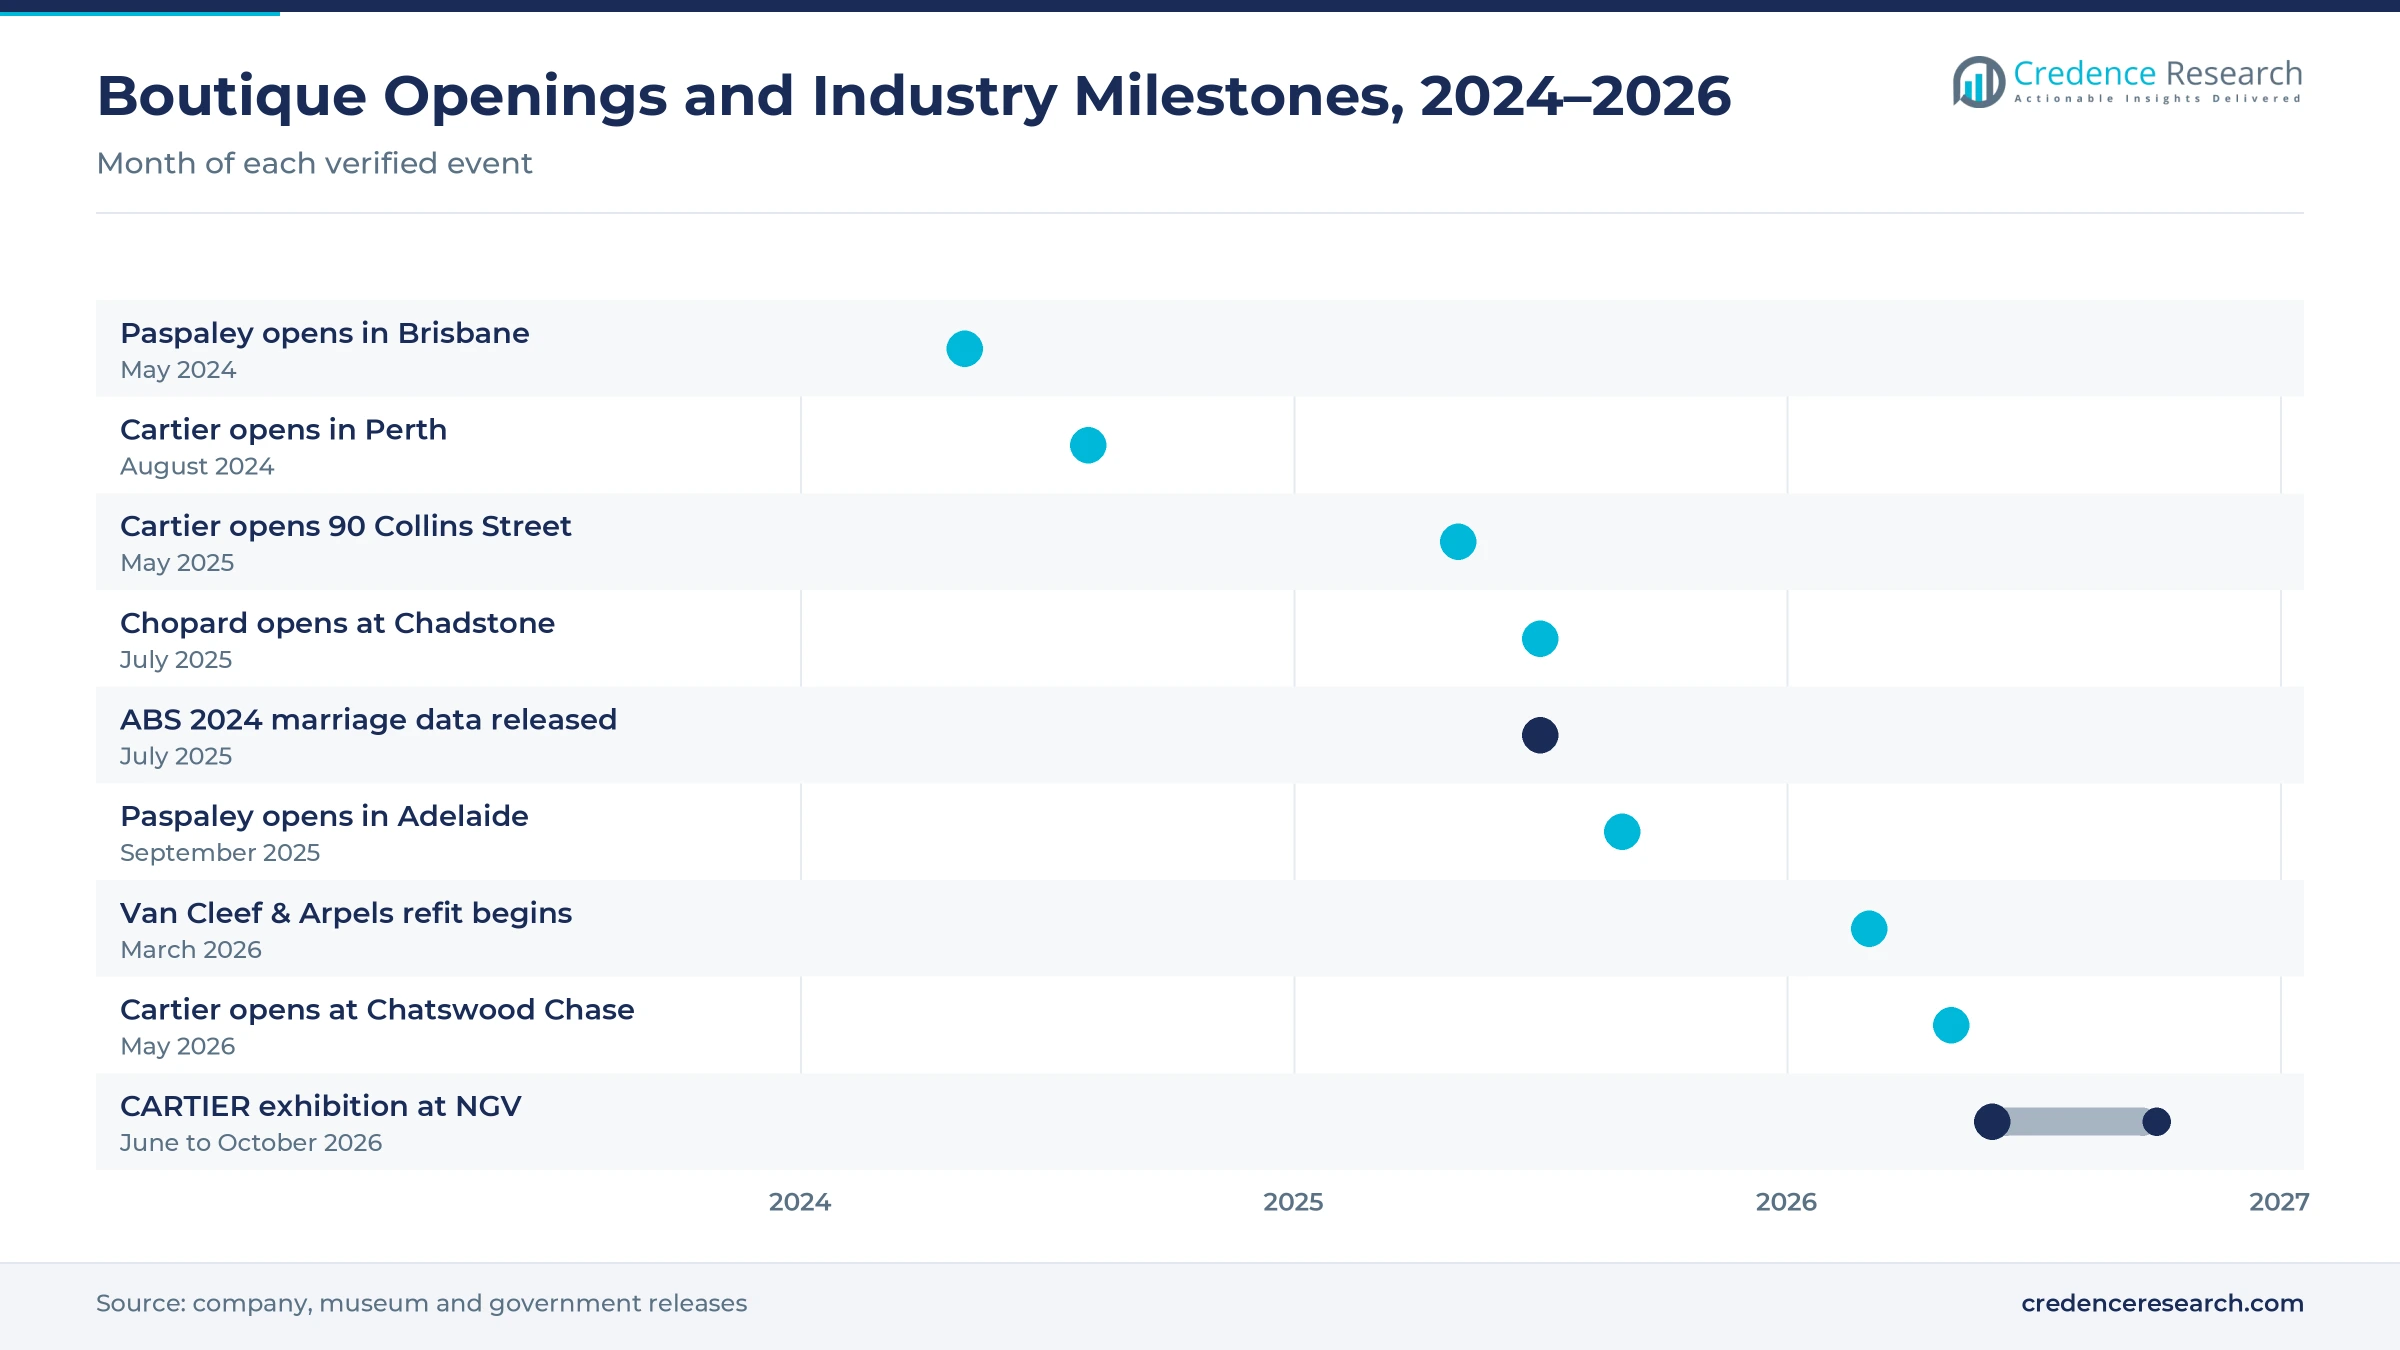
International maisons are adding larger stores in more cities, which brings full collections, bridal salons and private rooms within reach of buyers outside central Sydney. Cartier opened its first Western Australian boutique in Perth in August 2024, a store of about 300 square meters, according to Forbes Australia. It then unveiled a boutique at 90 Collins Street in Melbourne in May 2025, according to The Denizen, and opened a 406-square-meter store at Chatswood Chase in May 2026, its seventh in the country, according to Watch Advice. Chopard also opened a Chadstone boutique in July 2025, which Ragtrader said took the brand to more than 10 points of sale. In turn, Mono-Brand Boutiques held 46.0% of 2025 spending across the country.
How do South Sea pearls and bespoke work set local brands apart?
Australian houses compete with global maisons through traceable South Sea pearls and handmade bespoke pieces, which give buyers a story that imported collections cannot copy. Western Australia has the only significant wild stock pearl oyster fishery in the world, and pearling is the state's second most valuable fishery after rock lobster, according to the state Department of Primary Industries and Regional Development. Paspaley, which describes itself as a master pearler with roots in the Kimberley over more than 90 years, sells these pearls through its own boutiques. Cerrone says it runs Australia's largest bespoke handmade workshop, with more than 30 master jewelers. As a result, Ultra-Luxury / Couture grows fastest at 5.82% a year during 2026–2035.
Why does rising visitor spending lift boutique sales?
International visitors are spending more per trip, which supports airport stores and city boutiques that serve buyers from Asia. Visitors from China made 928,000 trips in the year ending September 2025, up 17%, and spent AUD 10.5 billion, up 33%, according to Tourism Research Australia. China accounted for 28% of total visitor spending in the same period, while spending in Western Australia rose 36% and in New South Wales 17%. Visitors can also claim back GST on goods worth at least AUD 300 bought within 60 days of departure, according to Australian Frequent Flyer. As a result, Cartier and Bulgari keep boutiques inside the Sydney Airport international terminal to serve departing visitors.
Lab-grown stones, private salons and new cities gain pace
How are lab-grown diamonds reshaping bridal ranges?
Lab-grown diamonds are taking a rising share of engagement ring sales, which pushes retailers to offer both stone types and to explain the price gap clearly. Lab-grown stones were estimated at 50% to 60% of Australian diamond retail sales, according to the North West Telegraph in February 2026. A Perth jeweler quoted in the same report put a 1-carat mined diamond at about AUD 7,000 to AUD 8,000, against less than AUD 500 for a lab-grown stone. Cerrone now sells lab-grown engagement rings in 18-carat gold, including a 1.52-carat oval solitaire priced at AUD 4,500. As a result, lab-grown bridal ranges help keep Accessible Luxury at 41.0% of 2025 value, while mined stones move toward higher tiers.
How is the shift to private salons changing the boutique?
Boutiques are shifting from open sales floors toward private salons and hospitality spaces, because high-value buyers expect unhurried, confidential viewings. Cartier's Chatswood Chase store opened in May 2026 with two private salons for high jewelry and exceptional pieces, according to Watch Advice. Its Collins Street boutique in Melbourne added a new first floor with a coffee bar and private hospitality area in 2025. Van Cleef & Arpels also built two private consultation rooms into the temporary store of about 200 square meters at 345 George Street in March 2026, according to Ragtrader. Hardy Brothers uses a room called The Vault for private viewings of rare diamonds in its Sydney flagship. In turn, jewelers now match the private service that designer fashion and lifestyle labels offer on the same city streets.
Can museum exhibitions turn heritage into new buyers?
Major exhibitions give maisons an opening to reach new buyers through design history, which can turn museum visitors into future clients. The National Gallery of Victoria presented CARTIER at NGV International from June 12 to Oct. 4, 2026, with nearly 400 jewels, timepieces and objects created with the V&A and Cartier. Local houses hold their own heritage, because Fairfax & Roberts was founded in Sydney in 1858, according to Europa Star, and Hardy Brothers received a Royal Warrant in the 1920s, according to Qantas Travel Insider. In turn, maisons can link exhibitions such as CARTIER at NGV International with private collector events in Melbourne.
Can new boutiques in Adelaide, Brisbane and Perth open growth?
Cities outside Sydney and Melbourne give brands an opening to win buyers who previously traveled or bought online. Paspaley opened a two-level Queen Street boutique in Brisbane in May 2024, according to RUSSH, and a 250-square-meter boutique at Burnside Village in Adelaide in September 2025, according to Cohen Group. Cartier reached Perth in August 2024, and Hardy Brothers trades from a heritage building at 47 King Street in Perth. Visitor spending also rose 23% in South Australia in the year ending September 2025, according to the same tourism survey. In turn, Queensland and Western Australia grows fastest among the four regions during 2026–2035, and smaller states gain more brand presence.
Gold costs, lab-grown pricing and rents test sellers
How do record gold prices squeeze margins?
Gold rose about 65% in U.S. dollar terms in 2025 and reached a record of about USD 4,549 an ounce on Dec. 26, 2025, according to the Perth Mint. This is a direct cost pressure, because gold makes up most of the metal value in rings, chains and bracelets. As a result, brands must raise prices or absorb costs, and buyers delay gifts. Retailers respond with lighter designs, scheduled price changes and pieces that use less metal.
Why does lab-grown pricing blur value for buyers?
Falling lab-grown prices create confusion about value, because buyers can see a large visual stone at a small share of the mined price. As a result, sellers of natural diamonds face harder questions about resale and long-term worth, while some buyers trade down. Retailers respond with clear grading reports, separate bridal ranges for each stone type and more emphasis on design, metal quality and after-sales service that both stone types share.
How do high rents and refits raise store costs?
Flagship rents and refits are a heavy fixed cost, because luxury buyers expect large, prominent stores on a few premium streets. Van Cleef & Arpels closed its Castlereagh Street boutique in March 2026 for a renovation, with reopening expected in early 2027, and moved to a temporary store. In turn, brands carry the cost of two sites during long refits. Larger maisons spread these costs across global networks, while local houses rely on fewer, carefully placed stores.
Why does reliance on visitors add demand risk?
Visitors from China made up 28% of visitor spending in the year ending September 2025, and airport and city boutiques depend on travel from a few source countries. As a result, any slowdown in Chinese travel would hit Sydney and Gold Coast sales quickly. Currency swings also change how local prices compare with Hong Kong and Singapore. Brands respond by building resident client lists and by holding events for local collectors.
Queensland and Western Australia lead the state split
| Region | Value, 2025 (USD million) | Share, 2025 | CAGR, 2026–2035 |
|---|---|---|---|
| Queensland and Western Australia | 145.0 | 34.9% | 5.33% |
| New South Wales | 128.8 | 31.0% | 4.93% |
| Victoria | 95.6 | 23.0% | 4.63% |
| South Australia, Tasmania and Territories | 46.1 | 11.1% | 4.63% |
Brisbane and Perth boutiques lift the largest region
Queensland and Western Australia held a 34.9% share of 2025 value and grow at 5.33% a year. The two states registered 23,595 and 13,366 marriages in 2024, and Western Australian visitor spending rose 36% in the year ending September 2025. Paspaley opened a two-level Brisbane boutique in May 2024, while Cartier opened in Perth in August 2024. As a result, buyers in both states can now see full collections without traveling to Sydney.
How do Sydney flagships keep New South Wales strong?
New South Wales held a 31.0% share of 2025 value and grows at 4.93% a year. The state registered 39,659 marriages in 2024, the most of any state. Sydney hosts the Tiffany & Co. flagship at 175 Pitt Street, a 749-square-meter Cartier store over two floors and the Paspaley flagship in Martin Place, and Cartier added Chatswood Chase in May 2026. In turn, the state draws resident buyers and visitors who stay in five-star hotels and resorts near the harbor.
Why do Melbourne weddings and openings support Victoria?
Victoria held a 23.0% share of 2025 value and grows at 4.63% a year. Marriages in the state rose 7.5% to 32,050 in 2024, the largest increase in the country. Cartier opened at 90 Collins Street in May 2025, and Chopard opened at Chadstone in July 2025. However, visitor spending in Victoria rose only 8% in the year ending September 2025, which keeps growth below the national rate.
How do Adelaide openings support the smaller states?
South Australia, Tasmania and Territories held 11.1% of 2025 value and grow at 4.63% a year. South Australia registered 7,500 marriages in 2024, down 3.6%, and Tasmania recorded 2,364. Paspaley opened its first South Australian boutique at Burnside Village in September 2025. As a result, Adelaide gains brand presence, while buyers in Hobart and Darwin still travel or buy online.
Boutique openings and exhibitions, 2024 to 2026
| Development | Status and market relevance |
|---|---|
| In May 2024, Paspaley opened a two-level boutique on Queen Street in Brisbane. | Adds a second major eastern seaboard store |
| In August 2024, Cartier opened a 300-square-meter boutique in Perth, its first in Western Australia. | Brings full collections to Perth buyers |
| In July 2025, Chopard opened a boutique at Chadstone in Melbourne with its latest store design. | Takes the brand past 10 points of sale |
| In September 2025, Paspaley opened its first South Australian boutique at Burnside Village in Adelaide. | Includes the brand's first bridal space |
| In May 2026, Cartier opened a 406-square-meter boutique at Chatswood Chase in Sydney. | Seventh Cartier store in Australia |
Digital design, fine setting and remote service
- Computer-aided design lets workshops such as Cerrone show clients hand sketches and 3D renderings before any metal is shaped, which shortens approval for bespoke rings.
- Micro-setting under magnification allows specialist setters to work under 10x magnification, which supports pave and halo designs that use many small diamonds.
- Laboratory-grown diamonds give retailers stones that are chemically the same as mined diamonds at a much lower price, which widens choice in bridal ranges.
- Remote consultations connect clients with jewelers by video or phone, which lets buyers in regional areas design pieces and book private viewings without traveling.
Need a Custom Version of This Report?
Tailor the scope, geography, or segments to your exact requirements.
- Custom geography or segment scope
- Direct access to our analyst team
Global maisons and local pearl houses share the market
Competition splits between international maisons and Australian houses that build on pearls, diamonds and bespoke work. Cartier runs seven boutiques across Sydney, Melbourne, Brisbane and Perth, while Tiffany & Co. anchors Pitt Street in Sydney and Van Cleef & Arpels and Bulgari hold Castlereagh Street sites. Chopard sells through its own boutiques and through partner watch and jewelry retailers. Paspaley leads in South Sea pearls with boutiques in Sydney, Melbourne, Brisbane and Adelaide, while Hardy Brothers sells diamonds and Swiss watch brands from Sydney, Melbourne, Brisbane and Perth. Fairfax & Roberts, Cerrone and Jan Logan compete on heritage, bespoke design and pearls. Rivals compete on provenance, private service, bridal ranges and store locations rather than on price.
Which companies sell luxury jewelry in Australia?
| Company | Type | Role in the market |
|---|---|---|
| Cartier | International maison | Seven Australian boutiques, including Perth and Chatswood |
| Tiffany & Co. | International maison | Sydney flagship at 175 Pitt Street |
| Van Cleef & Arpels | International maison | Sydney boutique under renovation until 2027 |
| Bulgari | International maison | Castlereagh Street and Sydney Airport stores |
| Chopard | International maison | Sydney boutique and new Chadstone store |
| Paspaley | Australian pearl house | South Sea pearls, boutiques in four cities |
| Hardy Brothers | Australian jeweler | Diamonds and watches, Royal Warrant holder |
| Fairfax & Roberts | Australian jeweler | Sydney jeweler founded in 1858 |
| Cerrone | Australian jeweler | Bespoke workshop and bridal rings |
| Jan Logan | Australian jeweler | Gemstone and pearl designs, Double Bay flagship |
Provenance and service decide who keeps clients
Credence Research's view is that the Australia luxury jewelry market will grow steadily because weddings remain stable, visitors are spending more and maisons are opening stores in more cities. Rings remain the largest value pool, while earrings and couture pieces add faster growth. Brands that combine provenance, private service and clear bridal choices between mined and lab-grown stones should keep their clients. Record gold prices and dependence on visitors from a few countries will remain the main risks.
Model built from official statistics and releases
The report uses 2025 as the base year on a calendar basis, and market values come from the Credence Research model. That model draws on national marriage statistics, international visitor surveys, national income data, precious metal price records and company announcements on store openings and collections. Segment splits and regional growth rates are Credence Research estimates, while regional shares follow the Credence Research regional split. Sources used are official statistics, government and museum releases, trade press and company pages, and no interviews or surveys were used.
New boutiques and steady weddings carry growth to 2035
The Australia luxury jewelry market is expected to reach USD 685.2 million by 2035, a 4.97% CAGR during 2026–2035, as maisons widen store networks and weddings stay steady. Australia's income base also supports spending, with GDP per person of about USD 65,130 in 2025, according to World Bank data. Growth should be strongest in Brisbane, Perth and Adelaide as new boutiques mature. A sharp fall in visitor numbers or a further jump in gold prices would slow growth, while wider adoption of bespoke and couture work would lift it.
Frequently Asked Questions
How big is the Australia luxury jewelry market?
Which product category leads Australian luxury jewelry?
Which region leads the Australian market?
How many marriages were registered in Australia in 2024?
How are lab-grown diamonds affecting the market?
Which sales channel is growing fastest?
Who are the leading companies in Australian luxury jewelry?
What are the main challenges for luxury jewelers?
Table of Content
Chapter 1 Market Segmentation
- 1.1 Segmentation Framework
- 1.1.1 Product and Service Classification
- 1.1.2 Application and End-Use Classification
- 1.1.3 Technology and Solution Classification
- 1.1.4 Customer and Distribution Channel Classification
- 1.1.5 Geographic Segmentation
- 1.1.6 Market Segment Definitions and Boundaries
- 1.2 By Product Category
- 1.2.1 Rings
- 1.2.2 Necklaces and Pendants
- 1.2.3 Earrings
- 1.2.4 Bracelets and Brooches
- 1.3 By Price Tier
- 1.3.1 Accessible Luxury
- 1.3.2 Premium Luxury
- 1.3.3 High Luxury
- 1.3.4 Ultra-Luxury / Couture
- 1.4 By Purchase Occasion
- 1.4.1 Wedding and Family Celebrations
- 1.4.2 Personal Milestones and Self-Purchase
- 1.4.3 Festive and Relationship Gifting
- 1.4.4 Business and Formal Dressing
Chapter 2 Introduction
- 2.1 Report Objectives and Scope
- 2.2 Product Definition and Industry Terminology
- 2.3 Market Inclusions and Exclusions
- 2.4 Research Process
- 2.4.1 Primary Research and Expert Interviews
- 2.4.2 Secondary Research and Source Review
- 2.4.3 Top-Down and Bottom-Up Estimation
- 2.4.4 Data Triangulation and Verification
- 2.5 Market Size Measurement Basis
- 2.5.1 2025: USD 415.5 million → 2035: USD 685.2 million
- 2.6 Historical and Forecast Reference Periods
- 2.6.1 Historical Period: 2018-2025
- 2.6.2 Base Year: 2025
- 2.6.3 Forecast Period: 2025-2035
- 2.7 Research Assumptions and Limitations
Chapter 3 Executive Summary
- 3.1 Market Snapshot and Key Findings
- 3.2 Base-Year Market Size, 2025
- 3.3 Forecast Market Size, 2035
- 3.4 Revenue and Volume Growth Outlook
- 3.5 Key Demand and Supply Indicators
- 3.6 Leading Market Segments
- 3.7 Fastest-Growing Market Opportunities
- 3.8 Regional Performance Highlights
- 3.9 Technology and Industry Transformation
- 3.10 Competitive Landscape Summary
- 3.11 Analyst View and Strategic Implications
Chapter 4 Australia Luxury Jewelry Market Trends and Developments
- 4.1 Historical Industry Development, 2018-2025
- 4.2 Recent Market Trends and Developments
- 4.3 Demand and Customer Behavior Trends
- 4.4 Technology and Product Innovation
- 4.5 Artificial Intelligence, Automation and Digitalization
- 4.6 Local Manufacturing and Supply Chain Realignment
- 4.7 Industry Partnerships, Mergers and Acquisitions
- 4.8 Sustainability and Circular Economy Developments
- 4.9 Government and Private Sector Investment Trends
- 4.10 Emerging Business Models and Commercialization
- 4.11 Industry Developments and Announcements
Chapter 5 Australia Luxury Jewelry Market Production, Supply and Demand Analysis
- 5.1 Demand Trend and Consumption Analysis, 2018-2025
- 5.2 Demand Forecast, 2025-2035
- 5.3 Production and Output Trend, 2018-2025
- 5.4 Production and Output Forecast, 2025-2035
- 5.5 Installed Capacity and Capacity Utilization
- 5.6 Company-Wise Production Plants and Statistics
- 5.6.1 Installed Production Capacity
- 5.6.2 Actual Production
- 5.6.3 Planned Capacity and Expansion Targets
- 5.7 Supply Chain Structure and Procurement Trends
- 5.8 Supply-Demand Gap and Bottlenecks
- 5.9 Import Dependence and Sourcing Structure
- 5.10 Contract Manufacturing and Outsourcing
- 5.11 Regional Supply and Demand Concentration
Chapter 6 Australia Luxury Jewelry Market Pricing Analysis
- 6.1 Pricing Structure and Measurement
- 6.2 Historical Pricing Trends, 2018-2025
- 6.3 Pricing Outlook, 2025-2035
- 6.4 Average Selling Price and Unit Economics
- 6.5 Pricing by Product and Market Segment
- 6.6 Geographic Pricing Differences
- 6.7 Key Input, Energy, Labor and Logistics Costs
- 6.8 Contract Pricing and Purchasing Models
- 6.9 Pricing Sensitivity and Competitive Positioning
- 6.10 Price, Margin and Profitability Implications
Chapter 7 Australia Luxury Jewelry Market Dynamics
- 7.1 Market Growth Drivers
- 7.1.1 Demand-Side Drivers
- 7.1.2 Technology and Innovation Drivers
- 7.1.3 Infrastructure and Investment Drivers
- 7.1.4 Regulatory and Policy Drivers
- 7.2 Market Restraints
- 7.2.1 Cost and Affordability Constraints
- 7.2.2 Technology and Adoption Barriers
- 7.2.3 Supply Chain and Operational Constraints
- 7.3 Market Challenges
- 7.3.1 Competitive Pressure and Margin Erosion
- 7.3.2 Skills, Infrastructure and Implementation Gaps
- 7.4 Emerging Market Opportunities
- 7.5 Market Dynamics Impact and Time-Horizon Assessment
Chapter 8 Australia Luxury Jewelry Value Chain Analysis
- 8.1 Industry Value Chain Overview
- 8.2 Upstream Suppliers and Critical Inputs
- 8.3 Technology and Component Providers
- 8.4 Manufacturing or Service Delivery
- 8.5 Distribution, Channel Partners and Integrators
- 8.6 Downstream Applications and End Users
- 8.7 Value Addition and Profit Pools
- 8.8 Vertical Integration and Outsourcing
- 8.9 Supplier Concentration and Risk
- 8.10 Supply Chain Localization and Resilience
Chapter 9 Australia Luxury Jewelry Market Regulations and Policies
- 9.1 Relevant Laws, Standards and Compliance Frameworks
- 9.2 Product, Service, Safety and Quality Requirements
- 9.3 Government Policies, Incentives and Subsidies
- 9.4 Imports, Exports and Trade Barriers
- 9.5 Public Procurement and Local Content Requirements
- 9.6 Environmental and Sustainability Compliance
- 9.7 Upcoming Policy Changes and Market Implications
Chapter 10 Australia Luxury Jewelry Market Hotspots and Opportunities
- 10.1 Market Opportunity Mapping and Growth Hotspots
- 10.2 High-Growth Applications and Customer Groups
- 10.3 Underserved Markets and White-Space Opportunities
- 10.4 Emerging Technology and Product Opportunities
- 10.5 New Capacity and Investment Hotspots
- 10.6 Market Entry and Expansion Opportunities
- 10.7 Distribution and Partnership Opportunities
- 10.8 Near-Term and Long-Term Commercial Potential
- 10.9 Opportunity Attractiveness and Execution Risks
Chapter 11 Australia Luxury Jewelry Market Outlook, 2025-2035
- 11.1 Market Size and Analysis
- 11.1.1 Revenue (Market Measurement: 2025: USD 415.5 million → 2035: USD 685.2 million)
- 11.1.2 Market Volume and Quantity Sold
- 11.1.3 Historical Market Size, 2018-2025
- 11.1.4 Base-Year Market Size, 2025
- 11.2 Market Forecast, 2025-2035
- 11.2.1 Revenue Forecast to 2035
- 11.2.2 Volume Forecast to 2035
- 11.2.3 CAGR and Year-on-Year Growth
- 11.2.4 Incremental Revenue Opportunity
- 11.3 Forecast Assumptions and Scenario Analysis
- 11.3.1 Base-Case Forecast
- 11.3.2 Optimistic and Conservative Scenarios
- 11.3.3 Technology, Pricing and Policy Sensitivities
- 11.4 Market Attractiveness and Growth Outlook
Chapter 12 Australia Luxury Jewelry Market Segmentation and Outlook
- 12.1 Segmentation Summary and Market Shares, 2025
- 12.2 Largest and Fastest-Growing Segments
- 12.3 By Product Category - Market Size and Forecast, 2025-2035
- 12.3.1 Segment Definition and Scope
- 12.3.2 Historical Market Size, 2018-2025
- 12.3.3 Revenue Forecast, 2025-2035
- 12.3.4 Volume Forecast, 2025-2035
- 12.3.5 Base-Year Market Share, 2025
- 12.3.6 Segment CAGR and Growth Drivers
- 12.3.7 Subsegment Market Size and Forecast
- 12.3.7.1 Rings
- 12.3.7.2 Necklaces and Pendants
- 12.3.7.3 Earrings
- 12.3.7.4 Bracelets and Brooches
- 12.3.8 Subsegment Pricing and Adoption Trends
- 12.3.9 Leading Suppliers and Competition
- 12.3.10 Regional Demand and Opportunities
- 12.4 By Price Tier - Market Size and Forecast, 2025-2035
- 12.4.1 Segment Definition and Scope
- 12.4.2 Historical Market Size, 2018-2025
- 12.4.3 Revenue Forecast, 2025-2035
- 12.4.4 Volume Forecast, 2025-2035
- 12.4.5 Base-Year Market Share, 2025
- 12.4.6 Segment CAGR and Growth Drivers
- 12.4.7 Subsegment Market Size and Forecast
- 12.4.7.1 Accessible Luxury
- 12.4.7.2 Premium Luxury
- 12.4.7.3 High Luxury
- 12.4.7.4 Ultra-Luxury / Couture
- 12.4.8 Subsegment Pricing and Adoption Trends
- 12.4.9 Leading Suppliers and Competition
- 12.4.10 Regional Demand and Opportunities
- 12.5 By Purchase Occasion - Market Size and Forecast, 2025-2035
- 12.5.1 Segment Definition and Scope
- 12.5.2 Historical Market Size, 2018-2025
- 12.5.3 Revenue Forecast, 2025-2035
- 12.5.4 Volume Forecast, 2025-2035
- 12.5.5 Base-Year Market Share, 2025
- 12.5.6 Segment CAGR and Growth Drivers
- 12.5.7 Subsegment Market Size and Forecast
- 12.5.7.1 Wedding and Family Celebrations
- 12.5.7.2 Personal Milestones and Self-Purchase
- 12.5.7.3 Festive and Relationship Gifting
- 12.5.7.4 Business and Formal Dressing
- 12.5.8 Subsegment Pricing and Adoption Trends
- 12.5.9 Leading Suppliers and Competition
- 12.5.10 Regional Demand and Opportunities
- 12.6 Segment Growth Comparison
- 12.7 Segment Attractiveness and Priority Matrix
Chapter 13 Australia Luxury Jewelry Geographic Market Outlook, 2025-2035
- 13.1 Domestic Market Distribution and Demand Clusters
- 13.2 State- or Province-Wise Market Size and Forecast, 2025-2035
- 13.3 City and Metropolitan Market Outlook
- 13.4 Industrial, Manufacturing and Commercial Clusters
- 13.5 Geographic Concentration of Key End Users
- 13.6 Local Pricing and Purchasing Differences
- 13.7 Domestic Production Facilities and Capacity Map
- 13.8 Local Infrastructure and Project Pipeline
- 13.9 State-Level Policy and Incentive Differences
- 13.10 Subnational Investment Hotspots and Opportunities
- 13.11 Distribution and Logistics Networks
- 13.12 Domestic Competitive Footprint
Chapter 14 Australia Luxury Jewelry Technology, Innovation and Sustainability Outlook
- 14.1 Technology Landscape and Maturity
- 14.2 Product, Process and Service Innovation
- 14.3 AI, Automation and Digital Tools in the Industry
- 14.4 Technology Adoption and Performance Benchmarking
- 14.5 Innovation Pipeline and R&D Investment
- 14.6 Patent and Intellectual Property Trends
- 14.7 Energy Efficiency and Resource Management
- 14.8 Sustainability, Recycling and Circularity
- 14.9 Technology Roadmap, 2025-2035
- 14.10 Risks of Obsolescence and Technology Substitution
Chapter 15 Australia Luxury Jewelry Market Key Strategic Imperatives
- 15.1 Growth and Market Entry Priorities
- 15.2 High-Return Products and Segments
- 15.3 Pricing, Profitability and Cost Optimization
- 15.4 Technology Investment and Product Differentiation
- 15.5 Supply Chain Localization and Resilience
- 15.6 Distribution and Customer Acquisition
- 15.7 Partnership, Acquisition and Capacity Strategy
- 15.8 Regional Expansion Priorities
- 15.9 Short-, Medium- and Long-Term Actions
Chapter 16 Competition Outlook
- 16.1 Industry Competition Characteristics
- 16.2 Market Structure and Concentration
- 16.3 Market Share and Competitive Positioning, 2025
- 16.4 Company-Wise Revenue and Product Benchmarking
- 16.5 Production and Service Capacity Benchmarking
- 16.6 Technology, Pricing and Differentiation
- 16.7 Regional Footprint and Distribution Strength
- 16.8 Mergers, Acquisitions and Strategic Alliances
- 16.9 New Entrants and Competitive Threats
- 16.10 Porter's Five Forces and Industry Attractiveness
- 16.11 Competitive Outlook, 2025-2035
Chapter 17 Company Profiles
- 17.1 Company Coverage and Selection Criteria
- 17.2 Cartier
- 17.2.1 Business Description
- 17.2.2 Company Ownership and Geographic Presence
- 17.2.3 Product and Service Portfolio
- 17.2.4 Manufacturing and Operating Footprint
- 17.2.5 Production Capacity and Expansion Plans
- 17.2.6 Financial Performance and Investment
- 17.2.7 Market Share and Competitive Position
- 17.2.8 Technology and Innovation Capabilities
- 17.2.9 Strategic Alliances or Partnerships
- 17.2.10 Recent Developments
- 17.2.11 Growth Strategy and Outlook
- 17.3 Tiffany & Co.
- 17.4 Van Cleef & Arpels
- 17.5 Bulgari
- 17.6 Chopard
- 17.7 Paspaley
- 17.8 Hardy Brothers
- 17.9 Fairfax & Roberts
- 17.10 Cerrone
- 17.11 Jan Logan
- 17.12 Other Relevant Market Participants
Note: Every listed company is profiled on the structure shown under the first company. The company list is preliminary and may change based on research findings, market developments, data availability and client requirements.
Chapter 18 Disclaimer
- 18.1 Research and Forecast Disclaimer
- 18.2 Data Source and Estimation Limitations
Note: The depth of individual sections depends on data availability for this market. Volume, capacity, trade and other unit-based metrics are included where applicable.

