
Executive Summary & Core Metrics
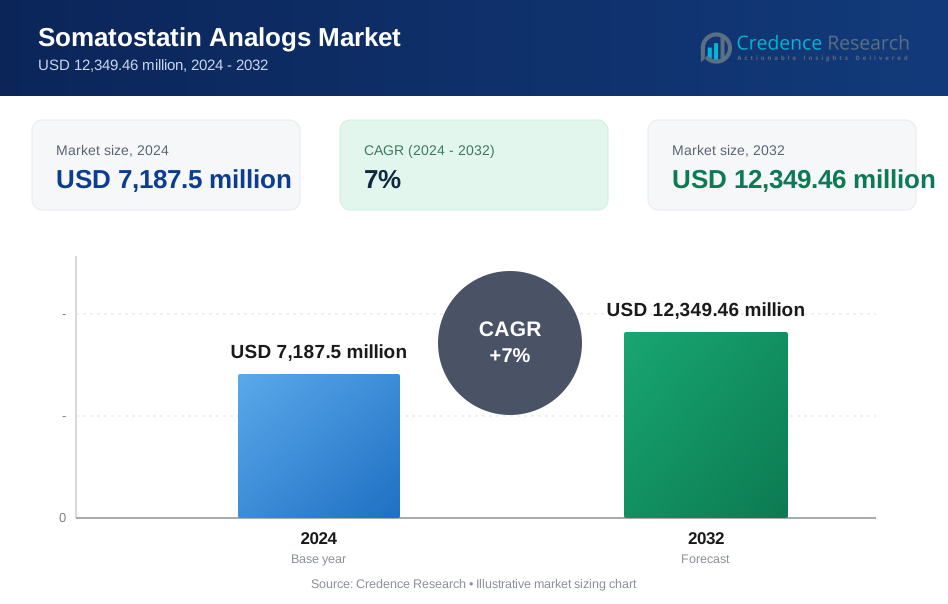
The global somatostatin analogs market was valued at USD 7,187.5 million in 2024 and is projected to reach USD 12,349.46 million by 2032, expanding at a compound annual growth rate (CAGR) of 7% during the forecast period, according to Credence Research.
| REPORT ATTRIBUTE | DETAILS |
|---|---|
| Historical Period | 2020-2023 |
| Base Year | 2024 |
| Forecast Period | 2025-2032 |
| Somatostatin Analogs Market Size 2024 | USD 7,187.5 million |
| Somatostatin Analogs Market, CAGR | 7% |
| Somatostatin Analogs Market Size 2032 | USD 12,349.46 million |
This growth reflects rising diagnosis of neuroendocrine tumors, acromegaly, Cushing’s syndrome and other hormonal disorders, along with broader adoption of long-acting depot therapies across specialty endocrine and oncology care.
The global somatostatin analogs market is characterized by the presence of pharmaceutical companies focused on long-acting formulations, receptor-targeted therapies, depot technologies and specialty endocrine treatment access. Leading players focus on octreotide, lanreotide, pasireotide and next-generation analogs across neuroendocrine tumors, acromegaly, Cushing’s syndrome and rare hormonal disorders. Strategic priorities across the sector include improved delivery convenience, home-based administration, expanded clinical indications, patient adherence support, specialty clinic partnerships and geographic expansion across Asia Pacific, Latin America and the Middle East.
Strategic Market Insights
- Market growth is primarily driven by rising prevalence of neuroendocrine tumors and pituitary disorders, higher diagnostic rates and broader clinical adoption of long-acting somatostatin therapies.
- Dominant industry trends highlight long-acting formulations, home-based administration, oral candidates, next-generation analogs and improved delivery systems that support better adherence in chronic endocrine care.
- The competitive landscape is defined by major players investing in depot technologies, receptor-targeted research, broader indication approvals and life-cycle management strategies.
- According to Credence Research regional mapping, North America represents the largest market, accounting for a definitive 38% share due to advanced specialty care, strong reimbursement and high adoption of long-acting analogs.
Market Segmentation Analysis
By Type
- Octreotide
- Lanreotide
- Pasireotide
- Others
Octreotide leads the somatostatin analogs market with a 46% share, supported by broad clinical use in acromegaly and neuroendocrine tumor control. Its strong adoption is driven by long-acting formulations that reduce dosing frequency and support steady symptom relief. Physicians continue to rely on octreotide across specialty treatment pathways because of its established role in chronic disease management.
Lanreotide holds 32% share and records rising demand due to expanded treatment use in gastroenteropancreatic tumors. Pasireotide accounts for 14% share and gains attention in Cushing’s disease, supported by stronger cortisol suppression. Other analogs capture 8% share, reflecting ongoing research in rare hormonal disorders. Rising approvals for long-acting depot formulations continue to support treatment extension and higher patient adherence across major regions.
Novartis has maintained strong global supply continuity for Sandostatin LAR through strategic manufacturing investments that enhance production capabilities for chronic therapy demand.
By Indication
- Neuroendocrine Tumors
- Acromegaly
- Cushing’s Syndrome
- Others
Neuroendocrine tumors dominate the indication segment with 52% share due to strong clinical evidence supporting symptom relief and disease progression control. Demand is increasing as diagnostic imaging, biomarker testing and disease awareness improve detection of gastroenteropancreatic tumors. Specialist centers continue to use somatostatin analogs as a key treatment approach for patients requiring long-term disease management.
Acromegaly holds 28% share, supported by clear dosing guidelines and ongoing chronic care requirements. Cushing’s syndrome represents 12% share, with increasing interest in medical therapy before surgery or when surgery fails. Other indications capture 8% share, including rare hormonal disorders. Higher focus on diagnostic pathways, biomarker testing and endocrine care centers continues to support treatment expansion.
Ipsen has treated neuroendocrine tumor patients with Somatuline Depot across regulated regions and improved syringe fill accuracy through upgraded automation linked to its electronic autoinjector development.
By Route of Administration
- Injectable
- Oral
- Intravenous
- Others
Injectable forms remain dominant with 61% share, supported by long-acting depot delivery that enables steady symptom control and monthly dosing convenience. Injectable somatostatin analogs remain preferred across neuroendocrine tumors and acromegaly because they reduce treatment frequency and support chronic disease management. Specialty clinics and hospitals continue to rely on injectable depot formulations for predictable therapeutic delivery.
Intravenous administration holds 22% share and remains limited mainly to hospital settings for acute control. Oral candidates account for 11% share, reflecting early development of new formulations designed to improve patient comfort and adherence. Other routes account for 6% share, including implantable options in research stages. Growing demand for home-based care and reduced hospital visits continues to support innovation in delivery systems.
By End User
- Hospitals
- Specialty Clinics
- Ambulatory Surgical Centers
- Retail Pharmacies
Hospitals represent a major end-user category due to their role in diagnosis, treatment initiation and management of complex neuroendocrine and pituitary disorders. Hospitals also support injectable administration, monitoring and pre-surgical or post-surgical therapy planning for patients requiring specialist care.
Specialty clinics continue to gain importance as chronic endocrine and oncology patients shift toward structured long-term care. Ambulatory surgical centers support selected procedures and follow-up treatment pathways, while retail pharmacies contribute to prescription access for approved formulations and supportive therapies. Growth across end users is linked to diagnosis rates, reimbursement, specialist availability and treatment adherence support.
Key Market Dynamics
Primary Market Drivers
Growing Prevalence of Neuroendocrine and Pituitary Disorders
Rising cases of neuroendocrine tumors and pituitary disorders increase clinical demand for somatostatin analogs. More patients receive early diagnosis through improved imaging and biomarker testing. Physicians choose long-acting therapies to control hormonal imbalance with fewer hospital visits and stronger chronic management. Patients with endocrine disorders often require continuous treatment, increasing long-term prescription volume in specialty centers. Chiasma conducted the global Phase 3 MPOWERED trial to compare oral octreotide therapy with long-acting injectables for maintenance treatment in adults with acromegaly who were previously responsive to injectable therapies.
Shift Toward Long-Acting Formulations and Home-Based Care
Long-acting formulations reduce dosing frequency and support steady symptom control. Patients prefer monthly or extended delivery schedules that reduce clinic time and improve convenience. Hospitals also benefit by reducing infusion loads and supporting home administration where appropriate. Drug developers invest in improved depot systems with better release control and longer therapeutic effect. Pfizer provides a Somavert self-administration kit and patient support materials, including nurse-led training for subcutaneous injection technique for patients or caregivers.
Expanding Use in Pre-Surgical and Post-Surgical Therapy
Physicians increasingly use somatostatin analogs for pre-surgical symptom control and tumor stabilization. Post-surgical use also grows when patients require hormonal management or relapse support. These therapies help stabilize disease and improve quality of life while reducing symptom crises. Patients with limited surgical options may depend on long-acting treatment for ongoing disease control. Broader therapeutic roles continue to support demand across oncology and endocrine clinics.
Key Trends & Structural Opportunities
Development of Next-Generation Analogs and Novel Mechanisms
Drug developers are researching new somatostatin analogs with stronger receptor targeting and improved symptom control. These candidates aim to reduce side effects and improve response among patients with complex endocrine disorders. Research teams are also exploring new delivery routes that improve comfort and adherence. More clinical trials in rare endocrine diseases create new entry points for manufacturers. Crinetics Pharmaceuticals advanced its oral paltusotine program through Phase 3 trials enrolling 194 acromegaly patients, with the molecule demonstrating high SST2 binding affinity.
Growing Access in Emerging Markets and Specialty Centers
Emerging markets are expanding reimbursement coverage for chronic endocrine diseases. New diagnostic imaging centers help detect neuroendocrine tumors earlier, while hospitals invest in advanced endocrine care and specialty clinics. Expanding insurance plans support adoption of long-acting analogs, and physician training improves treatment handling. These developments create growth opportunities in Asia Pacific, Latin America and the Middle East. Higher diagnosis rates in urban hospitals continue to increase treatment demand.
Rising Focus on Oral and Patient-Friendly Formulations
Oral candidates and improved delivery systems are gaining attention because they can reduce injection burden and improve patient convenience. Chronic endocrine patients often require long treatment cycles, making adherence and comfort important commercial differentiators. Companies developing oral analogs, autoinjectors and home administration models can strengthen market access and patient retention. Credence Research identifies patient-friendly delivery as a key opportunity across chronic acromegaly and neuroendocrine tumor care.
Industry Challenges
High Treatment Cost and Limited Access in Developing Regions
Somatostatin analogs remain expensive for many health systems and families. Costs restrict access in countries with limited reimbursement and lower insurance coverage. Patients may delay treatment due to price barriers or limited availability outside major urban centers. Hospitals with tight budgets may restrict usage, which slows adoption in low-income regions. Companies must address affordability, reimbursement and distribution to expand broader treatment access.
Side Effects and Variable Patient Response
Some patients experience metabolic changes, digestive side effects and tolerance issues that reduce acceptance among sensitive groups and elderly patients. Variable receptor response can affect symptom control in complex endocrine cases. Physicians may need to adjust dosing or switch therapy when clinical response is inconsistent. These factors can limit long-term adherence and predictable outcomes. Better personalization, monitoring and receptor-targeted development are needed to improve treatment continuity.
Detailed Regional Analysi
| Region | Market Share (%) | Strategic Regional Catalysts & Insights |
| North America | 38.0% | Global leader. Supported by high diagnosis rates, established reimbursement, specialty oncology networks and strong adoption of long-acting analogs. |
| Europe | 32.0% | Mature regional market. Driven by structured reimbursement, clinical guidelines, specialist centers and established endocrine treatment pathways. |
| Asia Pacific | 20.0% | Fastest-growing region. Supported by rising diagnosis, expanding specialty care and wider access to advanced endocrine therapies. |
| Latin America | 6.0% | Developing regional market. Driven by improving specialty care, public hospital procurement and rising adoption in Brazil and Mexico. |
| Middle East & Africa | 4.0% | Emerging territory. Supported by selective adoption in Gulf healthcare hubs, oncology centers and gradual specialty care expansion. |
North America leads the global somatostatin analogs market with a 38% share, according to Credence Research. The region benefits from strong adoption of long-acting analogs in neuroendocrine tumor and acromegaly care. High diagnosis rates, expanded genetic testing and strong specialty oncology networks support continuous treatment volume. The United States leads growth through favorable insurance coverage and rapid uptake of next-generation therapies. Hospitals and specialty clinics follow established guidelines and support long-term disease management using injectable depot formulations.
Europe accounts for 32% of the global market, supported by structured reimbursement frameworks, strong clinical guidelines and established specialty oncology treatment pathways. Germany, France, Italy and the United Kingdom dominate regional usage due to developed endocrine care networks. Key hospitals adopt long-acting drugs for pre-surgical and maintenance therapy and continue shifting toward home-based administration policies. Advanced imaging and specialty testing support early diagnosis and stable treatment demand.
Asia Pacific holds 20% share and records the fastest growth due to rising diagnosis of neuroendocrine tumors and expanding access to advanced endocrine therapies. China, Japan, South Korea and Australia lead adoption as hospitals increase specialty care capacity. Wider access to depot formulations, broader insurance inclusion and growing awareness among endocrinologists improve market penetration. Higher investment in medical infrastructure and referral systems supports treatment uptake across developing health systems and urban centers.
Latin America represents 6% share, supported by gradual growth in specialty endocrine care and improved procurement by public hospitals. Brazil and Mexico dominate regional demand due to larger populations and expanding oncology services. Slow diagnosis and limited reimbursement continue to restrict broader access, though private insurance improves treatment penetration for long-acting analogs. Training programs and improved imaging help detect conditions earlier in major cities.
The Middle East & Africa account for 4% share, driven by selective adoption in major healthcare hubs across Gulf countries and South Africa. Large teaching hospitals use somatostatin analogs for complex endocrine disorders, while access remains limited across lower-income areas. Specialized oncology centers in Saudi Arabia, the UAE and Qatar expand treatment use for long-acting formulations supported by government funding. Gradual healthcare spending improvement and new specialty centers create future opportunities.
Competitive Landscape & Recent Developments
The somatostatin analogs market includes major companies such as
- Novartis AG,
- Ipsen Pharma,
- Sun Pharmaceutical Industries,
- Teva Pharmaceutical Industries,
- Pfizer Inc.,
- Ferring Pharmaceuticals,
- Crinetics Pharmaceuticals,
- Recordati S.p.A,
- Mylan N.V.
- Chiasma Inc.
These companies compete through long-acting formulations, depot technologies, receptor-targeted research and expanded indications across neuroendocrine tumors, acromegaly and Cushing’s syndrome.
Market leaders invest in clinical trials to improve patient response, durability and treatment convenience. Partnerships with specialty hospitals help improve treatment accessibility and strengthen brand presence. Manufacturers also expand geographic reach through regulatory approvals in Asia Pacific, Latin America and the Middle East. Competition focuses on delivery convenience, reduced side effects, clinical efficacy and long-term patient usage. Life-cycle management strategies and post-marketing studies remain important tools for maintaining competitive positioning.
Recent Industry Developments (2025)
- In September 2025, Crinetics announced FDA approval of PALSONIFY (paltusotine) for adults with acromegaly. This is the first once-daily oral SST2 agonist approved in the U.S. for this condition.
- In May 2025, Crinetics presented new data at the AACE Annual Meeting showing that paltusotine provided rapid, durable IGF-1 control in surgically naïve acromegaly patients.
Request a Free Sample
Fill in your details and we'll send you a free sample report.
- Sample data tables & charts
- Research methodology
Need a Custom Version of This Report?
Tailor the scope, geography, or segments to your exact requirements.
- Custom geography or segment scope
- Direct access to our analyst team
Frequently Asked Questions
What is the current and projected size of the global somatostatin analogs market?
What is the projected growth rate of the somatostatin analogs industry over the forecast period?
Which type segment holds the maximum market share within the somatostatin analogs industry?
Which indication segment dominates the somatostatin analogs market?
Which route of administration leads the somatostatin analogs market?
Which region commands the highest market share in the global somatostatin analogs space?
Table of Content
Chapter 1. Report Introduction
- 1.1 Report Description & Purpose
- 1.1.1 Report Title & Market Definition
- 1.1.2 Unique Selling Propositions (USP) & Key Differentiators
- 1.1.3 Value Proposition for Stakeholders
- 1.2 Research Objectives
- 1.2.1 Market Sizing Objectives (Volume & Revenue)
- 1.2.2 Segmentation Objectives
- 1.2.3 Competitive Intelligence Objectives
- 1.2.4 Forecast & Scenario Objectives
- 1.3 Report Scope
- 1.3.1 Somatostatin Analogs Scope – Types & Subtypes Covered
- 1.3.2 Geographic Scope – Regions & Countries Covered
- 1.3.3 Historical Period, Base Year & Forecast Period (2024; forecast to 2032)
- 1.3.4 Inclusions & Exclusions
- 1.4 HS Code & Classification Framework
- 1.5 Currency, Units & Pricing Basis
- 1.6 Target Stakeholders
- 1.7 Limitations & Assumptions
Chapter 2. Executive Summary
- 2.1 Global Somatostatin Analogs Market Snapshot
- 2.1.1 Market Size – Historical (2024) & Forecast (2024-2032) (2024: USD 7,187.5 million → 2032: USD 12,349.46 million)
- 2.1.2 Volume & Revenue – Global Totals
- 2.1.3 Key Market Highlights – Top Five Facts
- 2.2 Somatostatin Analogs Market Segmentation Snapshot
- 2.2.1 Market Split by Region – 2024 vs. 2032
- 2.3 Competitive Snapshot
- 2.3.1 Top 10 Players by Revenue Share – 2024
- 2.3.2 Top 10 Players by Volume Share – 2024
- 2.3.3 Recent Strategic Developments (18-Month Summary)
- 2.4 Key Investment Highlights & Strategic Conclusions
Chapter 3. Somatostatin Analogs Market Dynamics & Industry Analysis
- 3.1 Market Overview & Context
- 3.1.1 Somatostatin Analogs Market Position in the Broader Automotive Value Chain
- 3.1.2 OEM vs. Replacement Market Dynamics
- 3.1.3 Market Maturity & Development Stage by Region
- 3.2 Somatostatin Analogs Market Drivers
- 3.3 Somatostatin Analogs Market Restraints & Challenges
- 3.4 Somatostatin Analogs Market Opportunities
- 3.5 Porter's Five Forces Analysis
- 3.5.1 Threat of New Entrants
- 3.5.2 Bargaining Power of Suppliers
- 3.5.3 Bargaining Power of Buyers
- 3.5.4 Threat of Substitutes
- 3.5.5 Competitive Rivalry – Intensity Assessment
- 3.6 Somatostatin Analogs Value Chain Analysis
- 3.6.1 Upstream – Raw Material/Input Suppliers
- 3.6.1.1 Raw Material/Input 1
- 3.6.1.2 Raw Material/Input 2
- 3.6.1.3 Raw Material/Input 3
- 3.6.2 Midstream – Production/Manufacturing/Service Delivery
- 3.6.2.1 Production/Process Overview
- 3.6.2.2 Key Facility Locations & Capacity by Manufacturer
- 3.6.3 Downstream – Distribution & End Consumer
- 3.6.3.1 Primary Channel – B2B/OEM
- 3.6.3.2 Secondary Channels – Dealer, Retail, Online, Direct
- 3.6.4 Value Chain Profitability Analysis
- 3.6.1 Upstream – Raw Material/Input Suppliers
- 3.7 PESTEL Analysis
- 3.7.1 Political Factors
- 3.7.2 Economic Factors
- 3.7.3 Social Factors
- 3.7.4 Technological Factors
- 3.7.5 Environmental Factors
- 3.7.6 Legal Factors
- 3.8 Somatostatin Analogs Supply Chain Analysis
- 3.8.1 Raw Material/Input Supply Risk Assessment
- 3.8.2 Manufacturing Concentration Risk (Geographic Exposure)
- 3.8.3 Trade Disruption Impact Analysis
- 3.9 Regulatory & Policy Landscape
Note: The regulatory and policy landscape section covers regulations based on their applicability to the market, Somatostatin Analogs category, geography, and scope of the study. Only regulatory frameworks with a material impact on operations, compliance, trade, sustainability, or market access are analyzed in detail.
Chapter 4. Key Investment Pockets & Opportunity Analysis
- 4.1 Somatostatin Analogs Market Attractiveness Analysis
- 4.1.1 By Region – Investment Attractiveness Matrix (Volume × CAGR)
- 4.2 Absolute Revenue Growth Opportunity
- 4.2.1 By Region – Absolute USD Growth Through 2032
- 4.3 Incremental Volume Opportunity
- 4.3.1 By Region – Incremental Volume Through 2032
- 4.3.2 Segment – Incremental Volume
- 4.4 Emerging Submarket Opportunity Deep Dive (Subject to Applicability)
- 4.5 Emerging Market Opportunity Scorecards
- 4.5.1 United States
- 4.5.2 Europe
- 4.5.3 Asia
- 4.5.4 Middle East & Africa
Note: Emerging Market Opportunity Scorecards will be included based on relevance and strategic importance. Regions listed are indicative and may vary depending on data availability and market dynamics.
Chapter 5. Somatostatin Analogs Import-Export Analysis & Trade Flows
- 5.1 Global Trade Overview
- 5.1.1 Global Export Value by Country (2024)
- 5.1.2 Global Export Volume by Country (2024)
- 5.1.3 Global Import Value by Country (2024)
- 5.1.4 Global Import Volume by Country (2024)
- 5.1.5 Net Trade Balance by Country (2024)
- 5.2 Export Analysis – Segment
- 5.2.1 Type 1 (HS Code)
- 5.2.2 Type 2 (HS Code)
- 5.2.3 Type 3 (HS Code)
- 5.2.4 Type 4 (HS Code)
- 5.2.5 Type 5 (HS Code)
- 5.3 Import Analysis – Segment
- 5.3.1 Type 1 (HS Code)
- 5.3.2 Type 2 (HS Code)
- 5.3.3 Type 3 (HS Code)
- 5.3.4 Type 4 (HS Code)
- 5.3.5 Type 5 (HS Code)
- 5.4 Average Unit Trade Prices
- 5.4.1 Average Export Price – Segment & Country
- 5.4.2 Average Import Price – Segment & Source Country
- 5.4.3 Price Trends (2024)
- 5.5 Key Trade Route Analysis
- 5.5.1 Trade Route 1
- 5.5.2 Trade Route 2
- 5.5.3 Trade Route 3
- 5.5.4 Trade Route 4
- 5.5.5 Trade Route 5
- 5.6 Trade Policy Impact Assessment
- 5.6.1 US Anti-Dumping & Section 301 Tariffs
- 5.6.2 EU Customs Union Impact
- 5.6.3 Major Free Trade Agreements
- 5.6.4 USMCA Rules of Origin
Note: Trade policy analysis will be included only where relevant to the Somatostatin Analogs market.
Chapter 6. Competitive Landscape & Company Benchmarking
- 6.1 Somatostatin Analogs Market Concentration & Structure
- 6.1.1 Herfindahl-Hirschman Index (HHI) – vs. 2024
- 6.1.2 Tier 1, Tier 2 & Tier 3 Market Structure
- 6.1.3 Global, Regional & Local Player Dynamics
- 6.2 Somatostatin Analogs Market Share Analysis – 2024
- 6.2.1 Global Revenue Share by Company
- 6.2.2 Global Volume Share by Company
- 6.2.3 Regional Revenue Share
- 6.2.4 Market Share Evolution ( vs. 2024)
- 6.2.5 OEM Segment Share by Company
- 6.2.6 Replacement Segment Share by Company
- 6.3 Production/Delivery Capacity & Facility Analysis
- 6.3.1 Global Installed Capacity
- 6.3.2 Capacity Utilization Rates
- 6.3.3 Production/Output Volume
- 6.3.4 Facility Locations & Capacity Map
- 6.3.5 Planned Capacity Additions
- 6.4 Somatostatin Analogs Competitive Benchmarking Matrix
- 6.4.1 Revenue, Volume, CAGR & Profitability Comparison
- 6.4.2 Channel Revenue Mix
- 6.4.3 Geographic Revenue Exposure
- 6.4.4 R&D Intensity
- 6.4.5 Sustainability Maturity
- 6.5 Strategic Developments in Somatostatin Analogs (Last 24 Months)
- 6.5.1 Mergers, Acquisitions & Divestments
- 6.5.2 New Somatostatin Analogs Launches
- 6.5.3 Facility Expansions
- 6.5.4 Strategic Alliances, Joint Ventures & Partnerships
- 6.5.5 Distribution Expansion & Market Entry
- 6.5.6 Sustainability & ESG Initiatives
- 6.6 Competitive Strategy Mapping
- 6.6.1 Leader, Challenger, Follower & Niche Classification
- 6.6.2 Pricing Strategy Comparison
- 6.6.3 Channel Strategy Matrix
Note: Strategic developments are included based on their materiality and the availability of reliable information.
Chapter 7. Global Somatostatin Analogs Market – By Distribution Channel
- 7.1 Segment Overview
- 7.1.1 Volume & Revenue Split by Channel (2024 & 2032)
- 7.1.2 Channel Mix Evolution (2024-2032)
Chapter 8. Regional Market Analysis – Global Overview
- 8.1 Global Regional Overview
- 8.1.1 Regional Volume Share
- 8.1.2 Regional Revenue Share
- 8.1.3 Regional Volume by Region
- 8.1.4 Regional Revenue by Region
- 8.1.5 Regional Forecast Through 2032
- 8.2 Cross-Regional Segment Analysis
- 8.2.1 By Distribution Channel
- 8.2.2 By Brand/Price Tier
Chapter 9. North America Somatostatin Analogs Market
- 9.1 United States
- 9.2 Canada
- 9.3 Mexico
Chapter 10. Europe Somatostatin Analogs Market
- 10.1 Germany
- 10.2 France
- 10.3 Italy
- 10.4 United Kingdom
- 10.5 Spain
- 10.6 Poland
- 10.7 Russia
- 10.8 Netherlands
- 10.9 Belgium
- 10.10 Sweden
- 10.11 Denmark
- 10.12 Norway
- 10.13 Rest of Europe
Chapter 11. Asia Pacific Somatostatin Analogs Market
- 11.1 China
- 11.2 India
- 11.3 Japan
- 11.4 South Korea
- 11.5 Thailand
- 11.6 Indonesia
- 11.7 Vietnam
- 11.8 Malaysia
- 11.9 Australia
- 11.10 Rest of Asia Pacific
Chapter 12. Latin America Somatostatin Analogs Market
- 12.1 Brazil
- 12.2 Argentina
- 12.3 Colombia
- 12.4 Chile
- 12.5 Rest of Latin America
Chapter 13. Middle East Somatostatin Analogs Market
- 13.1 Saudi Arabia
- 13.2 United Arab Emirates
- 13.3 Turkey
- 13.4 Israel
- 13.5 Iran
- 13.6 Rest of the Middle East
Chapter 14. Africa Somatostatin Analogs Market
- 14.1 South Africa
- 14.2 Egypt
- 14.3 Nigeria
- 14.4 Morocco
- 14.5 Rest of Africa
Chapter 15. Somatostatin Analogs Company Profiles
- 15.1 [Company 01]
- 15.1.1 Company Overview
- 15.1.2 Key Management Personnel
- 15.1.3 Products & Services Portfolio
- 15.1.4 Financial Performance
- 15.1.5 Key Market Focus & Geographic Presence
- 15.1.6 Recent Developments & Strategic Initiatives
Note: The company profile list is preliminary and may change based on research findings, market developments, data availability, and client requirements.
Chapter 16. Appendices
- Appendix A – List of Abbreviations & Acronyms
- Appendix B – Industry Classification Code Reference – Full Series
- Appendix C – Production & Capacity Data Tables
- Appendix D – End-Use & Demand Base Tables
- Appendix E – Consumption & Replacement Rate Assumptions
- Appendix F – ASP Reference Tables
- Appendix G – Manufacturing & Facility Database
- Appendix H – Import-Export Data Tables
- Appendix I – Regulatory Summary Tables
- Appendix J – Primary Research Participant List (Anonymized)
- Appendix K – Primary Research Questionnaire Framework
- Appendix L – Data Sources & Bibliography
- Appendix M – Market Size Divergence & Source Comparison
Chapter 17. Research Methodology
- 17.1 Research Framework & Philosophy
- 17.2 Secondary Research – Sources, Hierarchy & Data Extraction
- 17.3 Data Modeling – Bottom-Up & Top-Down Market Sizing
- 17.4 Primary Research – Stakeholder Framework, LOI & Sample Sizes
- 17.5 Forecast Methodology – Regression, Scenario & Sensitivity Analysis
- 17.6 Quality Control – Four-Layer Validation Framework
- 17.7 Limitations & Standard Assumptions
- 17.8 Disclaimer
