
Targeted agents and immunotherapy drive cancer drug value
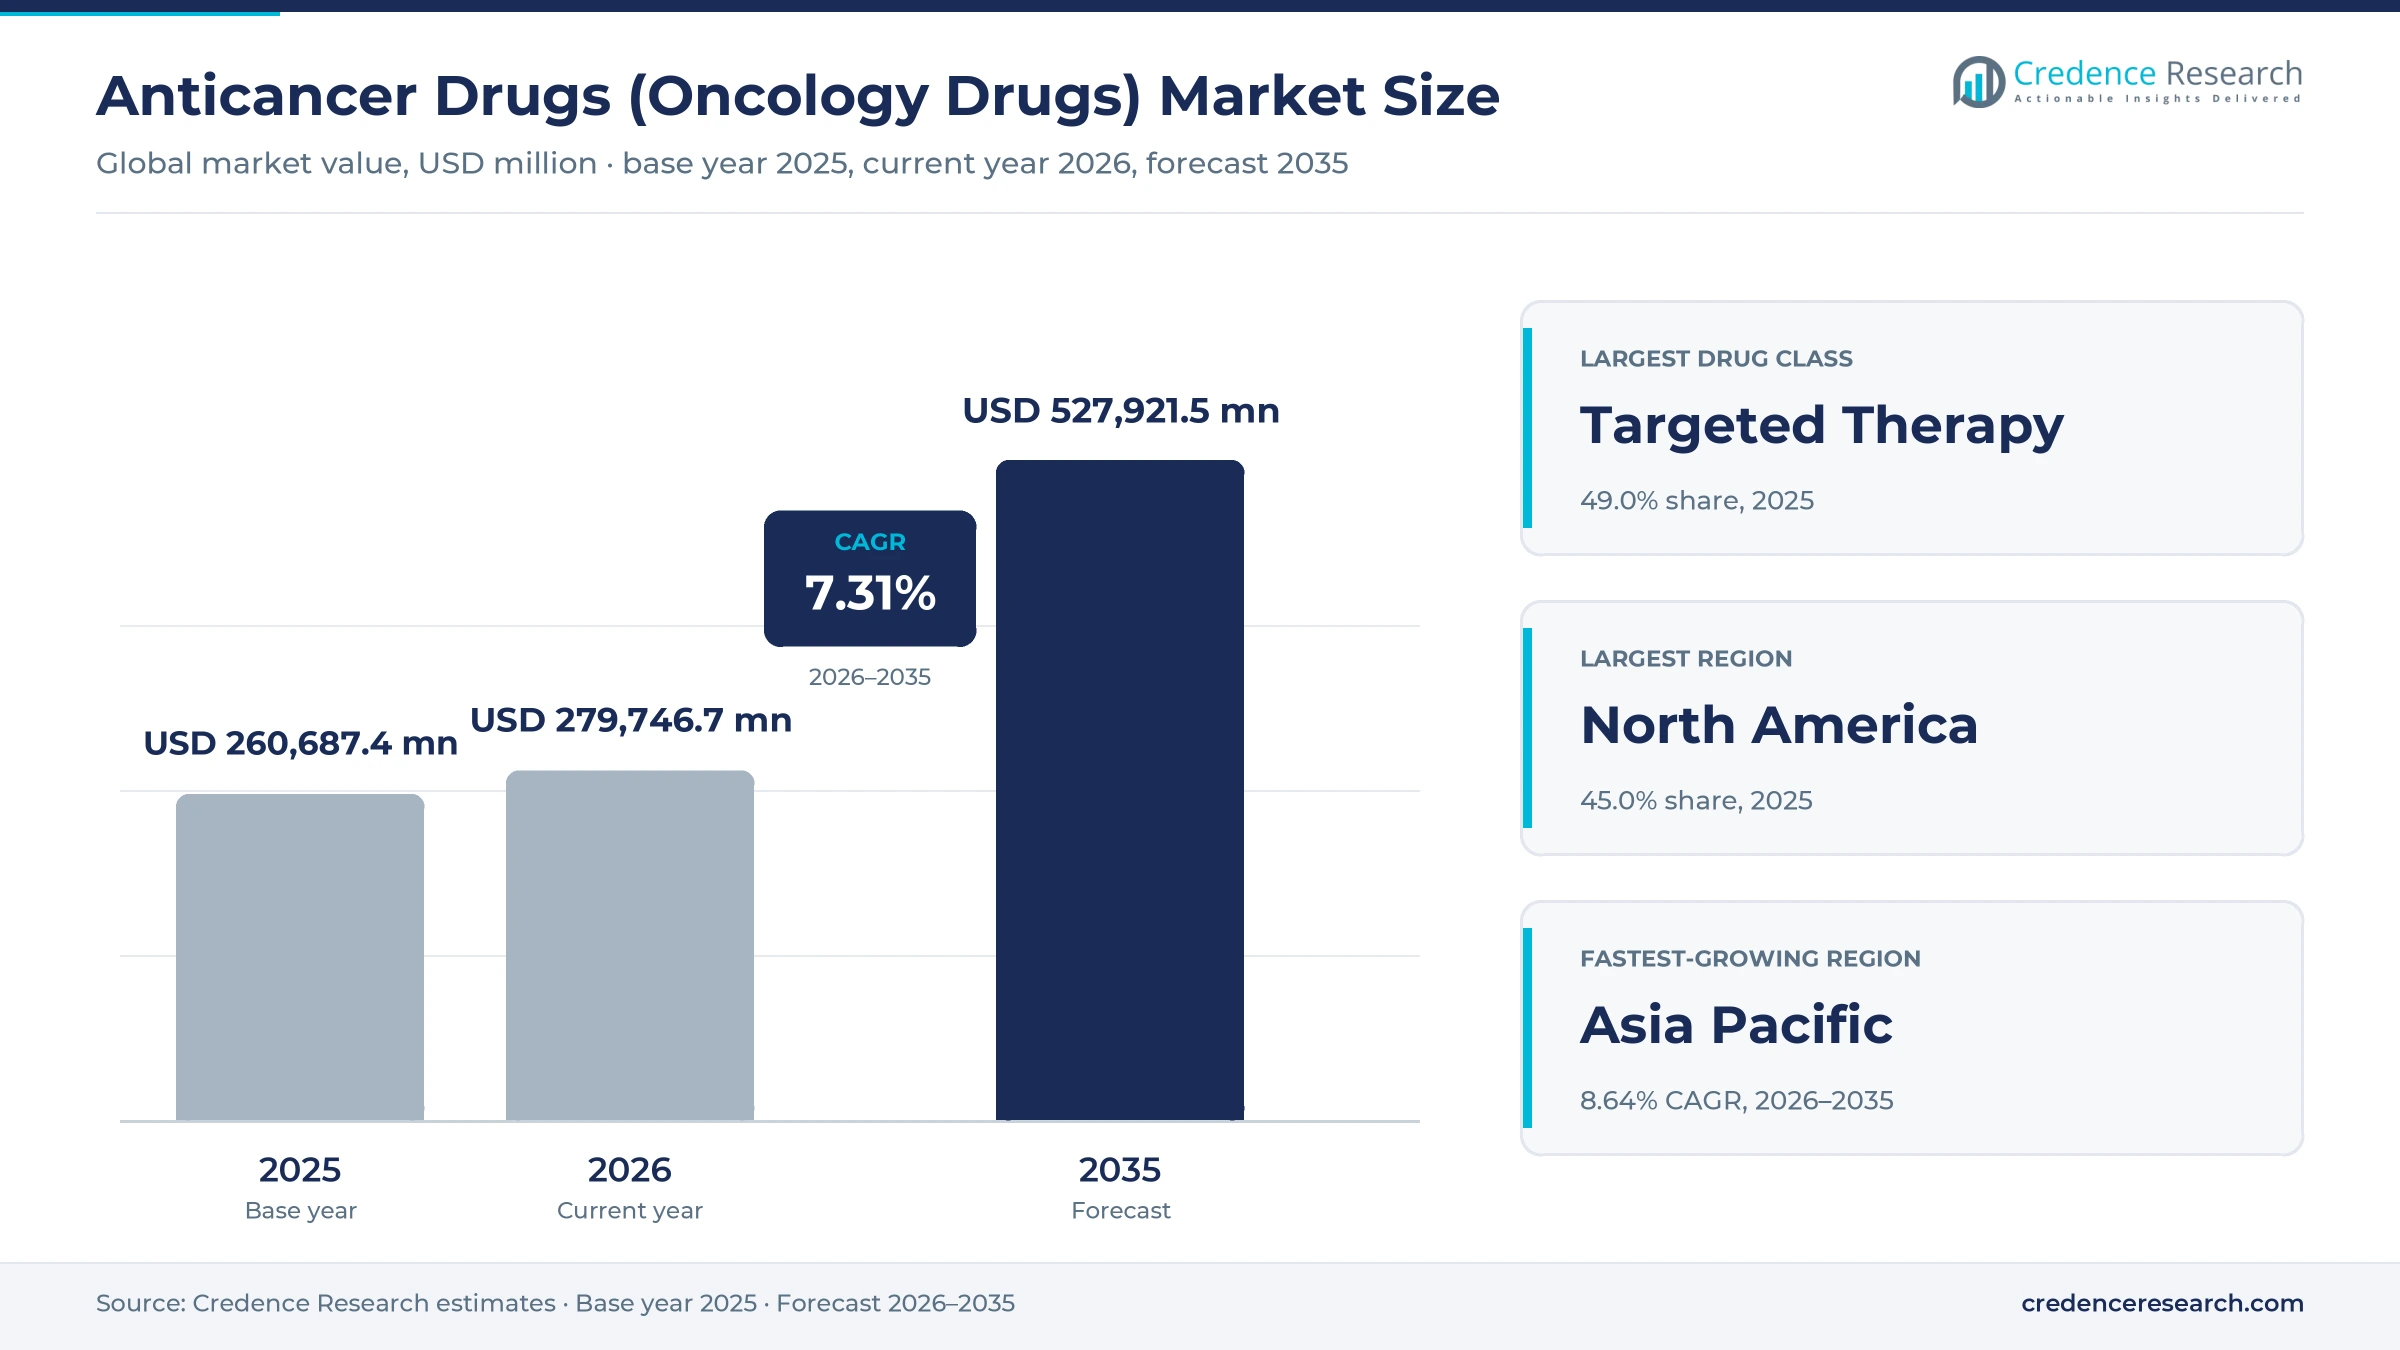
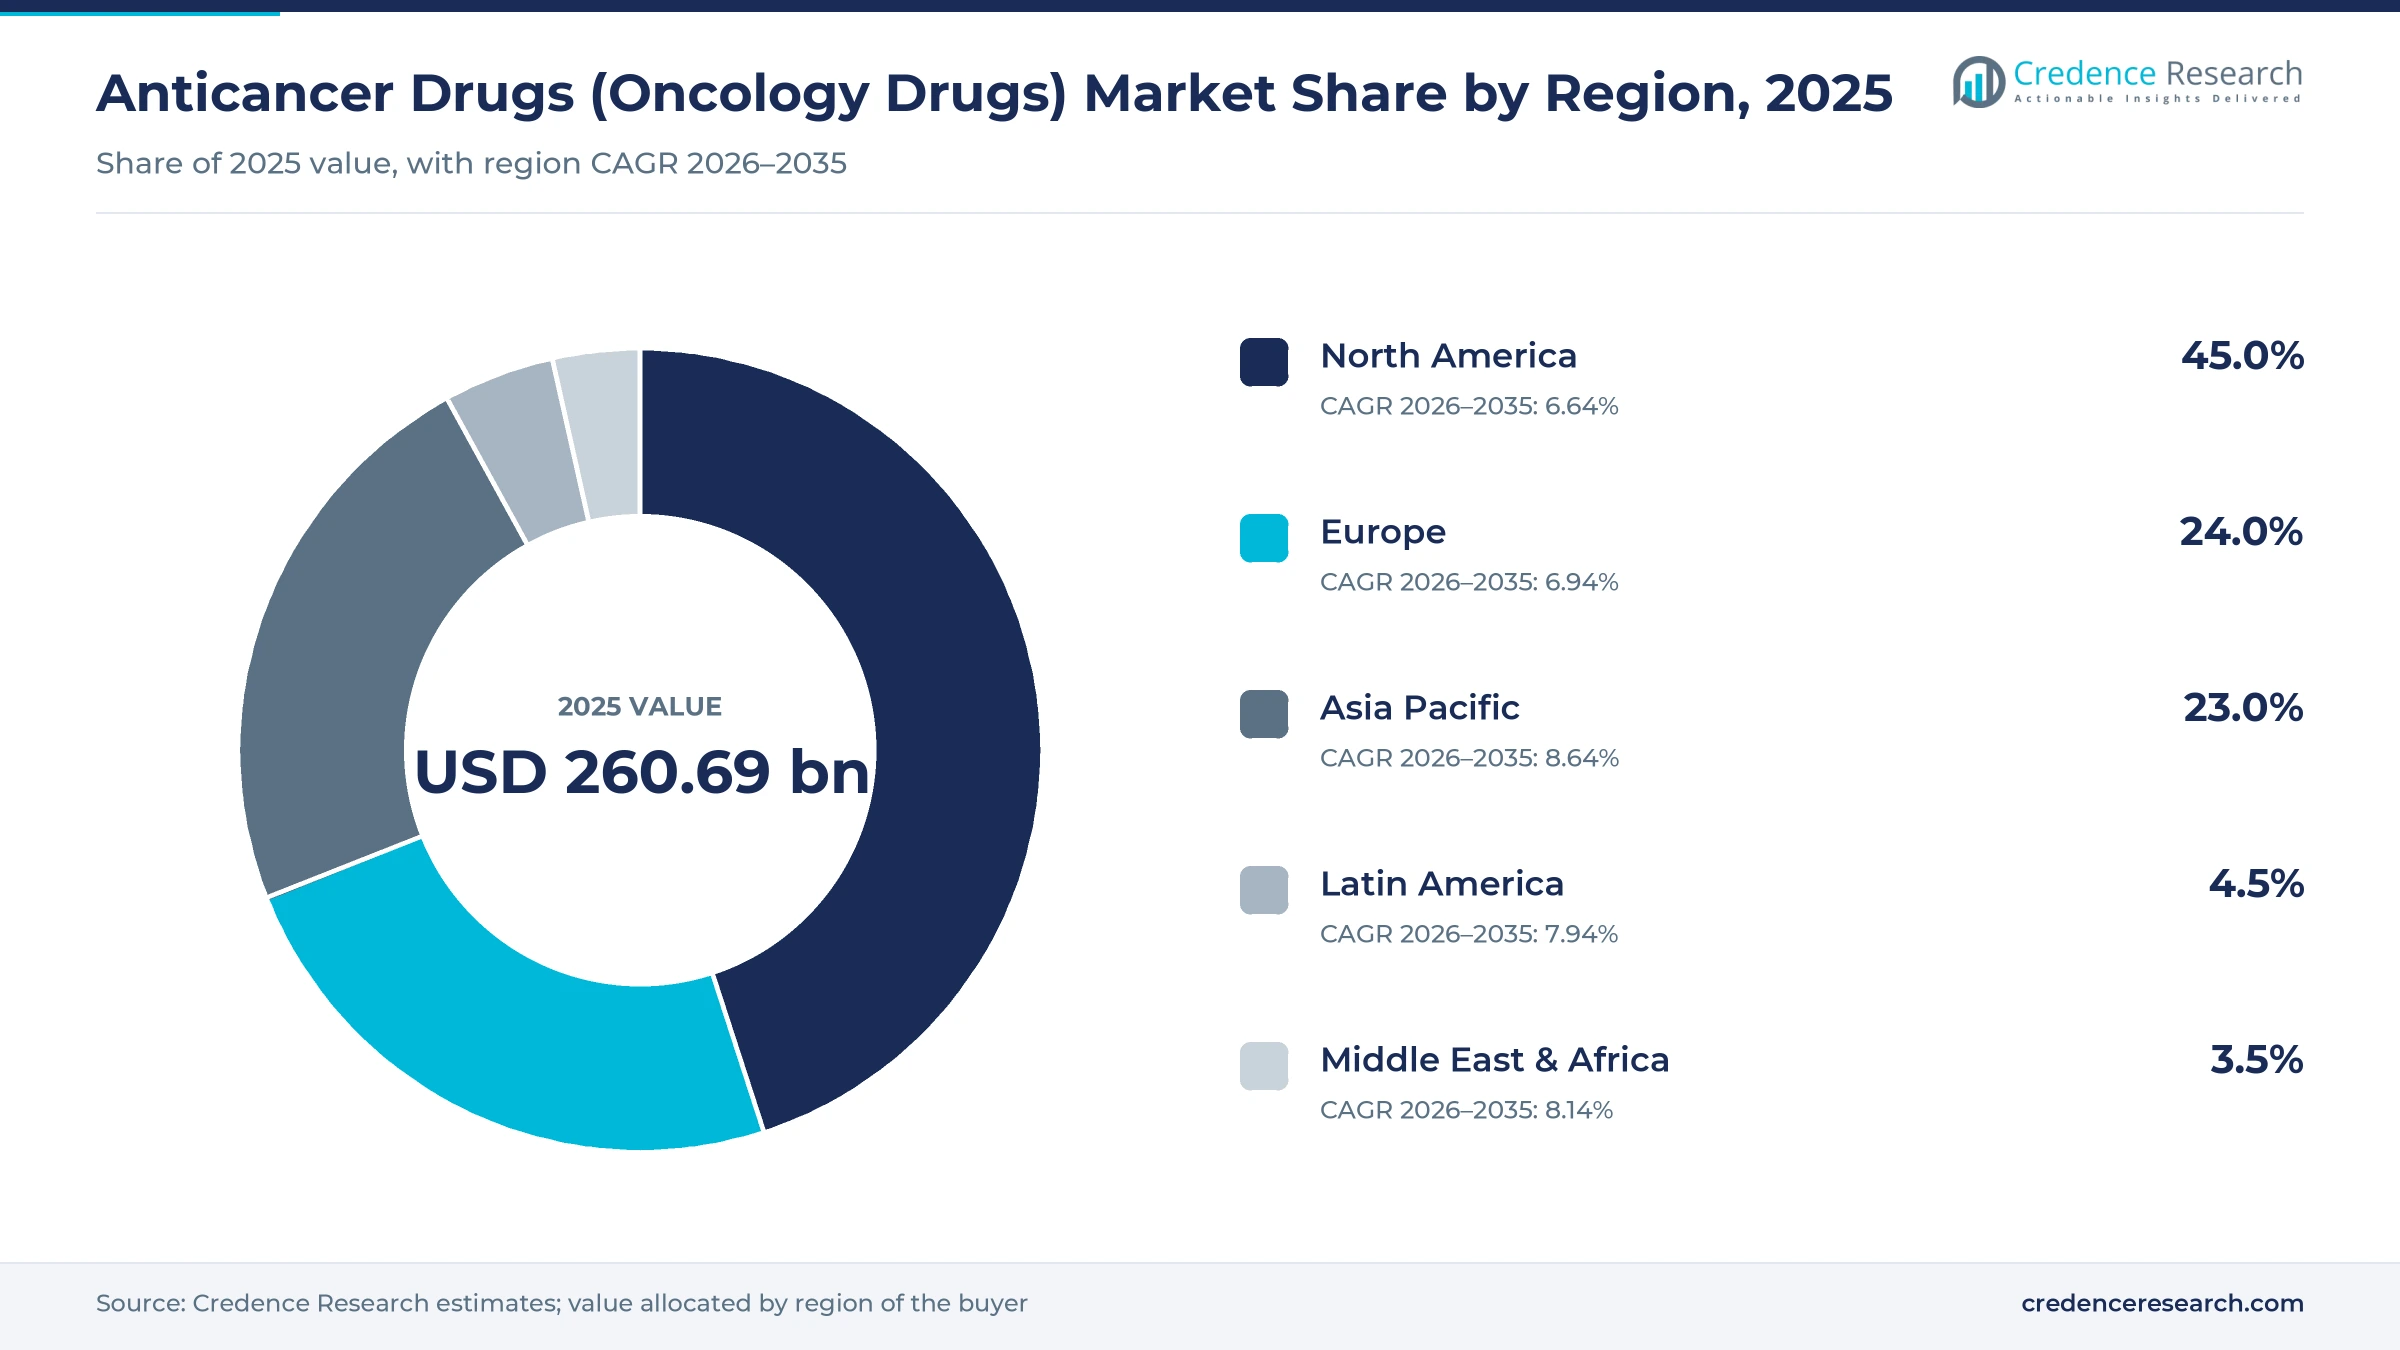
The global anticancer drugs/oncology drugs market was valued at USD 260.69 billion in 2025 and is projected to increase from USD 279.75 billion in 2026 to USD 527.92 billion by 2035, registering a CAGR of 7.31% during 2026–2035. Demand rises with the global cancer burden, longer treatment durations and the shift from chemotherapy toward targeted agents and checkpoint inhibitors. North America held the largest regional share, 45.0% in 2025, because the United States pairs high diagnosis rates with the highest branded prices. Asia Pacific is the fastest-growing region at 8.64% a year as China, Japan and India widen reimbursement for innovative medicines. Subcutaneous versions of leading immunotherapies are changing how infusion centers schedule patients, since a short injection can replace a longer intravenous session. As a result, originators are using new formulations, antibody-drug conjugates and licensing deals to defend franchises that face patent expiry within the forecast period.
Which medicines and buyers does this market count?
The market counts manufacturer sales of prescription medicines used to treat solid tumors and blood cancers in adults and children. It covers cytotoxic chemotherapy, small-molecule and antibody targeted therapies, antibody-drug conjugates, checkpoint inhibitors, bispecific antibodies, cell therapies and hormonal agents. Hospitals, infusion centers and specialty, retail and online pharmacies dispense these medicines, while public health systems, insurers and patients share the cost.
The scope excludes radiation therapy services, surgery, diagnostic tests and supportive-care medicines such as antiemetics and growth factors. Value is counted once at the manufacturer net selling price, so distributor and pharmacy margins are not added. Generics and biosimilars of anticancer drugs are included because they compete directly with originator brands for the same patients.
Anticancer Drugs/Oncology Drugs Market Insights
- The global anticancer drugs/oncology drugs market is projected to grow from USD 260.69 billion in 2025 to USD 527.92 billion by 2035, registering a CAGR of 7.31% during 2026–2035.
- North America held 45.0% of 2025 value, while Asia Pacific grows fastest at 8.64% a year as China and India widen reimbursement for new cancer medicines.
- Targeted Therapy led drug classes with 49.0% of 2025 value, and Immunotherapy is the fastest-growing class at 8.31% a year through 2035.
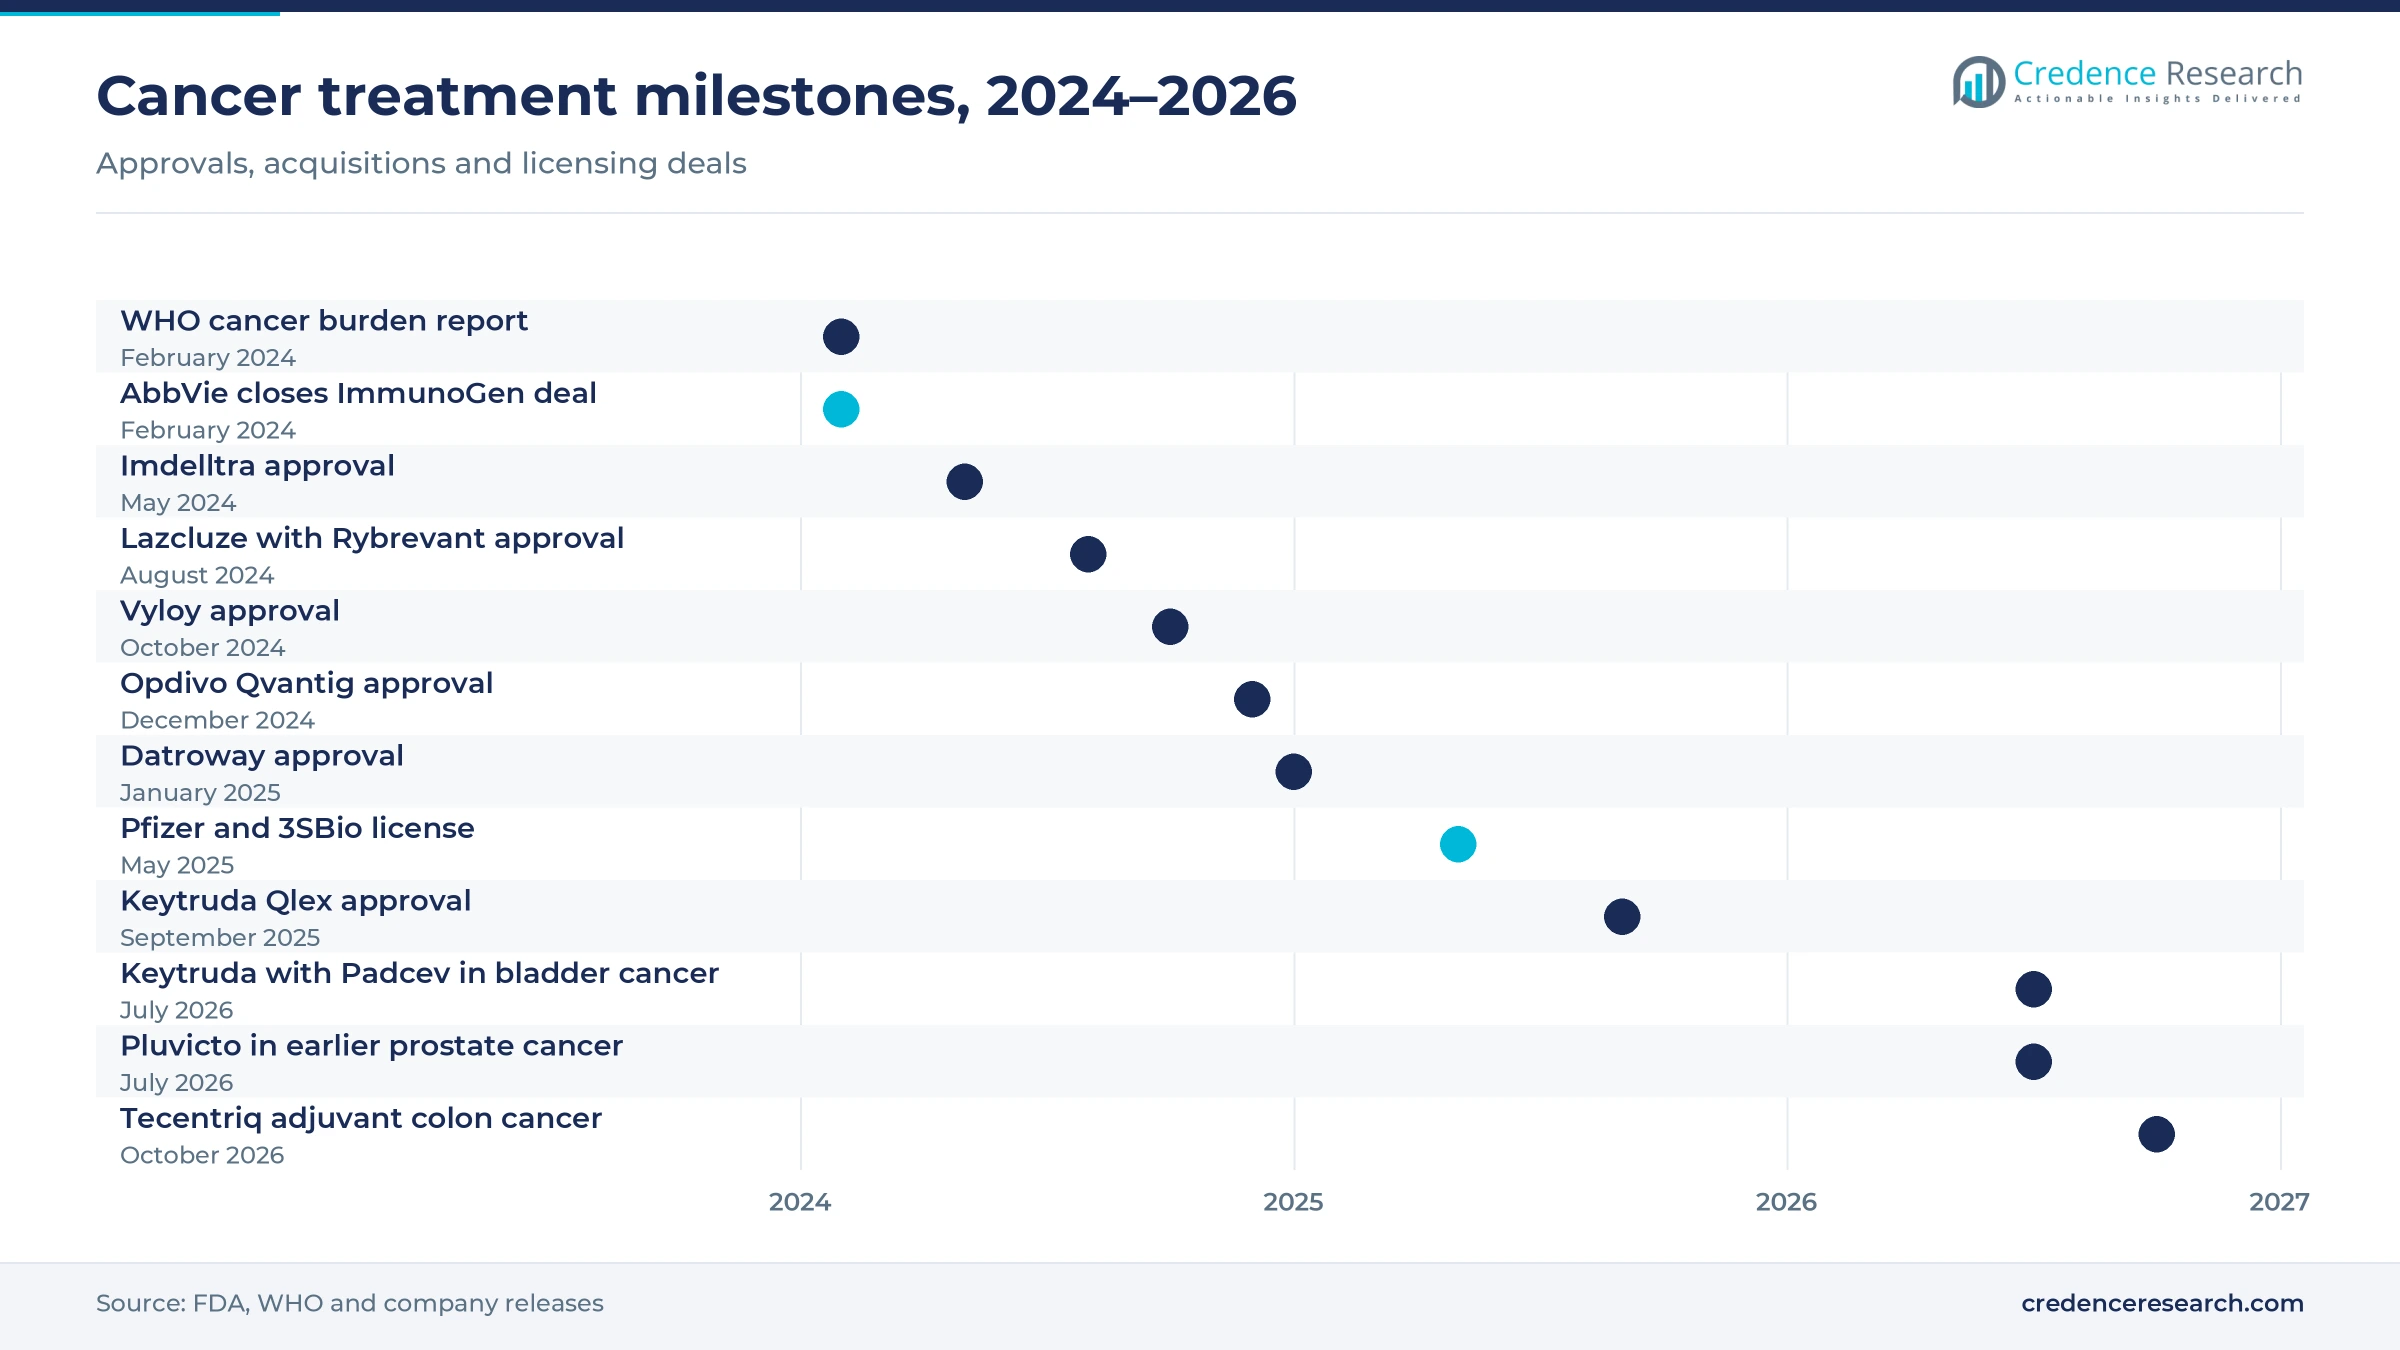
- In September 2025, the FDA approved subcutaneous Keytruda Qlex across most solid tumor indications, which can shorten the time patients spend in infusion chairs.
- AbbVie, Pfizer and other originators are buying or licensing antibody-drug conjugates and bispecific antibodies to replace revenue exposed to upcoming patent expiries.
Targeted therapy leads cancer drug spending
Why does targeted therapy lead the drug classes?
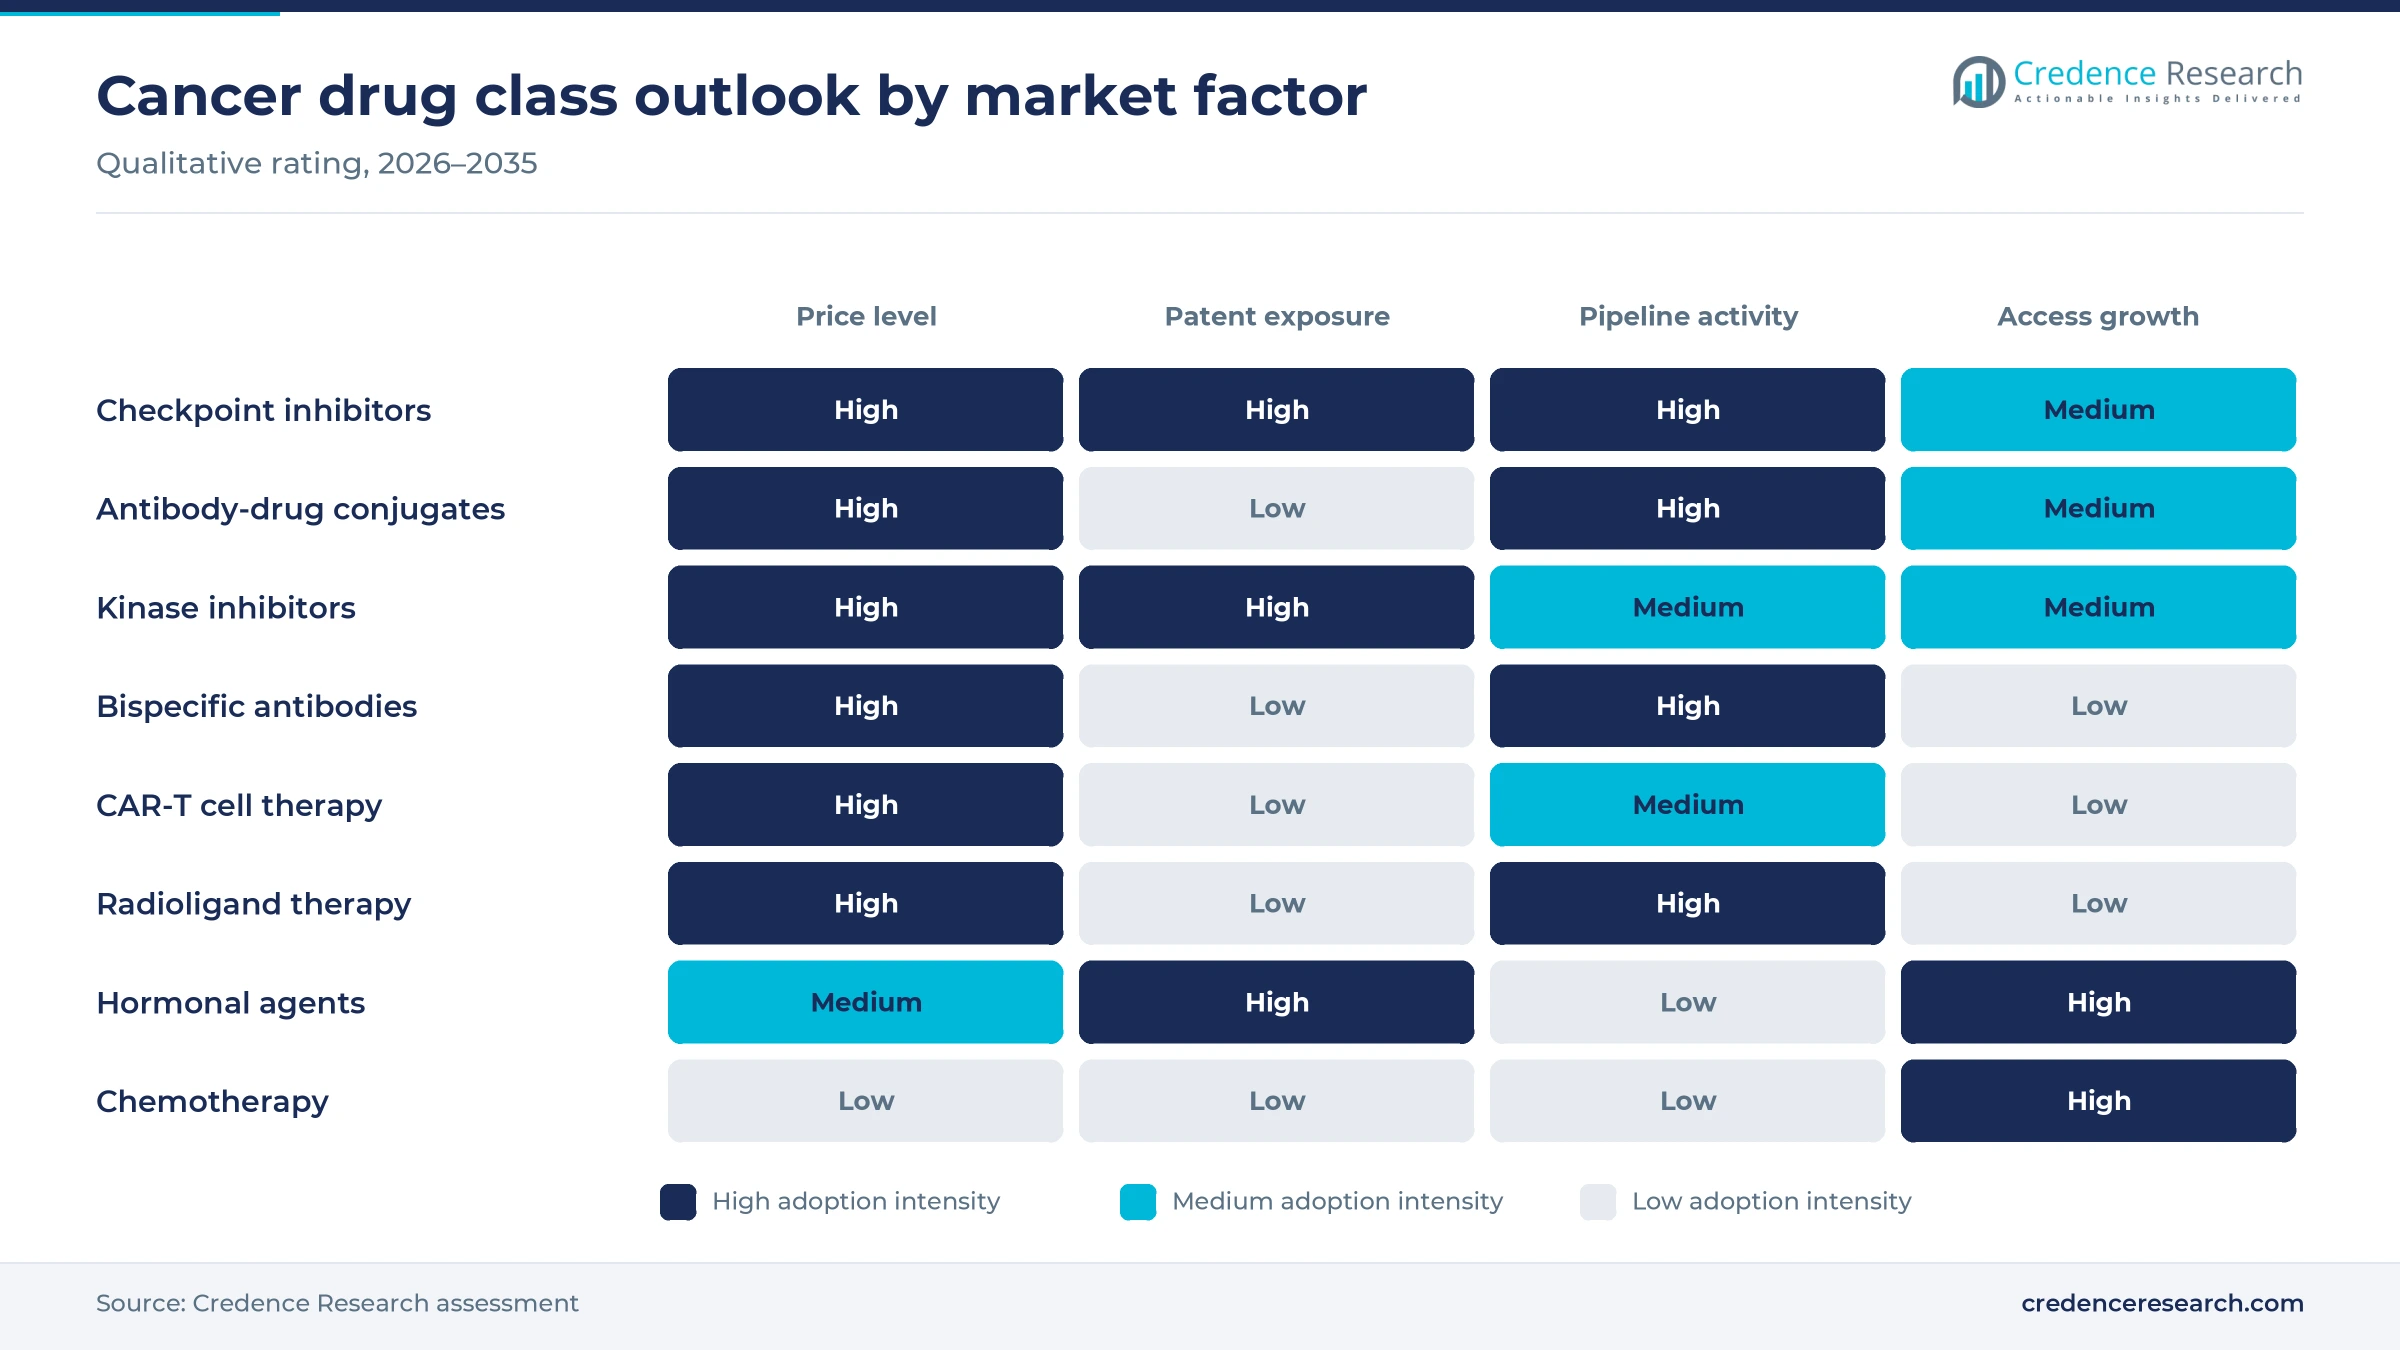
Based on drug class, the market is categorized into chemotherapy, targeted therapy, immunotherapy and others, which include hormonal agents and radiopharmaceuticals. Targeted Therapy led with 49.0% of 2025 value because kinase inhibitors, HER2 and CD38 antibodies and antibody-drug conjugates are used across many tumor types. Immunotherapy grows fastest at 8.31% a year as checkpoint inhibitors move into earlier disease stages. Chemotherapy keeps high volumes but low prices because most agents are generic.
Which cancer types account for the most spending?
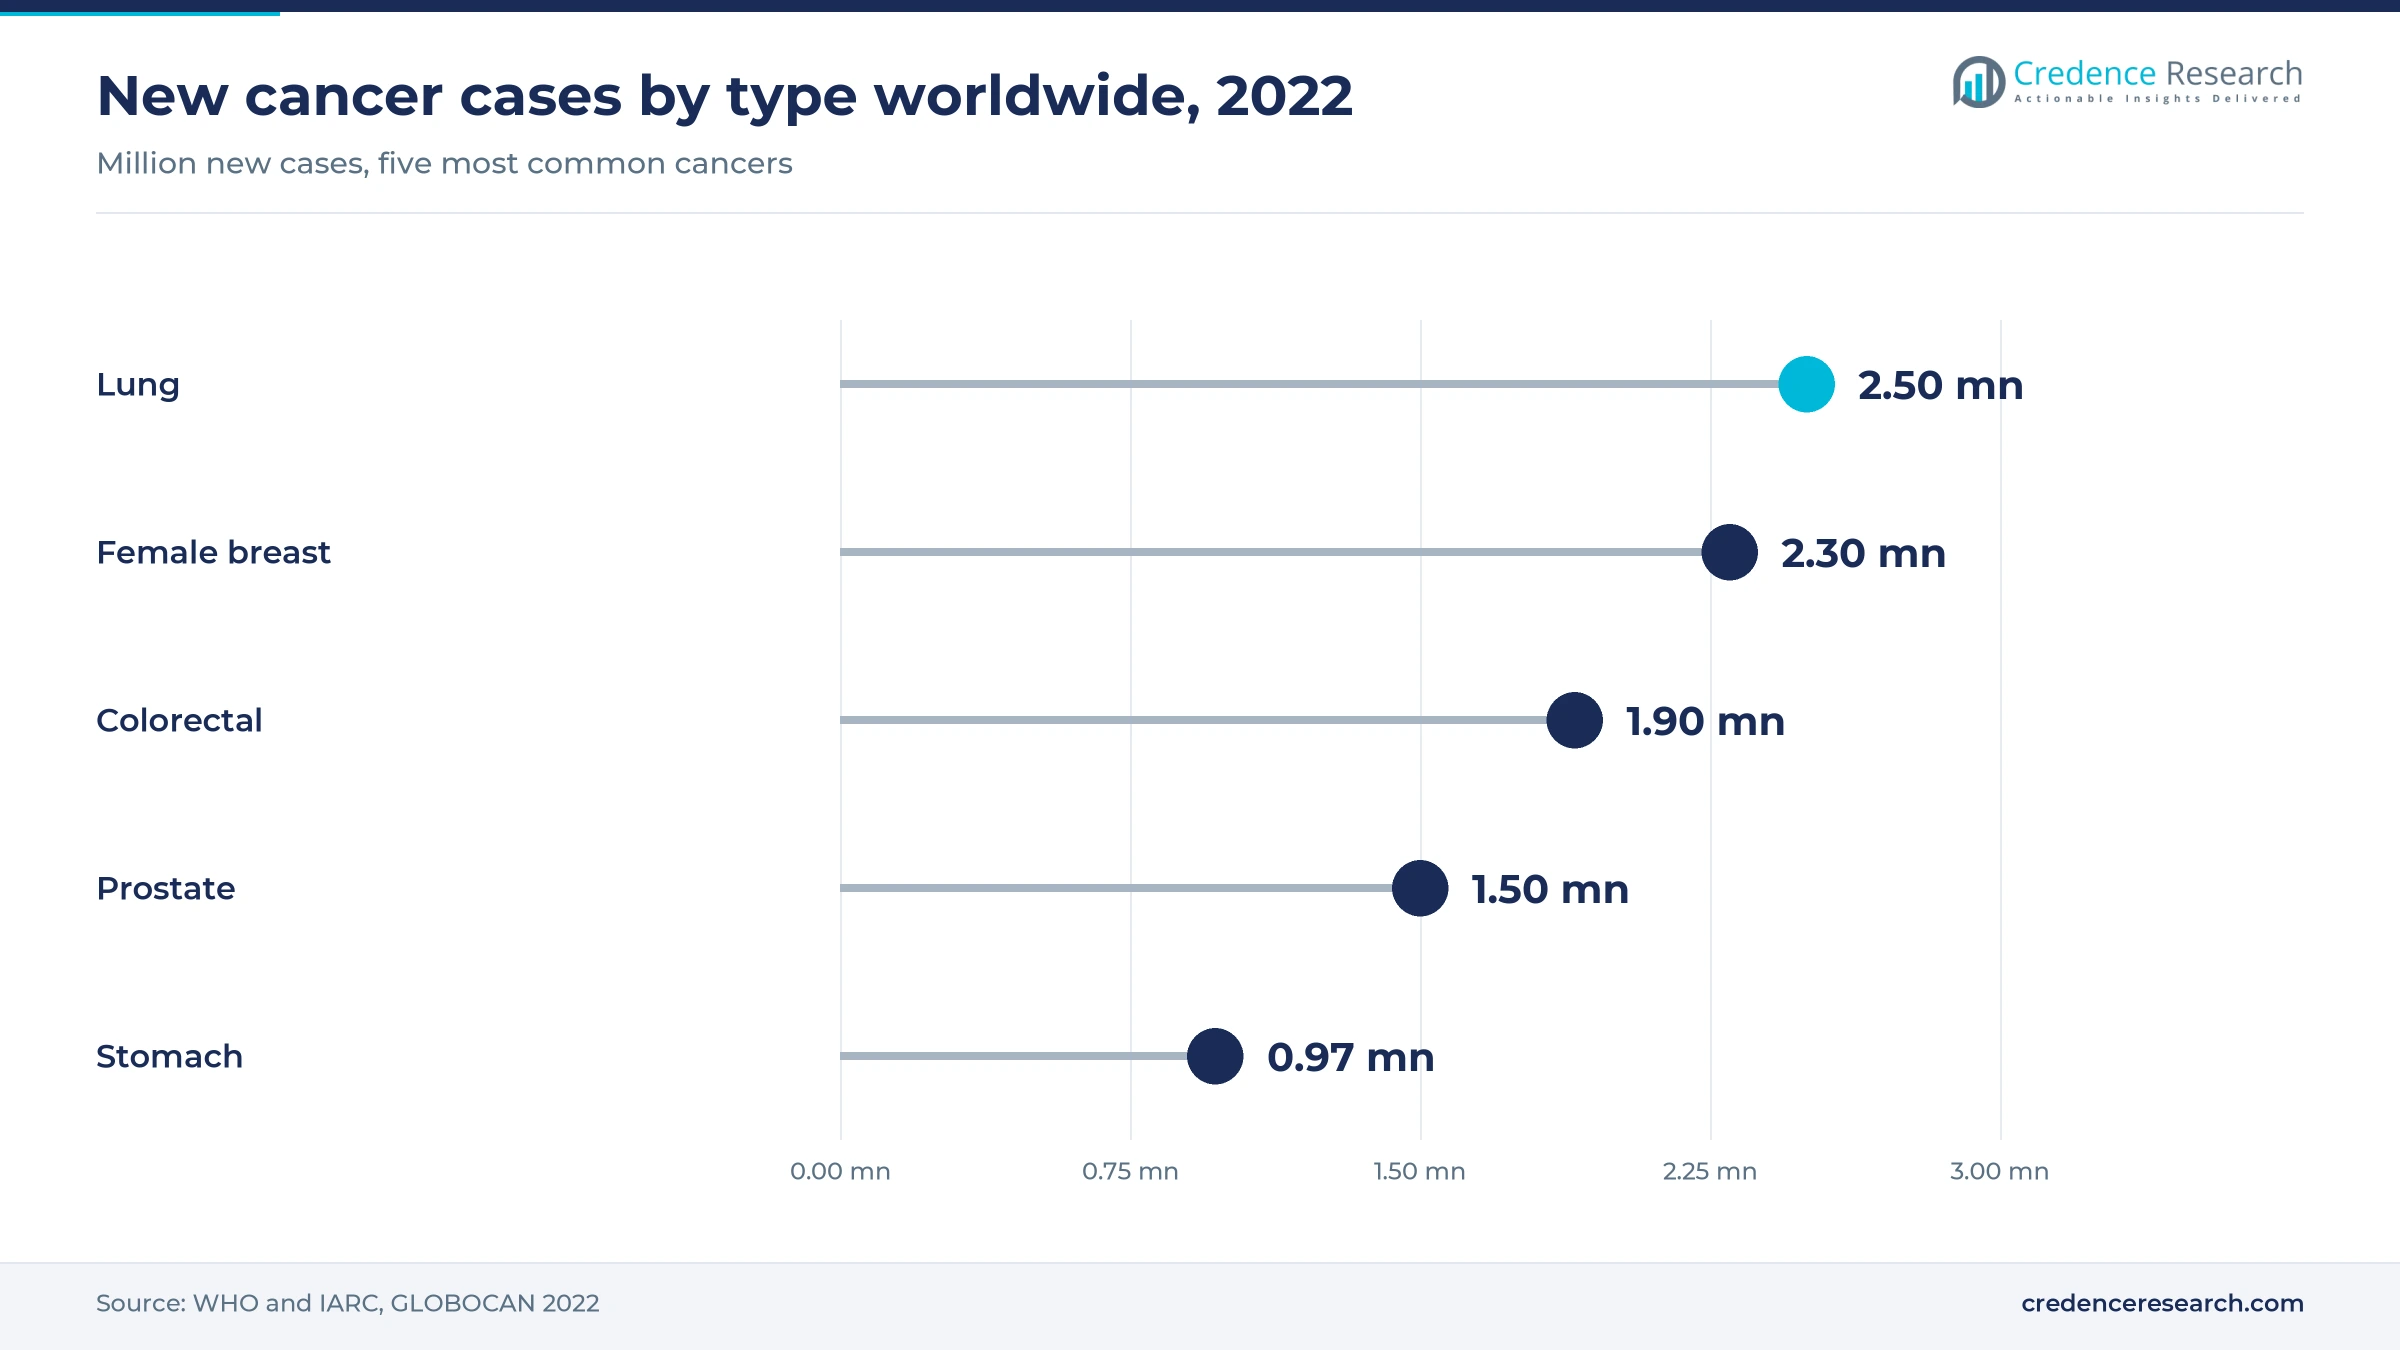
Based on indication, the market is categorized into lung, stomach, colorectal, breast, prostate, liver, esophagus, cervical, kidney and bladder cancers, plus other cancers. Other Cancers held 42.0% of 2025 value because this group includes multiple myeloma, lymphoma, leukemia, melanoma and ovarian cancer. Lung cancer is the largest single tumor type, and spending on lung cancer therapeutics reflects 2.5 million new cases in 2022. Bladder Cancer grows fastest at 8.44% a year as conjugate combinations replace platinum chemotherapy in first-line care.
How do hospital and online pharmacies divide sales?
Based on distribution channel, the market is categorized into hospital pharmacies, retail pharmacies and online pharmacies. Hospital Pharmacies led with 62.0% of 2025 value because most infused and injected cancer medicines are prepared and given in hospitals and infusion centers. Online Pharmacies grow fastest at 9.08% a year as oral targeted therapies reach patients through mail-order specialty pharmacies. Retail pharmacies dispense oral kinase inhibitors and hormonal agents for patients treated at home.
| Segment Group | Leading Sub-segment | Share, 2025 | Fastest-growing Sub-segment | CAGR, 2026–2035 |
|---|---|---|---|---|
| By Drug Class | Targeted Therapy | 49.0% | Immunotherapy | 8.31% |
| By Indication | Other Cancers | 42.0% | Bladder Cancer | 8.44% |
| By Distribution Channel | Hospital Pharmacies | 62.0% | Online Pharmacies | 9.08% |
Request a Free Sample
Fill in your details and we'll send you a free sample report.
- Sample data tables & charts
- Research methodology
Rising incidence and new mechanisms widen treatment
How does the growing cancer burden lift demand?
The growing number of cancer patients is the base driver because every new diagnosis creates demand for drug therapy. The World Health Organization reported in February 2024 that there were 20 million new cancer cases and 9.7 million deaths in 2022. About 1 in 5 people develop cancer in their lifetime, and 53.5 million people were alive within five years of a diagnosis. The same analysis projects 35 million new cases in 2050, a 77% increase that reflects population aging and growth.
Why do earlier-stage approvals expand the treated pool?
Approvals in earlier disease stages extend drug treatment to patients who once received only surgery or chemotherapy. In August 2024, the FDA approved Lazcluze with Rybrevant from Johnson & Johnson for first-line EGFR-mutated non-small cell lung cancer, moving a targeted combination ahead of chemotherapy. Checkpoint inhibitors are also given before and after surgery in lung, breast and bladder cancer. This shift matters because perioperative courses add months of therapy for patients who previously had no drug treatment after surgery.
How do new mechanisms raise value per patient?
New mechanisms raise the value per treated patient because they offer options after earlier therapies stop working. In May 2024, Amgen announced FDA approval of Imdelltra, the first T-cell engager for extensive-stage small cell lung cancer after platinum chemotherapy, giving patients an option where few treatments existed. In October 2024, the FDA approved Vyloy from Astellas with chemotherapy for Claudin 18.2-positive gastric cancer. In turn, each added line of therapy lengthens the period during which a patient uses branded medicines.
Why does broader reimbursement in Asia add patients?
Broader reimbursement in Asia adds patients because national insurance lists now include many innovative cancer medicines once paid out of pocket. China updates its National Reimbursement Drug List every year, and each round adds new cancer medicines at negotiated prices. Japan and South Korea reimburse most new medicines soon after approval, while India relies on public schemes and biosimilars. Asia Pacific already accounted for 23.0% of 2025 demand, and that share rises steadily as coverage widens through 2035.
Subcutaneous dosing and conjugates reshape cancer care
Why are subcutaneous immunotherapies rising?
Subcutaneous versions of leading checkpoint inhibitors are rising because they shorten the time patients spend in infusion chairs. In December 2024, the FDA approved Opdivo Qvantig, a subcutaneous form of nivolumab from Bristol Myers Squibb, across most adult solid tumor uses. Merck announced FDA approval of Keytruda Qlex in September 2025, and the company says a dose can be given in as little as one minute. This shift also lets originators move patients to newer formulations before intravenous patents expire.
How is the rise of antibody-drug conjugates changing treatment?
Antibody-drug conjugates are an emerging treatment backbone because they deliver potent chemotherapy payloads directly to tumor cells that carry a target protein. AbbVie completed its acquisition of ImmunoGen in February 2024, adding Elahere for folate receptor-alpha positive ovarian cancer. AstraZeneca and Daiichi Sankyo extended the class with Datroway, approved in January 2025 for HR-positive, HER2-negative breast cancer. As a result, conjugates are replacing older chemotherapy regimens in several tumor types.
Where do bispecific antibodies open new revenue?
Bispecific antibodies open a new revenue opportunity because a single molecule can block two targets or link immune cells to tumor cells. In May 2025, Pfizer signed an exclusive license agreement with 3SBio for SSGJ-707, a PD-1 and VEGF bispecific antibody, with a USD 1.25 billion upfront payment. This deal shows that originators will pay large sums for assets that could succeed current checkpoint inhibitors. Companies that secure these assets early can compete in first-line lung cancer and other large indications within the forecast period.
How can biosimilars widen access in emerging markets?
Biosimilars create an opportunity to widen access because they lower the cost of established antibodies such as trastuzumab, bevacizumab and rituximab. Health systems in Latin America, the Middle East and Asia use these lower prices to treat more patients within fixed budgets. Because the leading checkpoint inhibitor patents expire before 2035, the next wave of biosimilar entry will cover high-value immunotherapies. Manufacturers with large antibody capacity are best placed to capture this volume across price-sensitive markets.
Price negotiation and patent expiry pressure originators
How does price negotiation limit revenue growth?
Government price negotiation is a growing constraint because cancer medicines account for a large part of public drug spending. In the United States, the Inflation Reduction Act lets Medicare negotiate prices for selected high-spend medicines, and cancer brands are among those selected. Europe already relies on health technology assessment and reference pricing to cap launch prices. As a result, originators face slower price growth and must show clearer survival benefits to secure full reimbursement.
Why do patent expiries threaten originator sales?
Patent expiries threaten originator sales because several of the largest cancer brands lose key protection during the forecast period. Pembrolizumab and nivolumab, the two leading checkpoint inhibitors, face biosimilar entry in the United States from around 2028. Several kinase inhibitors and CDK4/6 inhibitors will also meet generic competition before 2035. However, volume tends to rise after generic entry, so total patient numbers grow even as the value of each treatment course falls.
How do high treatment costs restrict access?
High treatment costs restrict access because many new cancer medicines cost more than annual household income in low- and middle-income countries. WHO survey data released in 2024 show wide gaps between countries in the coverage of cancer services within health benefit packages. As a result, patients in Africa and parts of South Asia often receive older chemotherapy regimens or no systemic treatment. Tiered pricing, voluntary licensing and donation programs close this gap only partly and slowly.
What clinical and supply risks slow uptake?
Clinical and supply risks slow uptake because complex biologics and cell therapies require specialized manufacturing and careful patient monitoring. CAR-T cell therapy needs individualized production and treatment at certified centers, which limits capacity in many countries. Generic chemotherapy also faces periodic shortages when a few sterile injectable plants stop production for quality problems. These constraints delay treatment, raise hospital costs and push buyers toward suppliers with reliable multi-site networks.
The United States sets prices while Asia adds patients
| Region | Value, 2025 (USD billion) | Share, 2025 | CAGR, 2026–2035 |
|---|---|---|---|
| North America | 117.31 | 45.0% | 6.64% |
| Europe | 62.56 | 24.0% | 6.94% |
| Asia Pacific | 59.96 | 23.0% | 8.64% |
| Latin America | 11.73 | 4.5% | 7.94% |
| Middle East & Africa | 9.12 | 3.5% | 8.14% |
Why does North America hold the largest share?
North America held 45.0% of 2025 value and grows at 6.64% a year, the slowest pace among regions as negotiated prices and biosimilars arrive. The United States sets the highest list prices for new cancer medicines and approves many of them first, so launches reach patients there earlier than elsewhere. Canada adds steady demand through provincial cancer agencies that fund hospital-administered therapies. As a result, the region keeps the largest share through 2035 even as its lead slowly narrows.
How does health technology assessment shape Europe?
Europe accounted for 24.0% of 2025 value and grows at 6.94% a year, held back by health technology assessment and reference pricing. Germany, France, Italy, Spain and the United Kingdom account for most regional spending, and biosimilar uptake is faster than in the United States. The EU joint clinical assessment, which began for new cancer medicines in January 2025, aims to shorten the gap between approval and patient access. In turn, access to new medicines should become more even across the 27 member states.
Why is Asia Pacific the fastest-growing region?
Asia Pacific represented 23.0% of 2025 value and is the fastest-growing region at 8.64% a year. China has the largest number of new cancer cases in the world, and its annual reimbursement list updates bring new medicines to millions of insured patients. Japan is a large, high-value market with rapid price listing of approved medicines, while India and Southeast Asia rely more on generics and biosimilars. As a result, the region adds more treated patients than any other region through 2035.
How are Brazil and Mexico expanding cancer care?
Latin America held 4.5% of 2025 value and grows at 7.94% a year as Brazil and Mexico expand public cancer programs. Brazil is the largest market in the region, and its public health system buys biosimilars and generics through centralized tenders. Private insurers in Brazil, Mexico and Colombia cover more branded immunotherapies, although currency swings can delay purchases.
Where is demand growing in the Middle East & Africa?
The Middle East & Africa accounted for 3.5% of 2025 value and grows at 8.14% a year from a small base. Saudi Arabia, the United Arab Emirates and Israel buy most branded medicines in the region through government and insurance programs. Much of Africa still lacks pathology and treatment capacity, so demand there depends on investment in diagnosis and cancer centers.
Approvals and deals that shaped cancer treatment since 2024
| Development | Status and market relevance |
|---|---|
| In May 2025, Pfizer signed an exclusive license agreement with 3SBio for the PD-1 and VEGF bispecific antibody SSGJ-707. | Signed; the USD 1.25 billion upfront payment signals demand for next-generation immunotherapy |
| In September 2025, Merck announced FDA approval of Keytruda Qlex for subcutaneous use across most solid tumor indications in patients aged 12 and older. | Approved; shortens administration and supports a shift before intravenous patent expiry |
| In July 2026, the FDA approved Keytruda or Keytruda Qlex with Padcev before and after surgery for all cystectomy-eligible muscle invasive bladder cancer. | Approved; widens perioperative use of a conjugate and checkpoint inhibitor combination |
| In July 2026, the FDA approved Pluvicto from Novartis with androgen receptor pathway inhibitor therapy for PSMA-positive hormone-sensitive metastatic prostate cancer. | Approved; moves radioligand therapy into an earlier and larger patient group |
| In October 2026, the FDA approved Tecentriq from Roche with chemotherapy as adjuvant treatment for Stage III mismatch repair deficient colon cancer. | Approved; brings a checkpoint inhibitor into curative-intent colorectal care |
Conjugates, bispecifics and radioligands lead the next wave
- Antibody-drug conjugates link a targeting antibody to a cytotoxic payload, which lets higher doses reach tumor cells while sparing more healthy tissue.
- Bispecific antibodies bind two targets at once, either redirecting T cells to tumors or blocking two growth signals with one molecule.
- Radioligand therapies deliver radiation directly to cancer cells that carry markers such as PSMA in prostate cancer, using a targeting molecule as the carrier.
- Cell therapies reprogram the immune cells of each patient and are moving from blood cancers toward solid tumors in clinical trials.
- Subcutaneous formulations turn long infusions into short injections, which frees infusion capacity and supports care closer to home.
Need a Custom Version of This Report?
Tailor the scope, geography, or segments to your exact requirements.
- Custom geography or segment scope
- Direct access to our analyst team
Originators defend franchises through deals and new forms
Competition centers on a small group of originators that hold the leading immune checkpoint inhibitors, kinase inhibitors and antibody-drug conjugates. Merck, Bristol Myers Squibb, Roche and AstraZeneca compete for first-line positions in lung, breast and bladder cancer through large outcome trials. Novartis, Pfizer and Johnson & Johnson rely on targeted agents, radioligands and bispecific antibodies, while Amgen and Astellas build positions in specific tumor types. Because several top brands lose patent protection after 2028, companies are buying or licensing late-stage assets from biotech firms and Chinese developers. Subcutaneous formulations and fixed-dose combinations help originators keep patients as biosimilars approach. Price negotiation in the United States and health technology assessment in Europe reward companies that show overall survival gains. As a result, scale in clinical development, manufacturing and market access matters as much as the science.
Companies profiled and their roles in this market
| Company | Type | Role in the market |
|---|---|---|
| AstraZeneca plc | Originator | Tagrisso and Imfinzi, plus Enhertu and Datroway with Daiichi Sankyo |
| Novartis AG | Originator | Kisqali in breast cancer and Pluvicto radioligand therapy |
| Merck & Co., Inc. | Originator | Keytruda and Keytruda Qlex across solid tumors |
| Amgen | Originator and biosimilar maker | Imdelltra, Blincyto and cancer biosimilars |
| Pfizer Inc. | Originator | Antibody-drug conjugates and the licensed bispecific SSGJ-707 |
| AbbVie Inc. | Originator | Venclexta, Imbruvica and Elahere |
| Astellas Pharma Inc. | Originator | Xtandi, Padcev and Vyloy |
| F. Hoffmann-La Roche Ltd. | Originator | Tecentriq, Phesgo and Polivy |
| Johnson & Johnson | Originator | Darzalex, Carvykti, Rybrevant and Lazcluze |
| Bristol-Myers Squibb Company | Originator | Opdivo, Opdivo Qvantig and Breyanzi |
Where value in cancer medicines is moving next
Credence Research's view is that value in oncology drugs will shift from single blockbuster brands toward portfolios of conjugates, bispecific antibodies and subcutaneous formulations. The market grows at 7.31% a year to 2035 even though the largest checkpoint inhibitors face biosimilars, because new mechanisms keep adding lines of therapy. Asia Pacific provides most of the volume growth, while the United States still sets launch prices for new medicines. Companies that combine deal capacity with late-stage trial execution are best placed, and buyers should expect sharper price competition once biosimilar pembrolizumab and nivolumab arrive after 2028.
How the oncology drugs estimates were built
The report uses 2025 as the base year and forecasts values for 2026 to 2035 in current U.S. dollars. Market values come from the Credence Research model, which combines treated patient estimates, therapy duration and net prices by drug class and region. Regional, drug class, indication and channel splits are Credence Research estimates. Inputs were drawn from WHO cancer statistics, FDA approval notices, company annual reports and press releases, and public reimbursement documents. No primary interviews or surveys were used in this edition.
What the next decade holds for cancer medicines
By 2035, the oncology drugs market is projected to reach USD 527.92 billion, with immunotherapy and targeted therapy accounting for most new value. Subcutaneous and combination products will protect part of originator revenue as biosimilar checkpoint inhibitors enter after 2028. Antibody-drug conjugates and bispecific antibodies are expected to move into first-line treatment of lung, breast and gastrointestinal cancers. Asia Pacific will gain share as reimbursement widens in China and India, while North America remains the largest region by value. Price negotiation and health technology assessment will keep pressure on net prices throughout the period.
Frequently Asked Questions
How big is the global anticancer drugs market?
Which region leads the anticancer drugs market?
Which drug class holds the largest share of oncology drugs?
Which cancer types account for the most spending?
What is driving growth in anticancer drugs?
How will patent expiries affect the market?
Which distribution channel leads the market?
Who are the leading companies in this market?
Table of Content
Chapter 1 Market Segmentation
- 1.1 Segmentation Framework
- 1.1.1 Product and Service Classification
- 1.1.2 Application and End-Use Classification
- 1.1.3 Technology and Solution Classification
- 1.1.4 Customer and Distribution Channel Classification
- 1.1.5 Geographic Segmentation
- 1.1.6 Market Segment Definitions and Boundaries
- 1.2 By Drug Class
- 1.2.1 Chemotherapy
- 1.2.2 Targeted Therapy
- 1.2.3 Immunotherapy
- 1.2.4 Others
- 1.3 By Indication
- 1.3.1 Lung Cancer
- 1.3.2 Stomach Cancer
- 1.3.3 Colorectal Cancer
- 1.3.4 Breast Cancer
- 1.3.5 Prostate Cancer
- 1.3.6 Liver Cancer
- 1.3.7 Esophagus Cancer
- 1.3.8 Cervical Cancer
- 1.3.9 Kidney Cancer
- 1.3.10 Bladder Cancer
- 1.3.11 Other Cancers
Chapter 2 Introduction
- 2.1 Report Objectives and Scope
- 2.2 Product Definition and Industry Terminology
- 2.3 Market Inclusions and Exclusions
- 2.4 Research Process
- 2.4.1 Primary Research and Expert Interviews
- 2.4.2 Secondary Research and Source Review
- 2.4.3 Top-Down and Bottom-Up Estimation
- 2.4.4 Data Triangulation and Verification
- 2.5 Market Size Measurement Basis
- 2.5.1 2025: USD 260.69 billion → 2035: USD 527.92 billion
- 2.6 Historical and Forecast Reference Periods
- 2.6.1 Historical Period: 2018-2025
- 2.6.2 Base Year: 2025
- 2.6.3 Forecast Period: 2025-2035
- 2.7 Research Assumptions and Limitations
Chapter 3 Executive Summary
- 3.1 Market Snapshot and Key Findings
- 3.2 Base-Year Market Size, 2025
- 3.3 Forecast Market Size, 2035
- 3.4 Revenue and Volume Growth Outlook
- 3.5 Key Demand and Supply Indicators
- 3.6 Leading Market Segments
- 3.7 Fastest-Growing Market Opportunities
- 3.8 Regional Performance Highlights
- 3.9 Technology and Industry Transformation
- 3.10 Competitive Landscape Summary
- 3.11 Analyst View and Strategic Implications
Chapter 4 Global Anticancer Drugs/Oncology Drugs Market Trends and Developments
- 4.1 Historical Industry Development, 2018-2025
- 4.2 Recent Market Trends and Developments
- 4.3 Demand and Customer Behavior Trends
- 4.4 Technology and Product Innovation
- 4.5 Artificial Intelligence, Automation and Digitalization
- 4.6 Local Manufacturing and Supply Chain Realignment
- 4.7 Industry Partnerships, Mergers and Acquisitions
- 4.8 Sustainability and Circular Economy Developments
- 4.9 Government and Private Sector Investment Trends
- 4.10 Emerging Business Models and Commercialization
- 4.11 Industry Developments and Announcements
Chapter 5 Global Anticancer Drugs/Oncology Drugs Market Production, Supply and Demand Analysis
- 5.1 Demand Trend and Consumption Analysis, 2018-2025
- 5.2 Demand Forecast, 2025-2035
- 5.3 Production and Output Trend, 2018-2025
- 5.4 Production and Output Forecast, 2025-2035
- 5.5 Installed Capacity and Capacity Utilization
- 5.6 Company-Wise Production Plants and Statistics
- 5.6.1 Installed Production Capacity
- 5.6.2 Actual Production
- 5.6.3 Planned Capacity and Expansion Targets
- 5.7 Supply Chain Structure and Procurement Trends
- 5.8 Supply-Demand Gap and Bottlenecks
- 5.9 Import Dependence and Sourcing Structure
- 5.10 Contract Manufacturing and Outsourcing
- 5.11 Regional Supply and Demand Concentration
Chapter 6 Global Anticancer Drugs/Oncology Drugs Market Pricing Analysis
- 6.1 Pricing Structure and Measurement
- 6.2 Historical Pricing Trends, 2018-2025
- 6.3 Pricing Outlook, 2025-2035
- 6.4 Average Selling Price and Unit Economics
- 6.5 Pricing by Product and Market Segment
- 6.6 Geographic Pricing Differences
- 6.7 Key Input, Energy, Labor and Logistics Costs
- 6.8 Contract Pricing and Purchasing Models
- 6.9 Pricing Sensitivity and Competitive Positioning
- 6.10 Price, Margin and Profitability Implications
Chapter 7 Global Anticancer Drugs/Oncology Drugs Market Dynamics
- 7.1 Market Growth Drivers
- 7.1.1 Demand-Side Drivers
- 7.1.2 Technology and Innovation Drivers
- 7.1.3 Infrastructure and Investment Drivers
- 7.1.4 Regulatory and Policy Drivers
- 7.2 Market Restraints
- 7.2.1 Cost and Affordability Constraints
- 7.2.2 Technology and Adoption Barriers
- 7.2.3 Supply Chain and Operational Constraints
- 7.3 Market Challenges
- 7.3.1 Competitive Pressure and Margin Erosion
- 7.3.2 Skills, Infrastructure and Implementation Gaps
- 7.4 Emerging Market Opportunities
- 7.5 Market Dynamics Impact and Time-Horizon Assessment
Chapter 8 Global Anticancer Drugs/Oncology Drugs Value Chain Analysis
- 8.1 Industry Value Chain Overview
- 8.2 Upstream Suppliers and Critical Inputs
- 8.3 Technology and Component Providers
- 8.4 Manufacturing or Service Delivery
- 8.5 Distribution, Channel Partners and Integrators
- 8.6 Downstream Applications and End Users
- 8.7 Value Addition and Profit Pools
- 8.8 Vertical Integration and Outsourcing
- 8.9 Supplier Concentration and Risk
- 8.10 Supply Chain Localization and Resilience
Chapter 9 Global Anticancer Drugs/Oncology Drugs Market Regulations and Policies
- 9.1 Relevant Laws, Standards and Compliance Frameworks
- 9.2 Product, Service, Safety and Quality Requirements
- 9.3 Government Policies, Incentives and Subsidies
- 9.4 Imports, Exports and Trade Barriers
- 9.5 Public Procurement and Local Content Requirements
- 9.6 Environmental and Sustainability Compliance
- 9.7 Upcoming Policy Changes and Market Implications
Chapter 10 Global Anticancer Drugs/Oncology Drugs Market Hotspots and Opportunities
- 10.1 Market Opportunity Mapping and Growth Hotspots
- 10.2 High-Growth Applications and Customer Groups
- 10.3 Underserved Markets and White-Space Opportunities
- 10.4 Emerging Technology and Product Opportunities
- 10.5 New Capacity and Investment Hotspots
- 10.6 Market Entry and Expansion Opportunities
- 10.7 Distribution and Partnership Opportunities
- 10.8 Near-Term and Long-Term Commercial Potential
- 10.9 Opportunity Attractiveness and Execution Risks
Chapter 11 Global Anticancer Drugs/Oncology Drugs Market Outlook, 2025-2035
- 11.1 Market Size and Analysis
- 11.1.1 Revenue (Market Measurement: 2025: USD 260.69 billion → 2035: USD 527.92 billion)
- 11.1.2 Market Volume and Quantity Sold
- 11.1.3 Historical Market Size, 2018-2025
- 11.1.4 Base-Year Market Size, 2025
- 11.2 Market Forecast, 2025-2035
- 11.2.1 Revenue Forecast to 2035
- 11.2.2 Volume Forecast to 2035
- 11.2.3 CAGR and Year-on-Year Growth
- 11.2.4 Incremental Revenue Opportunity
- 11.3 Forecast Assumptions and Scenario Analysis
- 11.3.1 Base-Case Forecast
- 11.3.2 Optimistic and Conservative Scenarios
- 11.3.3 Technology, Pricing and Policy Sensitivities
- 11.4 Market Attractiveness and Growth Outlook
Chapter 12 Global Anticancer Drugs/Oncology Drugs Market Segmentation and Outlook
- 12.1 Segmentation Summary and Market Shares, 2025
- 12.2 Largest and Fastest-Growing Segments
- 12.3 By Drug Class - Market Size and Forecast, 2025-2035
- 12.3.1 Segment Definition and Scope
- 12.3.2 Historical Market Size, 2018-2025
- 12.3.3 Revenue Forecast, 2025-2035
- 12.3.4 Volume Forecast, 2025-2035
- 12.3.5 Base-Year Market Share, 2025
- 12.3.6 Segment CAGR and Growth Drivers
- 12.3.7 Subsegment Market Size and Forecast
- 12.3.7.1 Chemotherapy
- 12.3.7.2 Targeted Therapy
- 12.3.7.3 Immunotherapy
- 12.3.7.4 Others
- 12.3.8 Subsegment Pricing and Adoption Trends
- 12.3.9 Leading Suppliers and Competition
- 12.3.10 Regional Demand and Opportunities
- 12.4 By Indication - Market Size and Forecast, 2025-2035
- 12.4.1 Segment Definition and Scope
- 12.4.2 Historical Market Size, 2018-2025
- 12.4.3 Revenue Forecast, 2025-2035
- 12.4.4 Volume Forecast, 2025-2035
- 12.4.5 Base-Year Market Share, 2025
- 12.4.6 Segment CAGR and Growth Drivers
- 12.4.7 Subsegment Market Size and Forecast
- 12.4.7.1 Lung Cancer
- 12.4.7.2 Stomach Cancer
- 12.4.7.3 Colorectal Cancer
- 12.4.7.4 Breast Cancer
- 12.4.7.5 Prostate Cancer
- 12.4.7.6 Liver Cancer
- 12.4.7.7 Esophagus Cancer
- 12.4.7.8 Cervical Cancer
- 12.4.7.9 Kidney Cancer
- 12.4.7.10 Bladder Cancer
- 12.4.7.11 Other Cancers
- 12.4.8 Subsegment Pricing and Adoption Trends
- 12.4.9 Leading Suppliers and Competition
- 12.4.10 Regional Demand and Opportunities
- 12.5 Segment Growth Comparison
- 12.6 Segment Attractiveness and Priority Matrix
Chapter 13 Global Anticancer Drugs/Oncology Drugs Geographic Market Outlook, 2025-2035
- 13.1 Regional Market Size and Share, 2025
- 13.2 Regional Market Forecast, 2025-2035
- 13.3 Regional Pricing, Production and Demand Differences
- 13.4 North America
- 13.4.1 United States
- 13.4.2 Canada
- 13.4.3 Mexico
- 13.5 Europe
- 13.5.1 Germany
- 13.5.2 France
- 13.5.3 Italy
- 13.5.4 United Kingdom
- 13.5.5 Spain
- 13.5.6 Poland
- 13.5.7 Russia
- 13.5.8 Netherlands
- 13.5.9 Belgium
- 13.5.10 Sweden
- 13.5.11 Denmark
- 13.5.12 Norway
- 13.5.13 Rest of Europe
- 13.6 Asia Pacific
- 13.6.1 China
- 13.6.2 India
- 13.6.3 Japan
- 13.6.4 South Korea
- 13.6.5 Thailand
- 13.6.6 Indonesia
- 13.6.7 Vietnam
- 13.6.8 Malaysia
- 13.6.9 Australia
- 13.6.10 Rest of Asia Pacific
- 13.7 Latin America
- 13.7.1 Brazil
- 13.7.2 Argentina
- 13.7.3 Colombia
- 13.7.4 Chile
- 13.7.5 Rest of Latin America
- 13.8 Middle East
- 13.8.1 Saudi Arabia
- 13.8.2 United Arab Emirates
- 13.8.3 Turkey
- 13.8.4 Israel
- 13.8.5 Iran
- 13.8.6 Rest of the Middle East
- 13.9 Africa
- 13.9.1 South Africa
- 13.9.2 Egypt
- 13.9.3 Nigeria
- 13.9.4 Morocco
- 13.9.5 Rest of Africa
- 13.10 Regional Investment, Policy and Supply Chain Differences
- 13.11 Regional Competitive Landscape
- 13.12 Geographic Growth Hotspots
Chapter 14 Global Anticancer Drugs/Oncology Drugs Technology, Innovation and Sustainability Outlook
- 14.1 Technology Landscape and Maturity
- 14.2 Product, Process and Service Innovation
- 14.3 AI, Automation and Digital Tools in the Industry
- 14.4 Technology Adoption and Performance Benchmarking
- 14.5 Innovation Pipeline and R&D Investment
- 14.6 Patent and Intellectual Property Trends
- 14.7 Energy Efficiency and Resource Management
- 14.8 Sustainability, Recycling and Circularity
- 14.9 Technology Roadmap, 2025-2035
- 14.10 Risks of Obsolescence and Technology Substitution
Chapter 15 Global Anticancer Drugs/Oncology Drugs Market Key Strategic Imperatives
- 15.1 Growth and Market Entry Priorities
- 15.2 High-Return Products and Segments
- 15.3 Pricing, Profitability and Cost Optimization
- 15.4 Technology Investment and Product Differentiation
- 15.5 Supply Chain Localization and Resilience
- 15.6 Distribution and Customer Acquisition
- 15.7 Partnership, Acquisition and Capacity Strategy
- 15.8 Regional Expansion Priorities
- 15.9 Short-, Medium- and Long-Term Actions
Chapter 16 Competition Outlook
- 16.1 Industry Competition Characteristics
- 16.2 Market Structure and Concentration
- 16.3 Market Share and Competitive Positioning, 2025
- 16.4 Company-Wise Revenue and Product Benchmarking
- 16.5 Production and Service Capacity Benchmarking
- 16.6 Technology, Pricing and Differentiation
- 16.7 Regional Footprint and Distribution Strength
- 16.8 Mergers, Acquisitions and Strategic Alliances
- 16.9 New Entrants and Competitive Threats
- 16.10 Porter's Five Forces and Industry Attractiveness
- 16.11 Competitive Outlook, 2025-2035
Chapter 17 Company Profiles
- 17.1 Company Coverage and Selection Criteria
- 17.2 AstraZeneca plc
- 17.2.1 Business Description
- 17.2.2 Company Ownership and Geographic Presence
- 17.2.3 Product and Service Portfolio
- 17.2.4 Manufacturing and Operating Footprint
- 17.2.5 Production Capacity and Expansion Plans
- 17.2.6 Financial Performance and Investment
- 17.2.7 Market Share and Competitive Position
- 17.2.8 Technology and Innovation Capabilities
- 17.2.9 Strategic Alliances or Partnerships
- 17.2.10 Recent Developments
- 17.2.11 Growth Strategy and Outlook
- 17.3 Novartis AG
- 17.4 Merck & Co., Inc.
- 17.5 Amgen
- 17.6 Pfizer Inc.
- 17.7 AbbVie Inc.
- 17.8 Astellas Pharma Inc.
- 17.9 F. Hoffmann-La Roche Ltd.
- 17.10 Johnson & Johnson
- 17.11 Bristol-Myers Squibb Company
- 17.12 Other Relevant Market Participants
Note: Every listed company is profiled on the structure shown under the first company. The company list is preliminary and may change based on research findings, market developments, data availability and client requirements.
Chapter 18 Disclaimer
- 18.1 Research and Forecast Disclaimer
- 18.2 Data Source and Estimation Limitations
Note: The depth of individual sections depends on data availability for this market. Volume, capacity, trade and other unit-based metrics are included where applicable.

