
Cancer Diagnostic Market Overview:
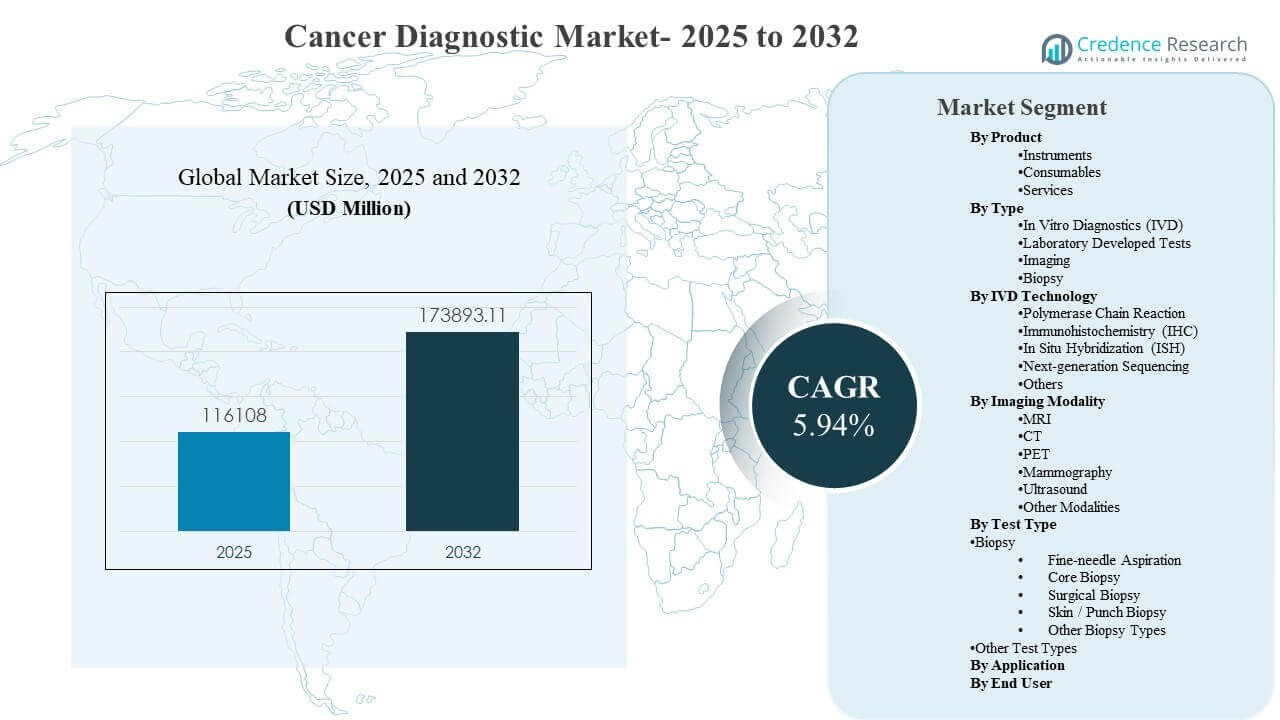
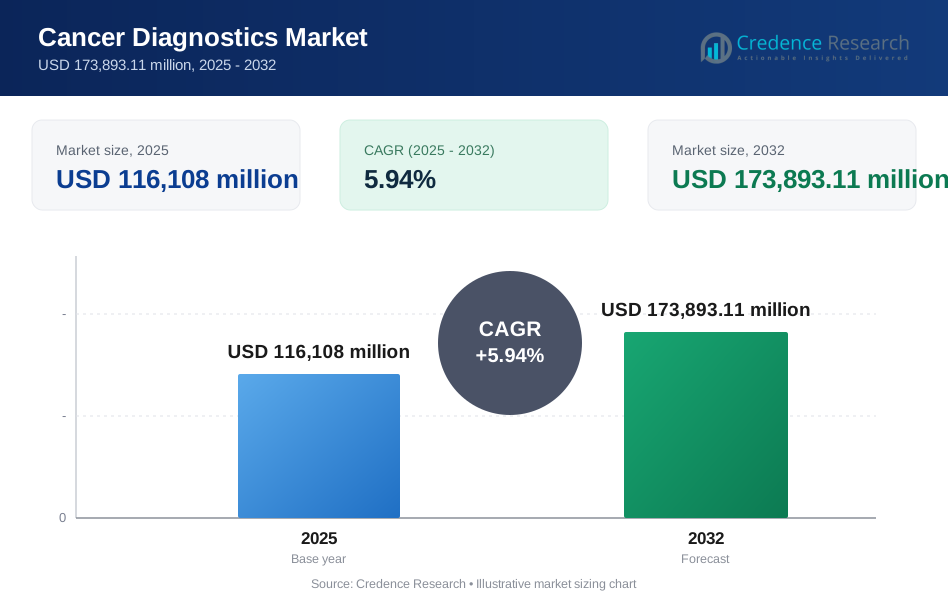
The global Cancer Diagnostic Market size was estimated at USD 116,108 million in 2025 and is expected to reach USD 173,893.11 million by 2032, growing at a CAGR of 5.94% from 2025 to 2032. Growth is primarily driven by expanding screening and early-detection programs combined with rising adoption of biomarker-guided oncology pathways that increase diagnostic intensity per patient across imaging, pathology, and molecular testing. North America continues to represent the largest demand center supported by mature reimbursement, high testing penetration, and broad access to advanced imaging and laboratory infrastructure.
| REPORT ATTRIBUTE | DETAILS |
|---|---|
| Historical Period | 2020-2024 |
| Base Year | 2025 |
| Forecast Period | 2026-2032 |
| Cancer Diagnostic Market Size 2025 | USD 116,108 million |
| Cancer Diagnostic Market, CAGR | 5.94% |
| Cancer Diagnostic Market Size 2032 | USD 173,893.11 million |
Key Market Trends & Insights
- The Cancer Diagnostic Market is projected to expand at a CAGR of 5.94% during 2025–2032, supported by increasing testing volumes across screening and therapy-selection pathways.
- North America accounted for 38.9% of the Cancer Diagnostic Market in 2025, reflecting higher per-capita diagnostic utilization and established clinical pathways.
- Consumables accounted for 57.9% share in 2025, supported by recurring purchase cycles for kits, reagents, antibodies, and probes tied to routine testing throughput.
- Imaging accounted for 62.8% share in 2025, reflecting ongoing reliance on CT, MRI, PET, mammography, and ultrasound across detection, staging, and surveillance.
- Laboratories / Diagnostic Laboratories accounted for 54.1% share in 2025, driven by centralized processing capacity, standardized workflows, and high-throughput molecular and pathology testing.
Segment Analysis
Cancer diagnostics demand is increasingly shaped by patient preference and provider workflow priorities that favor faster, less invasive, and more informative testing. Adoption of non-invasive colorectal cancer screening tests has reinforced a shift toward earlier identification of disease, improving downstream confirmatory testing volumes and increasing the number of patients entering structured diagnostic pathways. Growing payer and provider focus on measurable clinical performance also supports broader use of validated assays and standardized laboratory workflows that reduce repeat testing and shorten turnaround times.
Cancer diagnostics buying behavior also reflects a growing reliance on multi-modality decision-making, where imaging identifies suspicious lesions and laboratory testing confirms malignancy and profiles biomarkers for treatment selection. Companion diagnostics partnerships and broader genotyping access expand routine use of molecular testing, increasing consumables intensity and driving demand for lab automation and interoperability. Expanding minimal residual disease testing initiatives further support high-sensitivity assay adoption across solid tumors and hematologic cancers, reinforcing the role of specialized laboratories and integrated testing networks.
By Product Insights
Consumables accounted for the largest share of 57.9% in 2025. High and recurring test volumes across screening, diagnosis, and monitoring create steady demand for kits, reagents, antibodies, and probes used in routine workflows. Increasing biomarker breadth and panel complexity raise consumables usage per patient episode, especially in molecular and immunoassay testing. Standardization across platforms also strengthens purchasing preference for validated, instrument-compatible consumables that support consistent performance.
By Type Insights
Imaging accounted for the largest share of 62.8% in 2025. Imaging remains central to initial detection, staging, and treatment response assessment across most solid tumors, sustaining high utilization across hospital radiology and outpatient imaging centers. Capacity expansion and replacement cycles for advanced imaging systems support throughput and clinical confidence. Wider use of software-enabled interpretation and workflow tools also improves efficiency and supports continued imaging demand in oncology pathways.
By IVD Technology Insights
IVD technology mix is shaped by the need to combine sensitivity, clinical utility, and scalability across biomarker-driven care pathways. Immunohistochemistry and in situ hybridization remain foundational for tissue-based profiling and therapy selection in many cancers, supported by standardized staining and interpretation workflows. Next-generation sequencing adoption continues to rise for broader genotyping, especially where targeted therapies require multi-gene insights. PCR, immunoassays, flow cytometry, and microarrays remain important across specific clinical contexts where speed, cost, or disease type drives technology choice.
By Imaging Modality Insights
Imaging modality demand is driven by clinical pathway requirements for detection, localization, staging, and follow-up. CT and MRI are widely used for anatomical assessment and treatment planning, with PET supporting functional imaging and staging in selected cancers. Mammography remains central to breast screening and diagnostic workups, sustaining high routine volumes. Ultrasound retains strong utility for guidance and lesion characterization due to accessibility and workflow integration across care settings.
By Application Insights
Breast Cancer accounted for the largest share of 19.1% in 2025. High screening penetration and structured diagnostic follow-up pathways sustain consistent imaging and tissue-testing volumes in breast cancer care. Diagnostic intensity also remains elevated due to frequent use of multimodal imaging, biopsy confirmation, and biomarker profiling for therapy selection. Ongoing improvements in imaging quality and workflow efficiency further support continued utilization across screening and diagnosis programs.
By End User Insights
Laboratories / Diagnostic Laboratories accounted for the largest share of 54.1% in 2025. Centralized laboratories enable scaled, high-throughput processing across molecular, immunoassay, and pathology workflows, improving efficiency and turnaround times for providers. Increasing reliance on specialized testing and interpretive services supports steady sample flow from hospitals and clinics into diagnostic lab networks. Quality systems and standardized protocols also reinforce repeat purchasing behavior for validated assays and compatible consumables.
Cancer Diagnostic Market Drivers
Expansion of Screening and Early-Detection Programs
Cancer screening programs continue to widen eligibility and expand testing pathways, increasing the number of patients entering diagnostic funnels earlier in the disease course. Earlier identification raises demand for confirmatory diagnostics such as imaging workups, tissue sampling, and molecular profiling. Growth in non-invasive screening options also increases population participation, improving test volumes that feed downstream diagnostics. Rising awareness campaigns and physician guideline adoption further reinforce routine testing, particularly for breast, colorectal, and lung cancer pathways.
- For instance, GRAIL's Galleri multi-cancer early detection test, evaluated across 35,878 participants in the PATHFINDER 2 study, detected approximately three times as many cancers when added to standard-of-care screening, with over 53.5% of newly identified cancers caught at Stage I or II and a specificity of 99.6%.
Rising Use of Biomarker-Guided Treatment Selection
Oncology care increasingly depends on biomarker evidence to select targeted therapies and optimize treatment sequencing across tumor types. Broader panel testing increases the number of assays performed per patient and supports higher utilization of tissue and liquid-based molecular diagnostics. Companion diagnostic alignment with therapy labels strengthens clinical pull-through and improves standardization across sites. Continued growth in precision oncology therefore supports both testing volumes and the value mix toward higher-complexity assays.
Technology Upgrades Across Imaging and Pathology Workflows
Healthcare providers continue to invest in imaging upgrades and advanced pathology capabilities to improve diagnostic accuracy, reduce delays, and strengthen throughput. Enhanced image quality and workflow tools increase efficiency in detection, staging, and monitoring, reinforcing imaging utilization across care settings. In pathology, automation and digital workflows support scalability and consistency in interpretation. These technology improvements also reduce repeat testing and improve care coordination, supporting sustained purchasing of instruments and workflow-compatible consumables.
- For instance, Philips' CT 5300 scanner, powered by Precise Image AI reconstruction, delivers up to 85% lower image noise and 60% better low-contrast detectability at 80% lower radiation dose, while its automated positioning software reduces scan setup time by up to 23%.
Centralization and Network Scaling of Diagnostic Laboratories
Diagnostic laboratories benefit from economies of scale that improve cost per test and accelerate adoption of advanced assays across large sample networks. Centralized processing increases demand for standardized reagents and validated kits due to quality and reproducibility requirements. Consolidation also supports investment in automation, data systems, and expanded menus that improve service differentiation. Greater provider reliance on lab networks for specialized testing strengthens sample flow and stabilizes demand across routine and high-complexity diagnostics.
Cancer Diagnostic Market Challenges
Cancer diagnostics faces persistent cost and access barriers that slow adoption of advanced testing across under-resourced settings. High equipment and maintenance costs for imaging and specialized laboratory instruments can constrain capacity expansion, especially outside major urban centers. Reimbursement variability and prior-authorization friction can delay testing or limit utilization of newer molecular assays. Workforce limitations in radiology and pathology also pressure turnaround times, increasing operational bottlenecks as testing demand rises.
- For instance, ASTRO’s 2024 survey of more than 750 radiation oncologists found that 92% reported prior-authorization delays, and 68% said those delays typically lasted five days or more.
Cancer diagnostics also faces challenges related to standardization, data integration, and clinical utility alignment across multi-modality pathways. Differences in sample quality, pre-analytical handling, and assay interpretation can introduce variability across sites, increasing repeat testing or follow-up procedures. Integrating imaging, pathology, and genomic results into unified clinical decision workflows remains complex for many providers. Regulatory and evidence requirements for new testing approaches can extend commercialization timelines and slow broad clinical adoption.
Cancer Diagnostic Market Trends and Opportunities
Cancer diagnostics is shifting toward minimally invasive and earlier-stage detection approaches that improve patient compliance and expand addressable testing populations. Continued adoption of liquid biopsy and blood-based screening creates opportunities for expanded testing in settings where tissue sampling is challenging or delayed. Increasing use of minimal residual disease monitoring supports longitudinal testing models that raise repeat demand across treatment and surveillance. Growth in high-sensitivity assays also supports opportunities for specialized laboratories and integrated testing networks.
- For instance, Guardant Health reported that its Shield blood test detected 83% of colorectal cancers with 90% specificity in the ECLIPSE study, while Natera reported that its Signatera assay identified colorectal cancer recurrence up to 16.5 months earlier than radiologic imaging, with an average lead time of 8.7 months, 88% patient-level sensitivity, and 99.8% test-level specificity in serial monitoring.
Cancer diagnostics opportunity is also expanding through partnerships that connect testing platforms with therapy development and real-world clinical deployment. Companion diagnostic collaborations and broader genotyping access initiatives increase routine molecular testing and strengthen standardization. Workflow modernization across imaging and pathology supports deployment of software tools that improve efficiency and consistency across providers. Expansion into emerging markets through scalable lab networks and modular imaging infrastructure also supports longer-term volume growth as access improves.
Regional Insights
North America
North America represented 38.9% of the Cancer Diagnostic Market in 2025, supported by mature reimbursement frameworks, high screening penetration, and broad availability of advanced imaging and molecular testing. Provider networks typically follow structured oncology pathways that support repeat testing from detection through treatment monitoring. Strong presence of large diagnostic laboratory networks accelerates adoption of complex assays and supports standardized workflows. Ongoing investment in imaging upgrades and biomarker-driven care continues to sustain high diagnostic intensity.
Europe
Europe accounted for 27.4% of the Cancer Diagnostic Market in 2025, supported by established public health systems and broad access to imaging and pathology services across major countries. National screening programs and standardized referral pathways sustain consistent diagnostic throughput. Hospitals and regional laboratories benefit from centralized procurement and quality standards that support validated assays and repeat consumables demand. Continued modernization of lab workflows and imaging infrastructure supports steady growth in oncology diagnostics utilization.
Asia Pacific
Asia Pacific represented 24.6% of the Cancer Diagnostic Market in 2025, driven by scale effects from large populations and expanding diagnostic infrastructure across key countries. Growing cancer incidence and improving screening initiatives increase imaging and laboratory testing volumes, particularly in urban centers. Expansion of private healthcare capacity and diagnostic chains strengthens access to advanced imaging and molecular testing. Uneven reimbursement and per-capita capacity differences keep utilization below North America and Europe despite strong momentum.
Latin America
Latin America held 5.8% of the Cancer Diagnostic Market in 2025, supported by growth in private diagnostic networks and expanding access in major cities. Demand is concentrated around imaging, pathology, and laboratory services that serve both public and private patient flows. Infrastructure gaps and affordability constraints limit advanced molecular testing penetration in several countries. Continued investments in diagnostic chains and targeted screening programs support gradual expansion of testing volumes.
Middle East & Africa
Middle East & Africa accounted for 3.3% of the Cancer Diagnostic Market in 2025, with growth concentrated in wealthier markets that invest in tertiary care and diagnostic infrastructure. Demand is supported by expansion of imaging capacity and increasing availability of specialized laboratory services in select hubs. Many countries still face uneven access, limited reimbursement, and workforce constraints that restrict advanced testing penetration. Incremental expansion of hospital capacity and referral networks supports steady, location-specific growth.
Competitive Landscape
The Cancer Diagnostic Market shows a mix of diversified global medtech leaders and specialized diagnostics companies competing through technology breadth, assay performance, workflow integration, and clinical evidence development. Competitive differentiation is reinforced by the ability to support multi-modality pathways spanning imaging, pathology, molecular testing, and companion diagnostics. Mergers, partnerships, and portfolio expansions remain common strategies to accelerate menu breadth, improve turnaround times, and strengthen positions in high-growth precision oncology workflows. Scale advantages in distribution, service networks, and regulatory capabilities continue to shape market leadership.
- Hoffmann-La Roche Ltd. maintains a strong competitive position through integrated diagnostics capabilities spanning tissue-based testing, biomarker profiling, and platform-linked workflows that support routine oncology decision-making. The company’s strategy typically emphasizes broad test menu depth, clinical evidence alignment, and integration with laboratory automation to improve throughput and standardization. Roche’s global footprint and strong relationships with health systems support adoption of validated assays across screening, diagnosis, and therapy selection pathways. Continued focus on precision oncology sustains demand for high-value testing within structured care pathways.
The industry research and growth report includes detailed analyses of the competitive landscape of the market and information about key companies, including:
- F. Hoffmann-La Roche Ltd.
- Thermo Fisher Scientific
- Abbott Laboratories
- Siemens Healthineers
- Koninklijke Philips N.V.
- Becton, Dickinson and Company (BD)
- GE HealthCare
- Danaher Corporation
- Hologic, Inc.
- QIAGEN N.V.
- Bio-Rad Laboratories, Inc.
- Illumina, Inc.
- Exact Sciences Corporation
- Guardant Health
- Myriad Genetics
- NeoGenomics Laboratories
- Agilent Technologies
Qualitative and quantitative analysis of companies has been conducted to help clients understand the wider business environment as well as the strengths and weaknesses of key industry players. Data is qualitatively analyzed to categorize companies as pure play, category-focused, industry-focused, and diversified; it is quantitatively analyzed to categorize companies as dominant, leading, strong, tentative, and weak.
Recent Developments
- In July 2025, Illumina announced the launch of the next generation of TruSight Oncology 500, its flagship cancer research assay that enables comprehensive genomic profiling of tumors. The upgraded platform is designed to facilitate more personalized treatment plans by identifying a broader range of actionable genomic alterations, reinforcing Illumina's leadership position in precision oncology diagnostics.
- In May 2025, NeoGenomics introduced the PanTracer genomic profiling test alongside the Paletrra spatial proteomics platform, two next-generation diagnostic tools aimed at improving precision in identifying tumor characteristics and guiding treatment decisions. These new offerings significantly strengthen NeoGenomics' portfolio in advanced cancer diagnostics, catering to laboratories seeking comprehensive tumor profiling solutions.
- In May 2025, SAGA Diagnostics commercially launched Pathlight™, an ultra-sensitive Minimal Residual Disease (MRD) blood test platform, with its first application focused on early-stage breast cancer. The platform is positioned as a new benchmark for MRD monitoring, enabling unusually early detection of cancer recurrence from a simple blood draw.
- In April 2025, Roche received FDA Breakthrough Device Designation for the VENTANA® TROP2 (EPR20043) RxDx Device, making it the first AI-driven companion diagnostic for non-small cell lung cancer (NSCLC) to receive such designation. The device combines immunohistochemistry (IHC) assay with a digital pathology AI algorithm, delivering a level of diagnostic precision not achievable through traditional manual scoring methods.
Report Scope
| Report Attribute | Details |
| Market size value in 2025 | USD 116,108 million |
| Revenue forecast in 2032 | USD 173,893.11 million |
| Growth rate (CAGR) | 5.94% (2025–2032) |
| Base year | 2025 |
| Forecast period | 2026-2032 |
| Quantitative units | USD million |
| Segments covered | By Product Outlook: Instruments, Consumables, Services; By Type Outlook: In Vitro Diagnostics (IVD), Laboratory Developed Tests (LDT), Imaging, Biopsy; By IVD Technology Outlook: PCR, IHC, ISH, NGS, Microarrays, Flow Cytometry, Immunoassays, Other IVD Technologies; By Imaging Modality Outlook: MRI, CT, PET, Mammography, Ultrasound, Other Modalities; By Test Type Outlook: Biopsy (Fine-needle Aspiration, Core Biopsy, Surgical Biopsy, Skin/Punch Biopsy, Other Biopsy Types), Other Test Types; By Application Outlook: Breast Cancer, Lung Cancer, Colorectal Cancer, Prostate Cancer, Cervical Cancer, Blood Cancer, Other Cancers; By End User Outlook: Hospitals & Clinics, Laboratories / Diagnostic Laboratories, Diagnostic Imaging Centers, Research Institutes, Others |
| Regional scope | North America, Europe, Asia Pacific, Latin America, Middle East & Africa |
| Key companies profiled | F. Hoffmann-La Roche Ltd.; Thermo Fisher Scientific; Abbott Laboratories; Siemens Healthineers; Koninklijke Philips N.V.; Becton, Dickinson and Company (BD); GE HealthCare; Danaher Corporation; Hologic, Inc.; QIAGEN N.V.; Bio-Rad Laboratories, Inc.; Illumina, Inc.; Exact Sciences Corporation; Guardant Health; Myriad Genetics; NeoGenomics Laboratories; Agilent Technologies |
| No.of Pages | 328 |
Segmentation
By Product
- Instruments
- Pathology-based Instruments
- Imaging Instruments
- Biopsy Instruments
- Other Instruments
- Consumables
- Antibodies
- Kits & Reagents
- Probes
- Other Consumables
- Services
By Type
- In Vitro Diagnostics (IVD)
- Laboratory Developed Tests (LDT)
- Imaging
- Biopsy
By IVD Technology
- Polymerase Chain Reaction (PCR)
- Immunohistochemistry (IHC)
- In Situ Hybridization (ISH)
- Next-generation Sequencing (NGS)
- Microarrays
- Flow Cytometry
- Immunoassays
- Other IVD Technologies
By Imaging Modality
- MRI
- CT
- PET
- Mammography
- Ultrasound
- Other Modalities
By Test Type
- Biopsy
- Fine-needle Aspiration
- Core Biopsy
- Surgical Biopsy
- Skin/Punch Biopsy
- Other Biopsy Types
By Application
- Breast Cancer
- Lung Cancer
- Colorectal Cancer
- Prostate Cancer
- Cervical Cancer
- Blood Cancer
- Other Cancers
By End User
- Hospitals & Clinics
- Laboratories / Diagnostic Laboratories
- Diagnostic Imaging Centers
- Research Institutes
- Others
By Region
- North America
- U.S.
- Canada
- Mexico
- Europe
- Germany
- France
- U.K.
- Italy
- Spain
- Rest of Europe
- Asia Pacific
- China
- Japan
- India
- South Korea
- South-east Asia
- Rest of Asia Pacific
- Latin America
- Brazil
- Argentina
- Rest of Latin America
- Middle East & Africa
- GCC Countries
- South Africa
- Rest of the Middle East and Africa
Request a Free Sample
Fill in your details and we'll send you a free sample report.
- Sample data tables & charts
- Research methodology
Need a Custom Version of This Report?
Tailor the scope, geography, or segments to your exact requirements.
- Custom geography or segment scope
- Direct access to our analyst team
Frequently Asked Questions
What is the current and forecast market size of the Cancer Diagnostic Market?
What is the CAGR for the Cancer Diagnostic Market during the forecast period?
Which segment is the largest in the Cancer Diagnostic Market?
What factors are driving growth in the Cancer Diagnostic Market?
Who are the leading companies in the Cancer Diagnostic Market?
Which region leads the Cancer Diagnostic Market?
Table of Content
Chapter 1. Report Introduction
- 1.1 Report Description & Purpose
- 1.1.1 Report Title & Market Definition
- 1.1.2 Unique Selling Propositions (USP) & Key Differentiators
- 1.1.3 Value Proposition for Stakeholders
- 1.2 Research Objectives
- 1.2.1 Market Sizing Objectives (Volume & Revenue)
- 1.2.2 Segmentation Objectives
- 1.2.3 Competitive Intelligence Objectives
- 1.2.4 Forecast & Scenario Objectives
- 1.3 Report Scope
- 1.3.1 Cancer Diagnostics Scope – Types & Subtypes Covered
- 1.3.2 Geographic Scope – Regions & Countries Covered
- 1.3.3 Historical Period, Base Year & Forecast Period (2025; forecast to 2032)
- 1.3.4 Inclusions & Exclusions
- 1.4 HS Code & Classification Framework
- 1.5 Currency, Units & Pricing Basis
- 1.6 Target Stakeholders
- 1.7 Limitations & Assumptions
Chapter 2. Executive Summary
- 2.1 Global Cancer Diagnostics Market Snapshot
- 2.1.1 Market Size – Historical (2025) & Forecast (2025-2032) (2025: USD 116,108 million → 2032: USD 173,893.11 million)
- 2.1.2 Volume & Revenue – Global Totals
- 2.1.3 Key Market Highlights – Top Five Facts
- 2.2 Cancer Diagnostics Market Segmentation Snapshot
- 2.2.1 Market Split by Region – 2025 vs. 2032
- 2.3 Competitive Snapshot
- 2.3.1 Top 10 Players by Revenue Share – 2025
- 2.3.2 Top 10 Players by Volume Share – 2025
- 2.3.3 Recent Strategic Developments (18-Month Summary)
- 2.4 Key Investment Highlights & Strategic Conclusions
Chapter 3. Cancer Diagnostics Market Dynamics & Industry Analysis
- 3.1 Market Overview & Context
- 3.1.1 Cancer Diagnostics Market Position in the Broader Automotive Value Chain
- 3.1.2 OEM vs. Replacement Market Dynamics
- 3.1.3 Market Maturity & Development Stage by Region
- 3.2 Cancer Diagnostics Market Drivers
- 3.3 Cancer Diagnostics Market Restraints & Challenges
- 3.4 Cancer Diagnostics Market Opportunities
- 3.5 Porter's Five Forces Analysis
- 3.5.1 Threat of New Entrants
- 3.5.2 Bargaining Power of Suppliers
- 3.5.3 Bargaining Power of Buyers
- 3.5.4 Threat of Substitutes
- 3.5.5 Competitive Rivalry – Intensity Assessment
- 3.6 Cancer Diagnostics Value Chain Analysis
- 3.6.1 Upstream – Raw Material/Input Suppliers
- 3.6.1.1 Raw Material/Input 1
- 3.6.1.2 Raw Material/Input 2
- 3.6.1.3 Raw Material/Input 3
- 3.6.2 Midstream – Production/Manufacturing/Service Delivery
- 3.6.2.1 Production/Process Overview
- 3.6.2.2 Key Facility Locations & Capacity by Manufacturer
- 3.6.3 Downstream – Distribution & End Consumer
- 3.6.3.1 Primary Channel – B2B/OEM
- 3.6.3.2 Secondary Channels – Dealer, Retail, Online, Direct
- 3.6.4 Value Chain Profitability Analysis
- 3.6.1 Upstream – Raw Material/Input Suppliers
- 3.7 PESTEL Analysis
- 3.7.1 Political Factors
- 3.7.2 Economic Factors
- 3.7.3 Social Factors
- 3.7.4 Technological Factors
- 3.7.5 Environmental Factors
- 3.7.6 Legal Factors
- 3.8 Cancer Diagnostics Supply Chain Analysis
- 3.8.1 Raw Material/Input Supply Risk Assessment
- 3.8.2 Manufacturing Concentration Risk (Geographic Exposure)
- 3.8.3 Trade Disruption Impact Analysis
- 3.9 Regulatory & Policy Landscape
Note: The regulatory and policy landscape section covers regulations based on their applicability to the market, Cancer Diagnostics category, geography, and scope of the study. Only regulatory frameworks with a material impact on operations, compliance, trade, sustainability, or market access are analyzed in detail.
Chapter 4. Key Investment Pockets & Opportunity Analysis
- 4.1 Cancer Diagnostics Market Attractiveness Analysis
- 4.1.1 By Region – Investment Attractiveness Matrix (Volume × CAGR)
- 4.2 Absolute Revenue Growth Opportunity
- 4.2.1 By Region – Absolute USD Growth Through 2032
- 4.3 Incremental Volume Opportunity
- 4.3.1 By Region – Incremental Volume Through 2032
- 4.3.2 Segment – Incremental Volume
- 4.4 Emerging Submarket Opportunity Deep Dive (Subject to Applicability)
- 4.5 Emerging Market Opportunity Scorecards
- 4.5.1 United States
- 4.5.2 Europe
- 4.5.3 Asia
- 4.5.4 Middle East & Africa
Note: Emerging Market Opportunity Scorecards will be included based on relevance and strategic importance. Regions listed are indicative and may vary depending on data availability and market dynamics.
Chapter 5. Cancer Diagnostics Import-Export Analysis & Trade Flows
- 5.1 Global Trade Overview
- 5.1.1 Global Export Value by Country (2025)
- 5.1.2 Global Export Volume by Country (2025)
- 5.1.3 Global Import Value by Country (2025)
- 5.1.4 Global Import Volume by Country (2025)
- 5.1.5 Net Trade Balance by Country (2025)
- 5.2 Export Analysis – Segment
- 5.2.1 Type 1 (HS Code)
- 5.2.2 Type 2 (HS Code)
- 5.2.3 Type 3 (HS Code)
- 5.2.4 Type 4 (HS Code)
- 5.2.5 Type 5 (HS Code)
- 5.3 Import Analysis – Segment
- 5.3.1 Type 1 (HS Code)
- 5.3.2 Type 2 (HS Code)
- 5.3.3 Type 3 (HS Code)
- 5.3.4 Type 4 (HS Code)
- 5.3.5 Type 5 (HS Code)
- 5.4 Average Unit Trade Prices
- 5.4.1 Average Export Price – Segment & Country
- 5.4.2 Average Import Price – Segment & Source Country
- 5.4.3 Price Trends (2025)
- 5.5 Key Trade Route Analysis
- 5.5.1 Trade Route 1
- 5.5.2 Trade Route 2
- 5.5.3 Trade Route 3
- 5.5.4 Trade Route 4
- 5.5.5 Trade Route 5
- 5.6 Trade Policy Impact Assessment
- 5.6.1 US Anti-Dumping & Section 301 Tariffs
- 5.6.2 EU Customs Union Impact
- 5.6.3 Major Free Trade Agreements
- 5.6.4 USMCA Rules of Origin
Note: Trade policy analysis will be included only where relevant to the Cancer Diagnostics market.
Chapter 6. Competitive Landscape & Company Benchmarking
- 6.1 Cancer Diagnostics Market Concentration & Structure
- 6.1.1 Herfindahl-Hirschman Index (HHI) – vs. 2025
- 6.1.2 Tier 1, Tier 2 & Tier 3 Market Structure
- 6.1.3 Global, Regional & Local Player Dynamics
- 6.2 Cancer Diagnostics Market Share Analysis – 2025
- 6.2.1 Global Revenue Share by Company
- 6.2.2 Global Volume Share by Company
- 6.2.3 Regional Revenue Share
- 6.2.4 Market Share Evolution ( vs. 2025)
- 6.2.5 OEM Segment Share by Company
- 6.2.6 Replacement Segment Share by Company
- 6.3 Production/Delivery Capacity & Facility Analysis
- 6.3.1 Global Installed Capacity
- 6.3.2 Capacity Utilization Rates
- 6.3.3 Production/Output Volume
- 6.3.4 Facility Locations & Capacity Map
- 6.3.5 Planned Capacity Additions
- 6.4 Cancer Diagnostics Competitive Benchmarking Matrix
- 6.4.1 Revenue, Volume, CAGR & Profitability Comparison
- 6.4.2 Channel Revenue Mix
- 6.4.3 Geographic Revenue Exposure
- 6.4.4 R&D Intensity
- 6.4.5 Sustainability Maturity
- 6.5 Strategic Developments in Cancer Diagnostics (Last 24 Months)
- 6.5.1 Mergers, Acquisitions & Divestments
- 6.5.2 New Cancer Diagnostics Launches
- 6.5.3 Facility Expansions
- 6.5.4 Strategic Alliances, Joint Ventures & Partnerships
- 6.5.5 Distribution Expansion & Market Entry
- 6.5.6 Sustainability & ESG Initiatives
- 6.6 Competitive Strategy Mapping
- 6.6.1 Leader, Challenger, Follower & Niche Classification
- 6.6.2 Pricing Strategy Comparison
- 6.6.3 Channel Strategy Matrix
Note: Strategic developments are included based on their materiality and the availability of reliable information.
Chapter 7. Global Cancer Diagnostics Market – By Distribution Channel
- 7.1 Segment Overview
- 7.1.1 Volume & Revenue Split by Channel (2025 & 2032)
- 7.1.2 Channel Mix Evolution (2025-2032)
Chapter 8. Regional Market Analysis – Global Overview
- 8.1 Global Regional Overview
- 8.1.1 Regional Volume Share
- 8.1.2 Regional Revenue Share
- 8.1.3 Regional Volume by Region
- 8.1.4 Regional Revenue by Region
- 8.1.5 Regional Forecast Through 2032
- 8.2 Cross-Regional Segment Analysis
- 8.2.1 By Distribution Channel
- 8.2.2 By Brand/Price Tier
Chapter 9. North America Cancer Diagnostics Market
- 9.1 United States
- 9.2 Canada
- 9.3 Mexico
Chapter 10. Europe Cancer Diagnostics Market
- 10.1 Germany
- 10.2 France
- 10.3 Italy
- 10.4 United Kingdom
- 10.5 Spain
- 10.6 Poland
- 10.7 Russia
- 10.8 Netherlands
- 10.9 Belgium
- 10.10 Sweden
- 10.11 Denmark
- 10.12 Norway
- 10.13 Rest of Europe
Chapter 11. Asia Pacific Cancer Diagnostics Market
- 11.1 China
- 11.2 India
- 11.3 Japan
- 11.4 South Korea
- 11.5 Thailand
- 11.6 Indonesia
- 11.7 Vietnam
- 11.8 Malaysia
- 11.9 Australia
- 11.10 Rest of Asia Pacific
Chapter 12. Latin America Cancer Diagnostics Market
- 12.1 Brazil
- 12.2 Argentina
- 12.3 Colombia
- 12.4 Chile
- 12.5 Rest of Latin America
Chapter 13. Middle East Cancer Diagnostics Market
- 13.1 Saudi Arabia
- 13.2 United Arab Emirates
- 13.3 Turkey
- 13.4 Israel
- 13.5 Iran
- 13.6 Rest of the Middle East
Chapter 14. Africa Cancer Diagnostics Market
- 14.1 South Africa
- 14.2 Egypt
- 14.3 Nigeria
- 14.4 Morocco
- 14.5 Rest of Africa
Chapter 15. Cancer Diagnostics Company Profiles
- 15.1 [Company 01]
- 15.1.1 Company Overview
- 15.1.2 Key Management Personnel
- 15.1.3 Products & Services Portfolio
- 15.1.4 Financial Performance
- 15.1.5 Key Market Focus & Geographic Presence
- 15.1.6 Recent Developments & Strategic Initiatives
Note: The company profile list is preliminary and may change based on research findings, market developments, data availability, and client requirements.
Chapter 16. Appendices
- Appendix A – List of Abbreviations & Acronyms
- Appendix B – Industry Classification Code Reference – Full Series
- Appendix C – Production & Capacity Data Tables
- Appendix D – End-Use & Demand Base Tables
- Appendix E – Consumption & Replacement Rate Assumptions
- Appendix F – ASP Reference Tables
- Appendix G – Manufacturing & Facility Database
- Appendix H – Import-Export Data Tables
- Appendix I – Regulatory Summary Tables
- Appendix J – Primary Research Participant List (Anonymized)
- Appendix K – Primary Research Questionnaire Framework
- Appendix L – Data Sources & Bibliography
- Appendix M – Market Size Divergence & Source Comparison
Chapter 17. Research Methodology
- 17.1 Research Framework & Philosophy
- 17.2 Secondary Research – Sources, Hierarchy & Data Extraction
- 17.3 Data Modeling – Bottom-Up & Top-Down Market Sizing
- 17.4 Primary Research – Stakeholder Framework, LOI & Sample Sizes
- 17.5 Forecast Methodology – Regression, Scenario & Sensitivity Analysis
- 17.6 Quality Control – Four-Layer Validation Framework
- 17.7 Limitations & Standard Assumptions
- 17.8 Disclaimer
