Market Overview
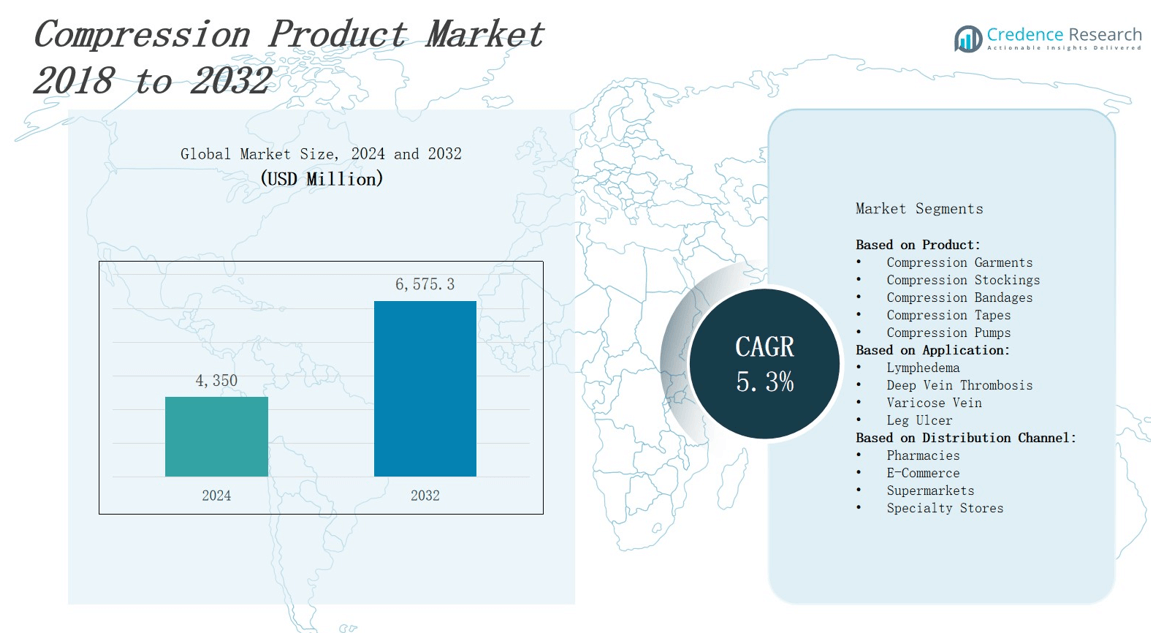
The Compression Product Market is projected to grow from USD 4,350 million in 2024 to USD 6,575.3 million by 2032, at a CAGR of 5.3% during the forecast period.
| REPORT ATTRIBUTE |
DETAILS |
| Historical Period |
2020-2023 |
| Base Year |
2024 |
| Forecast Period |
2025-2032 |
| Compression Product Market Size 2024 |
USD 4,350 million |
| Compression Product Market, CAGR |
5.3% |
| Compression Product Market Size 2032 |
USD 6,575.3 million |
The Compression Product Market is driven by the rising prevalence of chronic venous disorders, lymphedema, and sports-related injuries, along with increasing awareness of preventive healthcare. An aging population and growing adoption of compression therapy in post-surgical recovery further support market growth. Technological advancements in breathable, skin-friendly fabrics and user-friendly designs enhance patient compliance. Key trends include the integration of smart textiles for real-time monitoring, the expansion of compression wear in athletic and travel segments, and the rising popularity of customized compression garments. Market players focus on innovation, product diversification, and e-commerce distribution to meet evolving consumer demands efficiently.
The compression product market spans North America, Europe, Asia Pacific, and the Rest of the World, including Latin America and the Middle East & Africa. North America leads with strong clinical adoption and advanced healthcare access, followed by Europe with high awareness and established guidelines. Asia Pacific shows rapid growth due to rising healthcare access and aging populations, while the Rest of the World sees steady expansion. Key players include 3M, Juzo, Bauerfeind, Smith & Nephew plc, LIPOELASTIC, Lohmann and Rauscher, The Marena Group, and Peninsula BioMedical.
Market Insights
- The compression product market is projected to grow from USD 4,350 million in 2024 to USD 6,575.3 million by 2032, registering a CAGR of 5.3%.
- Rising cases of venous insufficiency, varicose veins, and lymphedema drive demand for non-invasive compression therapy.
- Increased use in post-surgical recovery and sports injury management supports growth across both clinical and consumer segments.
- Technological innovations in breathable fabrics, ergonomic fit, and smart monitoring features improve comfort and treatment compliance.
- Limited reimbursement and high out-of-pocket costs restrict access, especially for long-term and custom-fitted compression products.
- North America leads with 36% market share, followed by Europe at 29%, Asia Pacific at 21%, and Rest of the World at 14%.
- Growing consumer use in travel, fitness, and workplace settings expands market potential beyond traditional medical applications.
Access crucial information at unmatched prices!
Request your sample report today & start making informed decisions powered by Credence Research Inc.!
Download Sample
Market Drivers
Growing Prevalence of Venous and Lymphatic Disorders
The compression product market is witnessing strong demand due to the rising incidence of venous insufficiency, varicose veins, deep vein thrombosis, and lymphedema. These conditions require sustained pressure therapy to improve blood flow and reduce swelling. Healthcare providers increasingly recommend compression garments as a non-invasive treatment option. It addresses both acute and chronic conditions. The market benefits from clinical endorsement and expanding treatment protocols. Aging demographics further amplify the patient population requiring compression therapy.
- For instance, medi GmbH’s mediven stockings provide medically validated compression (20–40mmHg) and are clinically proven to improve blood flow and support healing in chronic venous insufficiency and venous leg ulcers.
Rising Post-Surgical and Injury Recovery Applications
Post-operative care and injury management are key drivers in the compression product market. Surgeons and physiotherapists prescribe compression wear to manage inflammation, support tissue repair, and prevent clotting complications. It improves healing times and enhances mobility outcomes. Sports injuries and orthopedic procedures generate consistent demand for targeted compression solutions. Recovery-focused consumers seek non-pharmaceutical pain management tools. Hospitals and rehabilitation centers continue to integrate compression therapy into routine care pathways.
- For instance, total knee arthroplasty patients treated with cold compression devices experienced significantly less blood loss and required fewer blood transfusions post-surgery, while also reporting lower pain intensity.
Technological Advancements in Fabric and Fit
Innovation in material science contributes significantly to the growth of the compression product market. Manufacturers invest in advanced textiles offering breathability, elasticity, moisture-wicking, and hypoallergenic properties. It improves comfort, encouraging regular use and better clinical outcomes. Smart compression garments equipped with sensors to monitor circulation and pressure gain attention in medical and athletic sectors. Ergonomic designs tailored for specific body zones enhance compliance. These advancements help differentiate products in a competitive landscape.
Expanding Preventive and Lifestyle Adoption
Consumers increasingly adopt compression products for preventive use in travel, fitness, and workplace settings. Long-haul flights, sedentary jobs, and athletic routines create risks of leg fatigue and circulation issues. The compression product market addresses these needs with accessible, stylish, and durable solutions. It aligns with growing interest in proactive wellness and daily performance enhancement. Direct-to-consumer sales channels expand market reach. Brand marketing emphasizes both functional benefits and everyday wearability.
Market Trends
Growing Integration of Smart Textiles and Wearable Technology in Compression Garments
The compression product market is experiencing a surge in demand for smart textiles and wearable-enabled garments. Manufacturers are incorporating sensors to monitor blood flow, temperature, and pressure levels in real time. These innovations allow for personalized therapy, enhancing clinical outcomes and user compliance. Smart compression wear appeals to both medical and athletic users. It helps optimize recovery, prevent injuries, and track physiological responses. Brands use data insights to refine product performance and design.
- For instance, Hexoskin offers biometric shirts that track heart rate, breathing, and activity levels, providing medical-grade data used in clinical research and sports performance.
Expansion of Compression Apparel in Sports, Fitness, and Lifestyle Segments
Athletes and fitness enthusiasts increasingly adopt compression garments to boost performance and aid recovery. The compression product market benefits from rising interest in preventive wellness and functional sportswear. Products such as sleeves, tights, and socks support muscle efficiency and circulation during workouts. It appeals to consumers seeking comfort, stability, and improved endurance. Brands focus on stylish, breathable materials suited for everyday and active wear. This lifestyle shift drives strong demand beyond medical use.
- For instance, Nike introduced its Pro Compression sleeves featuring zonal pressure technology that enhances blood flow and muscle support during high-intensity training. This product has gained traction among athletes for improving endurance and accelerating recovery.
Increased Customization and Patient-Centric Designs Across Product Lines
Customization is transforming the compression product market, with companies offering tailored fits and pressure levels. Patients seek products that balance therapeutic effectiveness with daily comfort. Brands respond by creating gender-specific cuts, inclusive sizing, and zoned compression patterns. It improves adherence to prescribed therapy and reduces product abandonment. The shift to patient-centric design helps manufacturers differentiate in a competitive landscape. Demand for user-friendly donning systems and soft, skin-friendly fabrics is also rising.
Rising Adoption in Travel, Occupational Health, and Preventive Care
Consumers are increasingly using compression garments during travel and long sedentary work hours to prevent leg fatigue and swelling. The compression product market is expanding in corporate wellness and preventive care programs. Travel socks and workplace wear help reduce risks of deep vein thrombosis and improve circulation. It aligns with the demand for non-invasive, daily-use wellness tools. E-commerce channels support easy access and product education. Functional design encourages repeat purchases and brand loyalty
Market Challenges Analysis
Limited Reimbursement Policies and High Out-of-Pocket Costs Restrain Adoption
The compression product market faces a challenge due to inconsistent reimbursement policies across regions. Many insurance providers classify compression garments as non-essential or over-the-counter products, limiting coverage. This increases out-of-pocket expenses for patients, especially those requiring long-term or custom-fitted solutions. Price-sensitive consumers often delay or avoid purchasing recommended products. It affects compliance in chronic conditions such as lymphedema and venous disorders. Market growth depends on broader policy support and better patient education to justify long-term cost benefits.
Low Awareness and Improper Usage Undermine Product Effectiveness
Lack of awareness about the clinical benefits of compression therapy remains a major challenge in the compression product market. Patients often misuse products due to poor understanding of correct sizing, pressure levels, and wearing duration. Healthcare providers may overlook compression therapy in treatment protocols or fail to offer proper guidance. This leads to reduced therapeutic outcomes and product dissatisfaction. It weakens consumer trust and limits repeat purchases. The market needs stronger outreach, professional training, and simplified usage instructions to overcome this barrier.
Market Opportunities
Expansion into Preventive Healthcare and Wellness Applications Drives Future Demand
The compression product market holds strong potential in preventive care and wellness applications beyond clinical use. Consumers increasingly seek compression garments for travel, sports recovery, and occupational comfort. It supports circulation, reduces fatigue, and promotes daily performance, making it appealing to health-conscious individuals. Companies can capitalize on this trend by offering lifestyle-oriented designs with aesthetic appeal. Growth in direct-to-consumer channels and wellness platforms enables wider product visibility. The market can benefit from wellness influencers and digital campaigns that educate consumers on everyday benefits.
Rising Demand in Emerging Markets Opens New Revenue Streams
Healthcare awareness and disposable incomes are rising in emerging economies, creating new opportunities for the compression product market. Urbanization, aging populations, and expanding access to medical care are increasing demand for non-invasive therapies. It allows manufacturers to introduce affordable, localized products that meet regional needs. Public health campaigns on venous disorders and post-surgical recovery can improve adoption. Partnerships with hospitals and pharmacies strengthen distribution. The market can grow further through training programs and collaborations with local healthcare providers.
Market Segmentation Analysis:
By Product
Compression garments dominate the compression product market due to their widespread use in both medical and lifestyle applications. These include sleeves, socks, and hosiery designed for chronic conditions and athletic recovery. Compression stockings follow closely, widely prescribed for managing venous disorders and improving circulation. Compression bandages and tapes hold significance in wound care and post-surgical settings, offering adjustable pressure solutions. Compression pumps serve severe cases of lymphedema and deep vein thrombosis, often in clinical environments. It supports patient outcomes through programmable pressure systems.
- For instance, Cygnet Texkimp developed a 9-axis robotic filament winding machine through collaboration with university research, enabling the production of more complex compression textile structures.
By Application
Lymphedema remains a leading application in the compression product market, driven by rising post-cancer therapy and surgical cases. Varicose vein treatment also contributes significantly, supported by growing awareness and physician-recommended therapies. Deep vein thrombosis requires preventive and post-treatment compression, making it a critical segment. Leg ulcer management often includes compression therapy to accelerate healing and reduce recurrence. It plays a vital role in chronic wound care and outpatient recovery.
By Distribution Channel
Pharmacies continue to dominate distribution in the compression product market, offering professional consultation and access to physician-prescribed products. E-commerce is expanding rapidly due to growing consumer preference for discreet, convenient purchases and wider product variety. Specialty stores offer custom fittings and therapeutic expertise, serving niche and clinical customers. Supermarkets provide basic compression products for general wellness use. It reflects the broadening market scope and accessibility of compression solutions across retail formats.
- For instance, companies like Medi GmbH & Co. KG in Germany emphasize quality and clinical validation of their compression products, supported by strict healthcare regulations.
Segments:
Based on Product:
- Compression Garments
- Compression Stockings
- Compression Bandages
- Compression Tapes
- Compression Pumps
Based on Application:
- Lymphedema
- Deep Vein Thrombosis
- Varicose Vein
- Leg Ulcer
Based on Distribution Channel:
- Pharmacies
- E-Commerce
- Supermarkets
- Specialty Stores
Based on the Geography:
- North America
- Europe
- Germany
- France
- U.K.
- Italy
- Spain
- Rest of Europe
- Asia Pacific
- China
- Japan
- India
- South Korea
- South-east Asia
- Rest of Asia Pacific
- Latin America
- Brazil
- Argentina
- Rest of Latin America
- Middle East & Africa
- GCC Countries
- South Africa
- Rest of the Middle East and Africa
Regional Analysis
North America
North America holds the largest share in the compression product market, accounting for 36% of the global revenue. High awareness of venous diseases, strong insurance coverage, and widespread use of compression therapy drive regional growth. The U.S. leads due to its advanced healthcare infrastructure and high diagnosis rates of lymphedema and varicose veins. Aging population and post-surgical recovery needs further support demand. It benefits from product innovation and the presence of key medical device manufacturers. Retail and e-commerce channels continue to expand, offering easier access to both prescription and over-the-counter compression products.
Europe
Europe accounts for 29% of the global compression product market, driven by established healthcare systems and early adoption of compression therapy. Countries like Germany, France, and the UK emphasize clinical guidelines for venous disorders and lymphedema management. It sees strong demand for compression stockings and bandages in both hospital and homecare settings. The region benefits from growing preventive care practices, particularly among older adults. Manufacturers focus on sustainability and patient comfort in product development. Increasing demand for compression solutions in sports and wellness also supports market expansion.
Asia Pacific
Asia Pacific holds 21% share of the compression product market, with growth driven by rising healthcare awareness, expanding medical access, and increasing geriatric population. China, Japan, and India lead regional demand due to large patient pools and improving diagnostics. It offers strong potential for low-cost and mass-market compression products, especially through online platforms. Regional governments promote non-invasive therapies to manage chronic vascular conditions. Growth in medical tourism and adoption of Western treatment protocols support product penetration. Local manufacturers are entering the market with affordable solutions tailored to regional needs.
Rest of the World
The Rest of the World region, including Latin America and the Middle East & Africa, contributes 14% to the global compression product market. Brazil, South Africa, and the UAE show rising demand due to improved healthcare infrastructure and increased awareness of vascular health. It experiences slow but steady growth, driven by urbanization and better access to medical supplies. International brands expand their presence through local partnerships and retail networks. Affordability remains a key factor influencing product adoption. Public health programs and clinician training support long-term development across these markets.
Shape Your Report to Specific Countries or Regions & Enjoy 30% Off!
Key Player Analysis
- Peninsula BioMedical
- Juzo
- The Marena Group
- Wear Ease
- 3M
- LympheDIVAs
- Lohmann and Rauscher
- Cosmac Healthcare
- Spectrum Healthcare
- Leonisa
- Macom Enterprises
- Medico International
- Smith & Nephew plc
- LIPOELASTIC
- Bauerfeind
- Proxima Healthcare
Competitive Analysis
The compression product market features a competitive landscape with a mix of global medical device companies and specialized compression garment manufacturers. Key players such as 3M, Smith & Nephew plc, and Lohmann and Rauscher focus on clinical-grade solutions supported by strong distribution networks and R&D capabilities. Companies like Juzo, Bauerfeind, and LIPOELASTIC lead in customized compression wear with emphasis on comfort, fit, and therapeutic efficacy. The market sees active participation from brands like The Marena Group, Macom Enterprises, and Leonisa, which cater to both medical and aesthetic segments. It continues to evolve through product innovation, smart fabric integration, and direct-to-consumer strategies. E-commerce expansion and growing demand for preventive and lifestyle-based applications drive new entrants and product line diversification. Strategic partnerships, product certifications, and geographic expansion remain central to sustaining market presence and capturing emerging opportunities.
Recent Developments
- In November 2024, The Marena Group partnered with Clothing 2.0 to launch the world’s first post-surgical compression garments infused with over-the-counter pain-relief ingredients.
- In early 2025, medi® USA released the mediven® comfort sculpt, a compression garment designed for first-time users experiencing sore or achy legs.
- On June 26, 2025, CenterGate Capital partnered with The Marena Group, investing to support its growth as a leading provider of medical-grade compression garments
- On April 20, 2025, Hyperice collaborated with Nike to launch the Hyperboot Nike × Hyperice, featuring air compression and adjustable heat for enhanced recovery.
Market Concentration & Characteristics
The compression product market is moderately concentrated, with a mix of established medical device companies and specialized compression wear manufacturers competing for market share. Leading players such as 3M, Bauerfeind, Lohmann and Rauscher, and Smith & Nephew plc dominate through strong brand presence, clinical trust, and global distribution. It features high product differentiation, with companies focusing on innovation in fit, fabric technology, and therapeutic performance. The market sees steady entry of niche players offering customized and lifestyle-oriented solutions, targeting athletic and preventive care users. Barriers to entry remain moderate due to regulatory requirements, material standards, and the need for medical validation. Competitive strategies include direct-to-consumer expansion, product certifications, and regional partnerships. The compression product market continues to evolve with demand shifting toward multifunctional garments that address both medical and wellness needs. Long-term success depends on clinical efficacy, patient comfort, and adaptability to emerging consumer preferences.
Report Coverage
The research report offers an in-depth analysis based on Product, Application, Distribution Channel and Geography. It details leading market players, providing an overview of their business, product offerings, investments, revenue streams, and key applications. Additionally, the report includes insights into the competitive environment, SWOT analysis, current market trends, as well as the primary drivers and constraints. Furthermore, it discusses various factors that have driven market expansion in recent years. The report also explores market dynamics, regulatory scenarios, and technological advancements that are shaping the industry. It assesses the impact of external factors and global economic changes on market growth. Lastly, it provides strategic recommendations for new entrants and established companies to navigate the complexities of the market.
Future Outlook
- Demand for compression products will rise due to increasing cases of venous disorders and lymphedema.
- Post-surgical and injury recovery applications will continue to drive product usage in clinical settings.
- Preventive use in travel, fitness, and workplace routines will expand consumer adoption.
- Smart textiles and sensor-based garments will gain traction in both medical and athletic segments.
- Custom-fit and ergonomic designs will become standard to improve comfort and compliance.
- E-commerce platforms will play a key role in product accessibility and brand visibility.
- Manufacturers will focus on breathable, skin-friendly materials to enhance user experience.
- Emerging markets will see higher adoption due to growing healthcare awareness and access.
- Reimbursement reforms and clinician education will support long-term treatment adherence.
- Competitive differentiation will depend on innovation, clinical validation, and consumer-centric designs.



