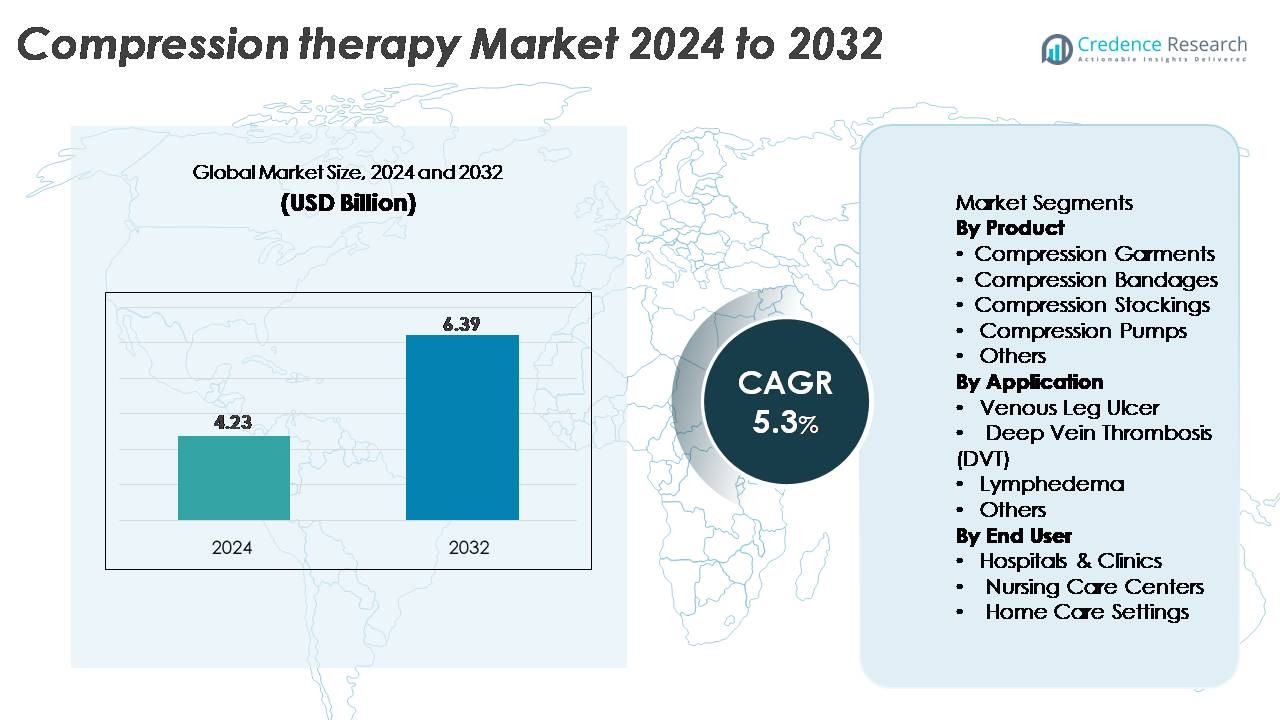
Home » Healthcare » Compression Therapy Market

Compression Therapy Market By End User (Hospitals and Clinics, Homecare, Rehabilitation Centers, Sports and Fitness Centers) By Gender (Male, Female) By Age Group (Adults, Pediatric)-Growth, Future Prospects & Competitive Analysis, 2016 – 2030

Price: $4999

Published: | Report ID: 22376 | Report Format : PDF

Market Overview

The market for compression therapy has been expanding steadily in recent years, and between 2023 and 2030, it is anticipated to rise at a CAGR of 5.80%. The market was estimated to be worth USD 3514.8 million in 2022, and it is anticipated to be worth USD 5518.05 million in 2030.

Two of the top causes of death and disability globally are sports injuries and road accidents. Whether severe or minor, skeletal system injuries are frequently seen in accident instances. Compression treatment products are typically applied in such circumstances to help the healing process and hasten patient recovery.

As people’s knowledge of the importance of fitness and health increases, more individuals worldwide are actively participating in sports and physical activities. Sports-related injuries and injuries from other forms of physical activity have consequently become more common due to this tendency. Sports injuries are reported each year in the US alone to the amount of 8.6 million. This factor is anticipated to drive the growth of the compression therapy market in the forecast period.

A more recent type of compression therapy called dynamic compression uses inflated clothing to deliver pressure to the injured area. As it is more effective than static compression therapy for some illnesses, dynamic compression therapy is growing in popularity. For venous and lymphatic problems, patients are increasingly looking for non-invasive remedies. For the majority of patients, compression therapy is a non-invasive therapeutic option that is efficient and secure.

compression therapy market (1)

Executive Summary

Market Definition

The market for goods and services used to prevent and cure venous and lymphatic problems falls under the heading of compression therapy. Applying pressure to the injured area as part of compression therapy helps the flow of blood and lymph. Varicose veins, deep vein thrombosis, lymphedema, and venous leg ulcers are among the problems it is frequently used to treat.

Design Element 2

Access crucial information at unmatched prices!

Request your free sample report today & start making informed decisions powered by Credence Research!

Download Free Sample
CTA Design Element 3

Market Insights

  • The global demand for compression therapy was valued at USD 3514.8 million in 2022 and is expected to reach USD 5518.05 million in 2030, growing at a CAGR of 5.80% between 2023 and 2030.
  • Compression bandages are the leading segment by product type. The compression stockings, on the other hand, are expected to grow at a strong CAGR.
  • The leading compression level segment is gradient compression.
  • The CAGR for venous disorders is expected to be the highest during the projection period.
  • During the forecast time frame, the elastic category is likely to have the highest CAGR.
  • During the forecast period, sports and fitness centers are estimated to have the greatest CAGR.
  • The male segment is probably going to have the highest CAGR during the prediction period.
  • Adults are the largest age group categorization.
  • North America dominated the compression therapy market.
  • Europe is predicted to be the second-largest region in the compression therapy market.
  • In the market for compression therapy, Asia Pacific is anticipated to grow at the fastest rate.
  • Compression therapy industry growth is anticipated to be primarily driven by factors including increasing incidences of vein disorders like venous leg ulcers, lymphedema, and deep vein thrombosis, the growing senior population, and the rising adoption of pressure therapies for treating these vein disorders.
  • There is potential to increase compression treatment utilization in home healthcare places as more people receive medical care there.

Segmentation Analysis

Segmentation by Product Type

  • By product type, compression bandages are the market leader. Managing and accelerating wound healing are common goals of compression bandaging. In addition to supporting the damaged region, they can aid in controlling bleeding and edema (swelling). They are widely used to treat surgeries, venous ulcers, chronic wounds, and injuries sustained in accidents.
  • During the projected period, the compression stockings category is anticipated to exhibit a sizable CAGR. By helping to move extra fluid away from the problematic area, compression stockings can help control edema (fluid retention) in a variety of body parts, including the arms and legs.
  • Other product types, such as compression garments, compression socks, compression sleeves, compression shirts, compression pumps, compression braces and wraps, and compression tapes, also contribute to the demand for compression therapy.

Segmentation by Compression Level

  • The main compression level category is gradient compression. Gradient compression stockings may be suggested to diabetics in order to increase blood flow to the legs and lower the risk of problems like ulcers and diabetic neuropathy.
  • The uniform compression category is likely to register a significant CAGR during the period of forecasting. A blood clot developing in a deep vein is known as DVT. Therapy with uniform compression can aid in preventing blood clot formation and lung infection.

Segmentation by Application

  • The category for venous disorders is anticipated to experience the highest CAGR in the projection period. By compressing the dilated veins, compression therapy lessens blood flow backward and prevents blood from collecting in the lower limbs.
  • Other applications, such as lymphatic disorders, deep vein thrombosis (DVT) prevention, orthopedic conditions, sports and athletic use, post-surgical and wound care, and others, also contribute to the demand for compression therapy.

Segmentation by Compression Material

  • During the projection period, the elastic category is likely to have the highest CAGR. In circumstances when there is a potential for swelling or harm, elastic compression materials may occasionally be utilized as a preventative measure.
  • Other compression materials, such as inelastic and other materials, also contribute to the demand for compression therapy.

Segmentation by End User

  • Sports and fitness centers will be expected to have the foremost CAGR during the prediction period. Compression therapy may reduce the intensity and duration of DOMS, which frequently happens after challenging or novel sports.
  • Other end users, such as hospitals and clinics, home care, and rehabilitation centers, also contribute to the demand for compression therapy.

Segmentation by Gender

  • Throughout the forecast duration, the category for males is anticipated to have the greatest CAGR. Men who work in positions that require prolonged standing or sitting, such as doctors, pilots, or office workers, may choose to wear compression stockings or socks to avoid venous problems and weariness in their legs.
  • The need for compression therapy is also influenced by other genders, such as females.

Segmentation by Age Group

  • The highest CAGR is anticipated for adults over the period of estimation. Adults who are interested in incorporating compression therapy into their daily wear can choose from a variety of styles and colors of compression garments, making them a stylish option.
  • Other age groups, such as pediatric, also contribute to the demand for compression therapy.

Segmentation by Region

  • The compression therapy market was led by North America. 43.0% of the global market was governed by North America in 2022. The increase in the number of elderly people and obesity are responsible for the rise in this region’s proportion over the previous years.
  • Europe is estimated to rank second in terms of market size for compression therapy.
  • Asi Pacific will witness the most rapid growth in the compression therapy market.
  • The rest of the world, including Latin America, the Middle East, and Africa, meets the rest of the compression therapy demand.

compression therapy market regional (1)

The sports and fitness trends, occupational use, and post-pregnancy needs are all driving the market expansion for compression therapy. Compression apparel is used by athletes and fitness enthusiasts to improve efficiency and speed up recovery, which helps the market expand.

During the time of forecasting, North America will probably rule the compression therapy market. This dominant position is due to elements like significant expenditure in R&D, the introduction of new products, and the high frequency of venous illnesses in nations like the U.S. Compression therapy will experience rapid market expansion in this region due to the high frequency of disorders, including lymphedema and venous leg ulcers as well as the expanding elderly population. For example, the Lymphatic Education & Research Network estimates that about 10 million Americans have lymphedema.

The Asia Pacific area is projected to show the fastest growth throughout the forecast time frame. The region’s market is likely to rise as a result of the region’s aging population, rising disposable income, and expanding patient base for chronic venous and lymphatic illnesses.

In China, there is a widespread trend towards wellness and health, which is boosting demand for items like compression therapy that promote overall well-being.

The COVID-19 pandemic has emphasized the value of remote monitoring and telemedicine, which could have an impact on China’s decision to use compression therapy.

Key Highlights of the Report

The global compression therapy market is segmented by product type, compression level, application, compression material, end user, gender, age group, and region. As far as the product type is concerned, compression bandages are the market spearhead. Gradient compression is the top compression level segment. During the forecast period, the venous disorders category is expected to grow at the highest CAGR. The type of elastic is anticipated to experience the highest CAGR during the forecast period. North America is driving the compression therapy market growth.

Compression therapy is frequently required as part of the treatment for conditions like diabetes, obesity, and cardiovascular illnesses, which helps drive market expansion. The need for compression items is driven by the frequent recommendations for post-surgery compression garments for enhancing blood circulation and minimizing inflammation.

However, according to forecasts, North America will hold the largest share of the market for compression therapy globally. During the projected period, the availability of appropriate government reimbursement will promote further market expansion for compression therapy in the area. Additionally, the Asia-Pacific (APAC) region is assumed to have the market’s sharpest growth. This is notably due to the expanding elderly population in Asian nations, particularly in China and India, as well as a sharp increase in the prevalence of diabetes- and orthopedic-related disorders in this population.

Which Key Factors Are Driving The Global Compression Therapy Market?

The drivers propelling the growth of the compression therapy industry are improved patient compliance, personalized treatment, and convenience and mobility.

What Are The Key Challenges In The Global Market For Compression Therapy?

Regulatory compliance, cost of treatment, and patient adherence are some of the challenges hindering the growth of the market for compression therapy.

What Market Opportunities Exist For Compression Therapy Globally?

Research and clinical trials and expanding healthcare awareness are the market opportunities that exist for compression therapy globally. New uses and treatment regimens may result from ongoing research into how well compression therapy works for various medical diseases, which will boost the market.

Market Drivers

Several factors influence the market for compression therapy globally. The main factors influencing the market for compression therapy globally are as follows:

Innovations in Compression Therapy Products

Smart compression apparel and 3D knitting technology are two advancements in compression therapy goods that have significantly boosted market growth. Compression therapy is becoming more appealing to patients and medical professionals due to these improvements in its efficacy, comfort, and convenience. Smart compression clothing has sensors built in and is connected to wearable tech or smartphone apps. They assist patients in following their treatment plans more consistently by giving real-time feedback on wear time and pressure levels. Patients are more likely to continue using compression therapy as directed when they can easily monitor their progress, which improves results and raises demand for such items.

The manufacture of compression clothing with a seamless and anatomical fit is made possible by 3D knitting technology. As a result, patients are more inclined to wear their compression garments as directed since even pressure distribution is ensured and comfort is improved. Thus, 3D knitting technology stimulates market expansion by enhancing patient compliance.

Market Restraints

Several challenges could prevent the expansion of the global market for compression therapy. Among them are the following:

Compression Garment Compliance is Low Among Patients

Patient non-compliance with compression devices and non-adherence to treatment instructions are the most common issues with compression therapy. In long-term treatments, where the main objective is to avoid the occurrence of a certain ailment (such as the occurrence or reoccurrence of ulcers), noncompliance is particularly significant. The compliance rate of patients with compression therapy declines over time because it is typically utilized as a preventive therapy in most situations. Additionally, wearing compression clothing frequently is linked to conditions like pain, edema, and skin irritability.

Opportunities

The global market for compression therapy presents significant potential opportunities. The following is an example of these:

Increased Sales of Products Bought Off the Shelf and Online

As they can be used without a doctor’s prescription, several goods (including low-pressure compression stockings, bandages, and wraps) are increasingly being marketed through pharmacies, stores (off-the-shelf), and e-commerce websites. Patients frequently utilize these products as preventative measures to ward off injuries. Compression therapy product producers should have major prospects for expansion as sales of compression items rise through e-commerce sites and off-the-shelf channels in developed nations.

Competitive Landscape

compression therapy market competitive (1)

Key Players

The global market for compression therapy is very competitive, with many powerful players. Some of the leading market participants and their corresponding market shares are listed below:

  • Cardinal Health
  • Julius Zorn GmbH
  • Hartmann AG
  • Medi GmbH & Co.
  • SIGVARIS
  • BSN Medical GmbH
  • ArjoHuntleigh
  • 3M Health Care
  • Spectrum Healthcare
  • Bio Compression Systems, Inc.
  • Stryker
  • Gottfried Medical
  • Others

These companies give mergers and acquisitions, expanding their distribution network, and developing new products a priority in order to remain competitive in the market.

The leading competitors in the global market for compression therapy are constantly looking for ways to get an advantage by releasing new items and advancements.

In February 2022, Koya Medical received USD 26 million in Series B funding to explore a variety of active compression treatments for lymphedema and venous diseases.

In February 2022, Therabody introduced its second generation of Recovery Air pneumatic compression boots. These boots have cutting-edge technology to aid in effective recovery.

Shape Your Report to Specific Countries or Regions & Enjoy 30% Off!

Summary of Key Findings

  • The market for compression therapy is seeing an increase in the importance of e-commerce. Compression therapy goods are increasingly being bought online by patients since e-commerce is convenient and affordable.
  • Market segmented by product type, compression level, application, compression material, end user, gender, age group, and region.
  • A product type that is leading the market is compression bandage.
  • The most ubiquitous compression level fragment is gradient compression.
  • In terms of CAGR, venous disorders are expected to grow at the fastest rate during the forecast period.
  • The category for sports and fitness centers will likely see the highest CAGR during the anticipated time frame.
  • North America is leading market development; the market is highly competitive with key players including Cardinal Health; Julius Zorn GmbH; Hartmann AG; Medi GmbH & Co.; SIGVARIS; BSN Medical GmbH; ArjoHuntleigh; 3M Health Care; Spectrum Healthcare; Bio Compression Systems, Inc.; Stryker; Gottfried Medical, and others.

Future Outlook

  • Optimistic viewpoint for the global compression therapy market with noteworthy growth potential in the North American region.
  • One of the major factors supporting the growth of the compression therapy market is the increase in demand for home-based compression therapy.
  • Lack of awareness can be a major impediment to the market’s growth in the near future.
  • Foremost companies must concentrate on product innovation, expanding their market reach, and maintaining competitive pricing to stay ahead.

Segmentation

  • By Product Type
    • Compression Garments
    • Compression Stockings
    • Compression Socks
    • Compression Sleeves
    • Compression Shirts
    • Compression Bandages
    • Compression Pumps
    • Compression Braces and Wraps
    • Compression Tapes
  • By Compression Level
    • Gradient Compression
    • Uniform Compression
  • By Application
    • Venous Disorders
    • Lymphatic Disorders
    • Deep Vein Thrombosis (DVT) Prevention
    • Orthopedic Conditions
    • Sports and Athletic Use
    • Post-Surgical and Wound Care
    • Others
  • By Compression Material
    • Elastic
    • Inelastic
    • Other Materials
  • By End User
    • Hospitals and Clinics
    • Homecare
    • Rehabilitation Centers
    • Sports and Fitness Centers
  • By Gender
    • Male
    • Female
  • By Age Group
    • Adults
    • Pediatric
  • By Region
    • North America
      • The US.
      • Canada
      • Mexico
    • Europe
      • Germany
      • France
      • The U.K.
      • Italy
      • Spain
      • Rest of Europe
    • Asia Pacific
      • China
      • Japan
      • India
      • South Korea
      • South-east Asia
      • Rest of Asia Pacific
    • Latin America
      • Brazil
      • Argentina
      • Rest of Latin America
    • Middle East & Africa
      • GCC Countries
      • South Africa
      • Rest of the Middle East and Africa

Adjacent Markets

There are several related markets in the compression therapy industry with significant potential for revenue growth. The major markets adjacent to the compression therapy market –

compression therapy market adjacent (1)

1. Preface

1.1. Report Description

1.1.1. Purpose of the Report

1.1.2. Target Audience

1.1.3. USP and Key Offerings

1.2. Research Scope

1.3. Market Introduction


2. Executive Summary

2.1. Market Snapshot: Global Compression Therapy Market

2.1.1. Global Compression Therapy Market, By Product Type

2.1.2. Global Compression Therapy Market, By Compression Level

2.1.3. Global Compression Therapy Market, By Application

2.1.4. Global Compression Therapy Market, By Compression Material

2.1.5. Global Compression Therapy Market, By End User

2.1.6. Global Compression Therapy Market, By Gender

2.1.7. Global Compression Therapy Market, By Age Group

2.1.8. Global Compression Therapy Market, By Region

2.2. Insights from Primary Respondents


3. Market Dynamics & Factors Analysis

3.1. Introduction

3.1.1. Global Compression Therapy Market Value, 2017-2030, (US$ Mn)

3.1.2. Y-o-Y Growth Trend Analysis

3.2. Market Dynamics

3.2.1. Compression Therapy Market Drivers

3.2.2. Compression Therapy Market Restraints

3.2.3. Compression Therapy Market Opportunities

3.2.4. Major Compression Therapy Industry Challenges

3.3. Growth and Development Patterns

3.4. Investment Feasibility Analysis

3.5. Market Opportunity Analysis

3.5.1. Product Type

3.5.2. Compression Level

3.5.3. Application

3.5.4. Compression Material

3.5.5. End User

3.5.6. Gender

3.5.7. Age Group

3.5.8. Geography


4. Market Competitive Landscape Analysis

4.1. Company Market Share Analysis, 2022

4.1.1. Global Compression Therapy Market: Company Market Share, Value 2022

4.1.2. Global Compression Therapy Market: Top 6 Company Market Share, Value 2022

4.1.3. Global Compression Therapy Market: Top 3 Company Market Share, Value 2022

4.2. Global Compression Therapy Market: Company Revenue Share Analysis, 2022

4.3. Company Assessment Metrics, 2022

4.3.1. Stars

4.3.2. Emerging Leaders

4.3.3. Pervasive Players

4.3.4. Participants

4.4. Startups/ SMEs Assessment Metrics, 2022

4.4.1. Progressive Companies

4.4.2. Responsive Companies

4.4.3. Dynamic Companies

4.4.4. Starting Blocks

4.5. Strategic Development

4.5.1. Acquisition and Mergers

4.5.2. New Product Launch

4.5.3. Regional Expansion

4.5.4. Partnerships

4.6. Key Player Product Matrix

4.7. Potential for New Players in the Global Compression Therapy Market


5. Premium Insights

5.1. STAR (Situation, Task, Action, Results) Analysis

5.2. Porter’s Five Forces Analysis

5.2.1. Threat of New Entrants

5.2.2. Bargaining Power of Buyers/Consumers

5.2.3. Bargaining Power of Suppliers

5.2.4. Threat of Substitute Types

5.2.5. Intensity of Competitive Rivalry

5.3. PESTEL Analysis

5.3.1. Political Factors

5.3.2. Economic Factors

5.3.3. Social Factors

5.3.4. Technological Factors

5.3.5. Environmental Factors

5.3.6. Legal Factors

5.4. Key Market Trends

5.4.1. Demand Side Trends

5.4.2. Supply Side Trends

5.5. Value Chain Analysis

5.6. Compression Material Analysis

5.6.1. Research and development in the global market

5.6.2. Patent Analysis

5.6.3. Emerging technologies and their potential disruption to the market

5.7. Consumer Behaviour Analysis

5.7.1. Consumer Preferences and Expectations

5.7.2. Factors Influencing Consumer Buying Decisions

5.7.2.1. North America

5.7.2.2. Europe

5.7.2.3. Asia Pacific

5.7.2.4. Latin America

5.7.2.5. Middle East and Africa

5.7.3. Consumer Pain Points

5.8. Analysis and Recommendations

5.9. Adjacent Market Analysis


6. Market Positioning of Key Players, 2022

6.1. Company market share of key players, 2022

6.2. Competitive Benchmarking

6.3. Market Positioning of Key Vendors

6.4. Geographical Presence Analysis

6.5. Major Strategies Adopted by Key Players

6.5.1. Key Strategies Analysis

6.5.2. Mergers and Acquisitions

6.5.3. Partnerships

6.5.4. Product Launch

6.5.5. Geographical Expansion

6.5.6. Others


7. Impact Analysis of COVID 19 and Russia – Ukraine War on Compression Therapy Market

7.1. Ukraine-Russia War Impact

7.1.1. Uncertainty and Economic Instability

7.1.2. Supply chain disruptions

7.1.3. Regional market shifts

7.1.4. Shift in government priorities

7.2. COVID-19 Impact Analysis

7.2.1. Supply Chain Disruptions

7.2.2. Demand Fluctuations

7.2.3. Shift in Product Mix

7.2.4. Reduced Industrial Activity

7.2.5. Regional Impact Analysis

7.2.5.1. North America

7.2.5.2. Europe

7.2.5.3. Asia Pacific

7.2.5.4. Latin America

7.2.5.5. Middle East and Africa


8. Global Compression Therapy Market, By Product Type

8.1. Global Compression Therapy Market Overview, by Product Type

8.1.1. Global Compression Therapy Market Revenue Share, By Product Type, 2022 Vs 2030 (in %)

8.2. Compression Garments

8.2.1. Global Compression Therapy Market, By Compression Garments, By Region, 2017-2030 (US$ Mn)

8.2.2. Market Dynamics for Compression Garments

8.2.2.1. Drivers

8.2.2.2. Restraints

8.2.2.3. Opportunities

8.2.2.4. Trends

8.3. Compression Stockings

8.3.1. Global Compression Therapy Market, By Compression Stockings, By Region, 2017-2030 (US$ Mn)

8.3.2. Market Dynamics for Compression Stockings

8.3.2.1. Drivers

8.3.2.2. Restraints

8.3.2.3. Opportunities

8.3.2.4. Trends

8.4. Compression Socks

8.4.1. Global Compression Therapy Market, By Compression Socks, By Region, 2017-2030 (US$ Mn)

8.4.2. Market Dynamics for Compression Socks

8.4.2.1. Drivers

8.4.2.2. Restraints

8.4.2.3. Opportunities

8.4.2.4. Trends

8.5. Compression Sleeves

8.5.1. Global Compression Therapy Market, By Compression Sleeves, By Region, 2017-2030 (US$ Mn)

8.5.2. Market Dynamics for Compression Sleeves

8.5.2.1. Drivers

8.5.2.2. Restraints

8.5.2.3. Opportunities

8.5.2.4. Trends

8.6. Compression Shirts

8.6.1. Global Compression Therapy Market, By Compression Shirts, By Region, 2017-2030 (US$ Mn)

8.6.2. Market Dynamics for Compression Shirts

8.6.2.1. Drivers

8.6.2.2. Restraints

8.6.2.3. Opportunities

8.6.2.4. Trends

8.7. Compression Bandages

8.7.1. Global Compression Therapy Market, By Compression Bandages, By Region, 2017-2030 (US$ Mn)

8.7.2. Market Dynamics for Compression Bandages

8.7.2.1. Drivers

8.7.2.2. Restraints

8.7.2.3. Opportunities

8.7.2.4. Trends

8.8. Compression Pumps

8.8.1. Global Compression Therapy Market, By Compression Pumps, By Region, 2017-2030 (US$ Mn)

8.8.2. Market Dynamics for Compression Pumps

8.8.2.1. Drivers

8.8.2.2. Restraints

8.8.2.3. Opportunities

8.8.2.4. Trends

8.9. Compression Braces and Wraps

8.9.1. Global Compression Therapy Market, By Compression Braces and Wraps, By Region, 2017-2030 (US$ Mn)

8.9.2. Market Dynamics for Compression Braces and Wraps

8.9.2.1. Drivers

8.9.2.2. Restraints

8.9.2.3. Opportunities

8.9.2.4. Trends

8.10. Compression Tapes

8.10.1. Global Compression Therapy Market, By Compression Tapes, By Region, 2017-2030 (US$ Mn)

8.10.2. Market Dynamics for Compression Tapes

8.10.2.1. Drivers

8.10.2.2. Restraints

8.10.2.3. Opportunities

8.10.2.4. Trends


9. Global Compression Therapy Market, By Compression Level

9.1. Global Compression Therapy Market Overview, by Compression Level

9.1.1. Global Compression Therapy Market Revenue Share, By Compression Level, 2022 Vs 2030 (in %)

9.2. Gradient Compression

9.2.1. Global Compression Therapy Market, By Gradient Compression, By Region, 2017-2030 (US$ Mn)

9.2.2. Market Dynamics for Gradient Compression

9.2.2.1. Drivers

9.2.2.2. Restraints

9.2.2.3. Opportunities

9.2.2.4. Trends

9.3. Uniform Compression

9.3.1. Global Compression Therapy Market, By Uniform Compression, By Region, 2017-2030 (US$ Mn)

9.3.2. Market Dynamics for Uniform Compression

9.3.2.1. Drivers

9.3.2.2. Restraints

9.3.2.3. Opportunities

9.3.2.4. Trends


10. Global Compression Therapy Market, By Application

10.1. Global Compression Therapy Market Overview, by Application

10.1.1. Global Compression Therapy Market Revenue Share, By Application, 2022 Vs 2030 (in %)

10.2. Venous Disorders

10.2.1. Global Compression Therapy Market, By Venous Disorders, By Region, 2017-2030 (US$ Mn)

10.2.2. Market Dynamics for Venous Disorders

10.2.2.1. Drivers

10.2.2.2. Restraints

10.2.2.3. Opportunities

10.2.2.4. Trends

10.3. Lymphatic Disorders

10.3.1. Global Compression Therapy Market, By Lymphatic Disorders, By Region, 2017-2030 (US$ Mn)

10.3.2. Market Dynamics for Lymphatic Disorders

10.3.2.1. Drivers

10.3.2.2. Restraints

10.3.2.3. Opportunities

10.3.2.4. Trends

10.4. Deep Vein Thrombosis (DVT) Prevention

10.4.1. Global Compression Therapy Market, By Deep Vein Thrombosis (DVT) Prevention, By Region, 2017-2030 (US$ Mn)

10.4.2. Market Dynamics for Deep Vein Thrombosis (DVT) Prevention

10.4.2.1. Drivers

10.4.2.2. Restraints

10.4.2.3. Opportunities

10.4.2.4. Trends

10.5. Orthopedic Conditions

10.5.1. Global Compression Therapy Market, By Orthopedic Conditions, By Region, 2017-2030 (US$ Mn)

10.5.2. Market Dynamics for Orthopedic Conditions

10.5.2.1. Drivers

10.5.2.2. Restraints

10.5.2.3. Opportunities

10.5.2.4. Trends

10.6. Sports and Athletic Use

10.6.1. Global Compression Therapy Market, By Sports and Athletic Use, By Region, 2017-2030 (US$ Mn)

10.6.2. Market Dynamics for Sports and Athletic Use

10.6.2.1. Drivers

10.6.2.2. Restraints

10.6.2.3. Opportunities

10.6.2.4. Trends

10.7. Post-Surgical and Wound Care

10.7.1. Global Compression Therapy Market, By Post-Surgical and Wound Care, By Region, 2017-2030 (US$ Mn)

10.7.2. Market Dynamics for Post-Surgical and Wound Care

10.7.2.1. Drivers

10.7.2.2. Restraints

10.7.2.3. Opportunities

10.7.2.4. Trends

10.8. Others

10.8.1. Global Compression Therapy Market, By Others, By Region, 2017-2030 (US$ Mn)

10.8.2. Market Dynamics for Others

10.8.2.1. Drivers

10.8.2.2. Restraints

10.8.2.3. Opportunities

10.8.2.4. Trends


11. Global Compression Therapy Market, By Compression Material

11.1. Global Compression Therapy Market Overview, by Compression Material

11.1.1. Global Compression Therapy Market Revenue Share, By Compression Material, 2022 Vs 2030 (in %)

11.2. Elastic

11.2.1. Global Compression Therapy Market, By Elastic, By Region, 2017-2030 (US$ Mn)

11.2.2. Market Dynamics for Elastic

11.2.2.1. Drivers

11.2.2.2. Restraints

11.2.2.3. Opportunities

11.2.2.4. Trends

11.3. Inelastic

11.3.1. Global Compression Therapy Market, By Inelastic, By Region, 2017-2030 (US$ Mn)

11.3.2. Market Dynamics for Inelastic

11.3.2.1. Drivers

11.3.2.2. Restraints

11.3.2.3. Opportunities

11.3.2.4. Trends

11.4. Other Materials

11.4.1. Global Compression Therapy Market, By Other Materials, By Region, 2017-2030 (US$ Mn)

11.4.2. Market Dynamics for Other Materials

11.4.2.1. Drivers

11.4.2.2. Restraints

11.4.2.3. Opportunities

11.4.2.4. Trends


12. Global Compression Therapy Market, By End User

12.1. Global Compression Therapy Market Overview, by End User

12.1.1. Global Compression Therapy Market Revenue Share, By End User, 2022 Vs 2030 (in %)

12.2. Hospitals and Clinics

12.2.1. Global Compression Therapy Market, By Hospitals and Clinics, By Region, 2017-2030 (US$ Mn)

12.2.2. Market Dynamics for Hospitals and Clinics

12.2.2.1. Drivers

12.2.2.2. Restraints

12.2.2.3. Opportunities

12.2.2.4. Trends

12.3. Homecare

12.3.1. Global Compression Therapy Market, By Homecare, By Region, 2017-2030 (US$ Mn)

12.3.2. Market Dynamics for Homecare

12.3.2.1. Drivers

12.3.2.2. Restraints

12.3.2.3. Opportunities

12.3.2.4. Trends

12.4. Rehabilitation Centers

12.4.1. Global Compression Therapy Market, By Rehabilitation Centers, By Region, 2017-2030 (US$ Mn)

12.4.2. Market Dynamics for Rehabilitation Centers

12.4.2.1. Drivers

12.4.2.2. Restraints

12.4.2.3. Opportunities

12.4.2.4. Trends

12.5. Sports and Fitness Centers

12.5.1. Global Compression Therapy Market, By Sports and Fitness Centers, By Region, 2017-2030 (US$ Mn)

12.5.2. Market Dynamics for Sports and Fitness Centers

12.5.2.1. Drivers

12.5.2.2. Restraints

12.5.2.3. Opportunities

12.5.2.4. Trends


13. Global Compression Therapy Market, By Gender

13.1. Global Compression Therapy Market Overview, by Gender

13.1.1. Global Compression Therapy Market Revenue Share, By Gender, 2022 Vs 2030 (in %)

13.2. Male

13.2.1. Global Compression Therapy Market, By Male, By Region, 2017-2030 (US$ Mn)

13.2.2. Market Dynamics for Male

13.2.2.1. Drivers

13.2.2.2. Restraints

13.2.2.3. Opportunities

13.2.2.4. Trends

13.3. Female

13.3.1. Global Compression Therapy Market, By Female, By Region, 2017-2030 (US$ Mn)

13.3.2. Market Dynamics for Female

13.3.2.1. Drivers

13.3.2.2. Restraints

13.3.2.3. Opportunities

13.3.2.4. Trends


14. Global Compression Therapy Market, By Age Group

14.1. Global Compression Therapy Market Overview, by Age Group

14.1.1. Global Compression Therapy Market Revenue Share, By Age Group, 2022 Vs 2030 (in %)

14.2. Adults

14.2.1. Global Compression Therapy Market, By Adults, By Region, 2017-2030 (US$ Mn)

14.2.2. Market Dynamics for Adults

14.2.2.1. Drivers

14.2.2.2. Restraints

14.2.2.3. Opportunities

14.2.2.4. Trends

14.3. Pediatric

14.3.1. Global Compression Therapy Market, By Pediatric, By Region, 2017-2030 (US$ Mn)

14.3.2. Market Dynamics for Pediatric

14.3.2.1. Drivers

14.3.2.2. Restraints

14.3.2.3. Opportunities

14.3.2.4. Trends


15. Global Compression Therapy Market, By Region

15.1. Global Compression Therapy Market Overview, by Region

15.1.1. Global Compression Therapy Market, By Region, 2022 vs 2030 (in%)

15.2. Product Type

15.2.1. Global Compression Therapy Market, By Product Type, 2017-2030 (US$ Mn)

15.3. Compression Level

15.3.1. Global Compression Therapy Market, By Compression Level, 2017-2030 (US$ Mn)

15.4. Application

15.4.1. Global Compression Therapy Market, By Application, 2017-2030 (US$ Mn)

15.5. Compression Material

15.5.1. Global Compression Therapy Market, By Compression Material, 2017-2030 (US$ Mn)

15.6. End User

15.6.1. Global Compression Therapy Market, By End User, 2017-2030 (US$ Mn)

15.7. Gender

15.7.1. Global Compression Therapy Market, By Gender, 2017-2030 (US$ Mn)

15.8. Age Group

15.8.1. Global Compression Therapy Market, By Age Group, 2017-2030 (US$ Mn)


16. North America Compression Therapy Market Analysis

16.1. Overview

16.1.1. Market Dynamics for North America

16.1.1.1. Drivers

16.1.1.2. Restraints

16.1.1.3. Opportunities

16.1.1.4. Trends

16.2. North America Compression Therapy Market, by Product Type, 2017-2030(US$ Mn)

16.2.1. Overview

16.2.2. SRC Analysis

16.3. North America Compression Therapy Market, by Compression Level, 2017-2030(US$ Mn)

16.3.1. Overview

16.3.2. SRC Analysis

16.4. North America Compression Therapy Market, by Application, 2017-2030(US$ Mn)

16.4.1. Overview

16.4.2. SRC Analysis

16.5. North America Compression Therapy Market, by Compression Material, 2017-2030(US$ Mn)

16.5.1. Overview

16.5.2. SRC Analysis

16.6. North America Compression Therapy Market, by End User, 2017-2030(US$ Mn)

16.6.1. Overview

16.6.2. SRC Analysis

16.7. North America Compression Therapy Market, by Gender, 2017-2030(US$ Mn)

16.7.1. Overview

16.7.2. SRC Analysis

16.8. North America Compression Therapy Market, by Age Group, 2017-2030(US$ Mn)

16.8.1. Overview

16.8.2. SRC Analysis

16.9. North America Compression Therapy Market, by Country, 2017-2030 (US$ Mn)

16.9.1. North America Compression Therapy Market, by Country, 2022 Vs 2030 (in%)

16.9.2. U.S.

16.9.3. Canada

16.9.4. Mexico


17. Europe Compression Therapy Market Analysis

17.1. Overview

17.1.1. Market Dynamics for Europe

17.1.1.1. Drivers

17.1.1.2. Restraints

17.1.1.3. Opportunities

17.1.1.4. Trends

17.2. Europe Compression Therapy Market, by Product Type, 2017-2030(US$ Mn)

17.2.1. Overview

17.2.2. SRC Analysis

17.3. Europe Compression Therapy Market, by Compression Level, 2017-2030(US$ Mn)

17.3.1. Overview

17.3.2. SRC Analysis

17.4. Europe Compression Therapy Market, by Application, 2017-2030(US$ Mn)

17.4.1. Overview

17.4.2. SRC Analysis

17.5. Europe Compression Therapy Market, by Compression Material, 2017-2030(US$ Mn)

17.5.1. Overview

17.5.2. SRC Analysis

17.6. Europe Compression Therapy Market, by End User, 2017-2030(US$ Mn)

17.6.1. Overview

17.6.2. SRC Analysis

17.7. Europe Compression Therapy Market, by Gender, 2017-2030(US$ Mn)

17.7.1. Overview

17.7.2. SRC Analysis

17.8. Europe Compression Therapy Market, by Age Group, 2017-2030(US$ Mn)

17.8.1. Overview

17.8.2. SRC Analysis

17.9. Europe Compression Therapy Market, by Country, 2017-2030 (US$ Mn)

17.9.1. Europe Compression Therapy Market, by Country, 2022 Vs 2030 (in%)

17.9.2. UK

17.9.3. France

17.9.4. Germany

17.9.5. Italy

17.9.6. Spain

17.9.7. Benelux

17.9.8. Russia

17.9.9. Rest of Europe


18. Asia Pacific Compression Therapy Market Analysis

18.1. Overview

18.1.1. Market Dynamics for Asia Pacific

18.1.1.1. Drivers

18.1.1.2. Restraints

18.1.1.3. Opportunities

18.1.1.4. Trends

18.2. Asia Pacific Compression Therapy Market, by Product Type, 2017-2030(US$ Mn)

18.2.1. Overview

18.2.2. SRC Analysis

18.3. Asia Pacific Compression Therapy Market, by Compression Level, 2017-2030(US$ Mn)

18.3.1. Overview

18.3.2. SRC Analysis

18.4. Asia Pacific Compression Therapy Market, by Application, 2017-2030(US$ Mn)

18.4.1. Overview

18.4.2. SRC Analysis

18.5. Asia Pacific Compression Therapy Market, by Compression Material, 2017-2030(US$ Mn)

18.5.1. Overview

18.5.2. SRC Analysis

18.6. Asia Pacific Compression Therapy Market, by End User, 2017-2030(US$ Mn)

18.6.1. Overview

18.6.2. SRC Analysis

18.7. Asia Pacific Compression Therapy Market, by Gender, 2017-2030(US$ Mn)

18.7.1. Overview

18.7.2. SRC Analysis

18.8. Asia Pacific Compression Therapy Market, by Age Group, 2017-2030(US$ Mn)

18.8.1. Overview

18.8.2. SRC Analysis

18.9. Asia Pacific Compression Therapy Market, by Country, 2017-2030 (US$ Mn)

18.9.1. Asia Pacific Compression Therapy Market, by Country, 2022 Vs 2030 (in%)

18.9.2. China

18.9.3. Japan

18.9.4. India

18.9.5. South Korea

18.9.6. South East Asia

18.9.7. Rest of Asia Pacific


19. Latin America Compression Therapy Market Analysis

19.1. Overview

19.1.1. Market Dynamics for Latin America

19.1.1.1. Drivers

19.1.1.2. Restraints

19.1.1.3. Opportunities

19.1.1.4. Trends

19.2. Latin America Compression Therapy Market, by Product Type, 2017-2030(US$ Mn)

19.2.1. Overview

19.2.2. SRC Analysis

19.3. Latin America Compression Therapy Market, by Compression Level, 2017-2030(US$ Mn)

19.3.1. Overview

19.3.2. SRC Analysis

19.4. Latin America Compression Therapy Market, by Application, 2017-2030(US$ Mn)

19.4.1. Overview

19.4.2. SRC Analysis

19.5. Latin America Compression Therapy Market, by Compression Material, 2017-2030(US$ Mn)

19.5.1. Overview

19.5.2. SRC Analysis

19.6. Latin America Compression Therapy Market, by End User, 2017-2030(US$ Mn)

19.6.1. Overview

19.6.2. SRC Analysis

19.7. Latin America Compression Therapy Market, by Gender, 2017-2030(US$ Mn)

19.7.1. Overview

19.7.2. SRC Analysis

19.8. Latin America Compression Therapy Market, by Age Group, 2017-2030(US$ Mn)

19.8.1. Overview

19.8.2. SRC Analysis

19.9. Latin America Compression Therapy Market, by Country, 2017-2030 (US$ Mn)

19.9.1. Latin America Compression Therapy Market, by Country, 2022 Vs 2030 (in%)

19.9.2. Brazil

19.9.3. Argentina

19.9.4. Rest of Latin America


20. Middle East Compression Therapy Market Analysis

20.1. Overview

20.1.1. Market Dynamics for Middle East

20.1.1.1. Drivers

20.1.1.2. Restraints

20.1.1.3. Opportunities

20.1.1.4. Trends

20.2. Middle East Compression Therapy Market, by Product Type, 2017-2030(US$ Mn)

20.2.1. Overview

20.2.2. SRC Analysis

20.3. Middle East Compression Therapy Market, by Compression Level, 2017-2030(US$ Mn)

20.3.1. Overview

20.3.2. SRC Analysis

20.4. Middle East Compression Therapy Market, by Application, 2017-2030(US$ Mn)

20.4.1. Overview

20.4.2. SRC Analysis

20.5. Middle East Compression Therapy Market, by Compression Material, 2017-2030(US$ Mn)

20.5.1. Overview

20.5.2. SRC Analysis

20.6. Middle East Compression Therapy Market, by End User, 2017-2030(US$ Mn)

20.6.1. Overview

20.6.2. SRC Analysis

20.7. Middle East Compression Therapy Market, by Gender, 2017-2030(US$ Mn)

20.7.1. Overview

20.7.2. SRC Analysis

20.8. Middle East Compression Therapy Market, by Age Group, 2017-2030(US$ Mn)

20.8.1. Overview

20.8.2. SRC Analysis

20.9. Middle East Compression Therapy Market, by Country, 2017-2030 (US$ Mn)

20.9.1. Middle East Compression Therapy Market, by Country, 2022 Vs 2030 (in%)

20.9.2. UAE

20.9.3. Saudi Arabia

20.9.4. Rest of Middle East


21. Africa Compression Therapy Market Analysis

21.1. Overview

21.1.1. Market Dynamics for Africa

21.1.1.1. Drivers

21.1.1.2. Restraints

21.1.1.3. Opportunities

21.1.1.4. Trends

21.2. Africa Compression Therapy Market, by Product Type, 2017-2030(US$ Mn)

21.2.1. Overview

21.2.2. SRC Analysis

21.3. Africa Compression Therapy Market, by Compression Level, 2017-2030(US$ Mn)

21.3.1. Overview

21.3.2. SRC Analysis

21.4. Africa Compression Therapy Market, by Application, 2017-2030(US$ Mn)

21.4.1. Overview

21.4.2. SRC Analysis

21.5. Africa Compression Therapy Market, by Compression Material, 2017-2030(US$ Mn)

21.5.1. Overview

21.5.2. SRC Analysis

21.6. Africa Compression Therapy Market, by End User, 2017-2030(US$ Mn)

21.6.1. Overview

21.6.2. SRC Analysis

21.7. Africa Compression Therapy Market, by Gender, 2017-2030(US$ Mn)

21.7.1. Overview

21.7.2. SRC Analysis

21.8. Africa Compression Therapy Market, by Age Group, 2017-2030(US$ Mn)

21.8.1. Overview

21.8.2. SRC Analysis

21.9. Africa Compression Therapy Market, by Country, 2017-2030 (US$ Mn)

21.9.1. Africa Compression Therapy Market, by Country, 2022 Vs 2030 (in%)

21.9.2. South Africa

21.9.3. Egypt

21.9.4. Rest of Africa


22. Company Profiles

22.1. Cardinal Health

22.1.1. Company Overview

22.1.2. Products/Services Portfolio

22.1.3. Geographical Presence

22.1.4. SWOT Analysis

22.1.5. Financial Summary

22.1.5.1. Market Revenue and Net Profit (2019-2022)

22.1.5.2. Business Segment Revenue Analysis

22.1.5.3. Geographical Revenue Analysis

22.2. Julius Zorn GmbH

22.3. Hartmann AG

22.4. Medi GmbH & Co.

22.5. SIGVARIS

22.6. BSN Medical GmbH

22.7. ArjoHuntleigh

22.8. 3M Health Care

22.9. Spectrum Healthcare

22.10. Bio Compression Systems, Inc.

22.11. Stryker

22.12. Gottfried Medical

22.13. Others


23. Research Methodology

23.1. Research Methodology

23.2. Phase I – Secondary Research

23.3. Phase II – Data Modelling

23.3.1. Company Share Analysis Model

23.3.2. Revenue Based Modelling

23.4. Phase III – Primary Research

23.5. Research Limitations

23.5.1. Assumptions

List of Figures

FIG. 1 Global Compression Therapy Market: Research Methodology

FIG. 2 Market Size Estimation – Top Down & Bottom up Approach

FIG. 3 Global Compression Therapy Market Segmentation

FIG. 4 Global Compression Therapy Market, by Product Type, 2022 (US$ Mn)

FIG. 5 Global Compression Therapy Market, by Compression Level, 2022 (US$ Mn)

FIG. 6 Global Compression Therapy Market, by Application, 2022 (US$ Mn)

FIG. 7 Global Compression Therapy Market, by Compression Material, 2022 (US$ Mn)

FIG. 8 Global Compression Therapy Market, by End User, 2022 (US$ Mn)

FIG. 9 Global Compression Therapy Market, by Gender, 2022 (US$ Mn)

FIG. 10 Global Compression Therapy Market, by Age Group, 2022 (US$ Mn)

FIG. 11 Global Compression Therapy Market, by Geography, 2022 (US$ Mn)

FIG. 12 Attractive Investment Proposition, by Product Type, 2022

FIG. 13 Attractive Investment Proposition, by Compression Level, 2022

FIG. 14 Attractive Investment Proposition, by Application, 2022

FIG. 15 Attractive Investment Proposition, by Compression Material, 2022

FIG. 16 Attractive Investment Proposition, by End User, 2022

FIG. 17 Attractive Investment Proposition, by Gender, 2022

FIG. 18 Attractive Investment Proposition, by Age Group, 2022

FIG. 19 Attractive Investment Proposition, by Geography, 2022

FIG. 20 Global Market Share Analysis of Key Compression Therapy Market Manufacturers, 2022

FIG. 21 Global Market Positioning of Key Compression Therapy Market Manufacturers, 2022

FIG. 22 Global Compression Therapy Market Value Contribution, By Product Type, 2022 & 2030 (Value %)

FIG. 23 Global Compression Therapy Market, by Compression Garments, Value, 2017-2030 (US$ Mn)

FIG. 24 Global Compression Therapy Market, by Compression Stockings, Value, 2017-2030 (US$ Mn)

FIG. 25 Global Compression Therapy Market, by Compression Socks, Value, 2017-2030 (US$ Mn)

FIG. 26 Global Compression Therapy Market, by Compression Sleeves, Value, 2017-2030 (US$ Mn)

FIG. 27 Global Compression Therapy Market, by Compression Shirts, Value, 2017-2030 (US$ Mn)

FIG. 28 Global Compression Therapy Market, by Compression Bandages, Value, 2017-2030 (US$ Mn)

FIG. 29 Global Compression Therapy Market, by Compression Pumps, Value, 2017-2030 (US$ Mn)

FIG. 30 Global Compression Therapy Market, by Compression Braces and Wraps, Value, 2017-2030 (US$ Mn)

FIG. 31 Global Compression Therapy Market, by Compression Tapes, Value, 2017-2030 (US$ Mn)

FIG. 32 Global Compression Therapy Market Value Contribution, By Compression Level, 2022 & 2030 (Value %)

FIG. 33 Global Compression Therapy Market, by Gradient Compression, Value, 2017-2030 (US$ Mn)

FIG. 34 Global Compression Therapy Market, by Uniform Compression, Value, 2017-2030 (US$ Mn)

FIG. 35 Global Compression Therapy Market Value Contribution, By Application, 2022 & 2030 (Value %)

FIG. 36 Global Compression Therapy Market, by Venous Disorders, Value, 2017-2030 (US$ Mn)

FIG. 37 Global Compression Therapy Market, by Lymphatic Disorders, Value, 2017-2030 (US$ Mn)

FIG. 38 Global Compression Therapy Market, by Deep Vein Thrombosis (DVT) Prevention, Value, 2017-2030 (US$ Mn)

FIG. 39 Global Compression Therapy Market, by Orthopedic Conditions, Value, 2017-2030 (US$ Mn)

FIG. 40 Global Compression Therapy Market, by Sports and Athletic Use, Value, 2017-2030 (US$ Mn)

FIG. 41 Global Compression Therapy Market, by Post-Surgical and Wound Care, Value, 2017-2030 (US$ Mn)

FIG. 42 Global Compression Therapy Market, by Others, Value, 2017-2030 (US$ Mn)

FIG. 43 Global Compression Therapy Market Value Contribution, By Compression Material, 2022 & 2030 (Value %)

FIG. 44 Global Compression Therapy Market, by Elastic, Value, 2017-2030 (US$ Mn)

FIG. 45 Global Compression Therapy Market, by Inelastic, Value, 2017-2030 (US$ Mn)

FIG. 46 Global Compression Therapy Market, by Other Materials, Value, 2017-2030 (US$ Mn)

FIG. 47 Global Compression Therapy Market Value Contribution, By End User, 2022 & 2030 (Value %)

FIG. 48 Global Compression Therapy Market, by Hospitals and Clinics, Value, 2017-2030 (US$ Mn)

FIG. 49 Global Compression Therapy Market, by Homecare, Value, 2017-2030 (US$ Mn)

FIG. 50 Global Compression Therapy Market, by Rehabilitation Centers, Value, 2017-2030 (US$ Mn)

FIG. 51 Global Compression Therapy Market, by Sports and Fitness Centers, Value, 2017-2030 (US$ Mn)

FIG. 52 Global Compression Therapy Market Value Contribution, By Gender, 2022 & 2030 (Value %)

FIG. 53 Global Compression Therapy Market, by Male, Value, 2017-2030 (US$ Mn)

FIG. 54 Global Compression Therapy Market, by Female, Value, 2017-2030 (US$ Mn)

FIG. 55 Global Compression Therapy Market Value Contribution, By Age Group, 2022 & 2030 (Value %)

FIG. 56 Global Compression Therapy Market, by Adults, Value, 2017-2030 (US$ Mn)

FIG. 57 Global Compression Therapy Market, by Pediatric, Value, 2017-2030 (US$ Mn)

FIG. 58 North America Compression Therapy Market, 2017-2030 (US$ Mn)

FIG. 59 U.S. Compression Therapy Market, 2017-2030 (US$ Mn)

FIG. 60 Canada Compression Therapy Market, 2017-2030 (US$ Mn)

FIG. 61 Mexico Compression Therapy Market, 2017-2030 (US$ Mn)

FIG. 62 Europe Compression Therapy Market, 2017-2030 (US$ Mn)

FIG. 63 Germany Compression Therapy Market, 2017-2030 (US$ Mn)

FIG. 64 France Compression Therapy Market, 2017-2030 (US$ Mn)

FIG. 65 U.K. Compression Therapy Market, 2017-2030 (US$ Mn)

FIG. 66 Italy Compression Therapy Market, 2017-2030 (US$ Mn)

FIG. 67 Spain Compression Therapy Market, 2017-2030 (US$ Mn)

FIG. 68 Benelux Compression Therapy Market, 2017-2030 (US$ Mn)

FIG. 69 Russia Compression Therapy Market, 2017-2030 (US$ Mn)

FIG. 70 Rest of Europe Compression Therapy Market, 2017-2030 (US$ Mn)

FIG. 71 Asia Pacific Compression Therapy Market, 2017-2030 (US$ Mn)

FIG. 72 China Compression Therapy Market, 2017-2030 (US$ Mn)

FIG. 73 Japan Compression Therapy Market, 2017-2030 (US$ Mn)

FIG. 74 India Compression Therapy Market, 2017-2030 (US$ Mn)

FIG. 75 South Korea Compression Therapy Market, 2017-2030 (US$ Mn)

FIG. 76 South-East Asia Compression Therapy Market, 2017-2030 (US$ Mn)

FIG. 77 Rest of Asia Pacific Compression Therapy Market, 2017-2030 (US$ Mn)

FIG. 78 Latin America Compression Therapy Market, 2017-2030 (US$ Mn)

FIG. 79 Brazil Compression Therapy Market, 2017-2030 (US$ Mn)

FIG. 80 Argentina Compression Therapy Market, 2017-2030 (US$ Mn)

FIG. 81 Rest of Latin America Compression Therapy Market, 2017-2030 (US$ Mn)

FIG. 82 Middle East Compression Therapy Market, 2017-2030 (US$ Mn)

FIG. 83 UAE Compression Therapy Market, 2017-2030 (US$ Mn)

FIG. 84 Saudi Arabia Compression Therapy Market, 2017-2030 (US$ Mn)

FIG. 85 Rest of Middle East Compression Therapy Market, 2017-2030 (US$ Mn)

FIG. 86 Africa Compression Therapy Market, 2017-2030 (US$ Mn)

FIG. 87 South Africa Compression Therapy Market, 2017-2030 (US$ Mn)

FIG. 88 Egypt Compression Therapy Market, 2017-2030 (US$ Mn)

FIG. 89 Rest of Africa Compression Therapy Market, 2017-2030 (US$ Mn)


List of Tables

TABLE 1 Market Snapshot: Global Compression Therapy Market

TABLE 2 Global Compression Therapy Market: Market Drivers Impact Analysis

TABLE 3 Global Compression Therapy Market: Market Restraints Impact Analysis

TABLE 4 Global Compression Therapy Market, by Competitive Benchmarking, 2022

TABLE 5 Global Compression Therapy Market, by Geographical Presence Analysis, 2022

TABLE 6 Global Compression Therapy Market, by Key Strategies Analysis, 2022

TABLE 7 Global Compression Therapy Market, by Compression Garments, By Region, 2017-2022 (US$ Mn)

TABLE 8 Global Compression Therapy Market, by Compression Garments, By Region, 2023-2030 (US$ Mn)

TABLE 9 Global Compression Therapy Market, by Compression Stockings, By Region, 2017-2022 (US$ Mn)

TABLE 10 Global Compression Therapy Market, by Compression Stockings, By Region, 2023-2030 (US$ Mn)

TABLE 11 Global Compression Therapy Market, by Compression Socks, By Region, 2017-2022 (US$ Mn)

TABLE 12 Global Compression Therapy Market, by Compression Socks, By Region, 2023-2030 (US$ Mn)

TABLE 13 Global Compression Therapy Market, by Compression Sleeves, By Region, 2017-2022 (US$ Mn)

TABLE 14 Global Compression Therapy Market, by Compression Sleeves, By Region, 2023-2030 (US$ Mn)

TABLE 15 Global Compression Therapy Market, by Compression Shirts, By Region, 2017-2022 (US$ Mn)

TABLE 16 Global Compression Therapy Market, by Compression Shirts, By Region, 2023-2030 (US$ Mn)

TABLE 17 Global Compression Therapy Market, by Compression Bandages, By Region, 2017-2022 (US$ Mn)

TABLE 18 Global Compression Therapy Market, by Compression Bandages, By Region, 2023-2030 (US$ Mn)

TABLE 19 Global Compression Therapy Market, by Compression Pumps, By Region, 2017-2022 (US$ Mn)

TABLE 20 Global Compression Therapy Market, by Compression Pumps, By Region, 2023-2030 (US$ Mn)

TABLE 21 Global Compression Therapy Market, by Compression Braces and Wraps, By Region, 2017-2022 (US$ Mn)

TABLE 22 Global Compression Therapy Market, by Compression Braces and Wraps, By Region, 2023-2030 (US$ Mn)

TABLE 23 Global Compression Therapy Market, by Compression Tapes, By Region, 2017-2022 (US$ Mn)

TABLE 24 Global Compression Therapy Market, by Compression Tapes, By Region, 2023-2030 (US$ Mn)

TABLE 25 Global Compression Therapy Market, by Gradient Compression, By Region, 2017-2022 (US$ Mn)

TABLE 26 Global Compression Therapy Market, by Gradient Compression, By Region, 2023-2030 (US$ Mn)

TABLE 27 Global Compression Therapy Market, by Uniform Compression, By Region, 2017-2022 (US$ Mn)

TABLE 28 Global Compression Therapy Market, by Uniform Compression, By Region, 2023-2030 (US$ Mn)

TABLE 29 Global Compression Therapy Market, by Venous Disorders, By Region, 2017-2022 (US$ Mn)

TABLE 30 Global Compression Therapy Market, by Venous Disorders, By Region, 2023-2030 (US$ Mn)

TABLE 31 Global Compression Therapy Market, by Lymphatic Disorders, By Region, 2017-2022 (US$ Mn)

TABLE 32 Global Compression Therapy Market, by Lymphatic Disorders, By Region, 2023-2030 (US$ Mn)

TABLE 33 Global Compression Therapy Market, by Deep Vein Thrombosis (DVT) Prevention, By Region, 2017-2022 (US$ Mn)

TABLE 34 Global Compression Therapy Market, by Deep Vein Thrombosis (DVT) Prevention, By Region, 2023-2030 (US$ Mn)

TABLE 35 Global Compression Therapy Market, by Orthopedic Conditions, By Region, 2017-2022 (US$ Mn)

TABLE 36 Global Compression Therapy Market, by Orthopedic Conditions, By Region, 2023-2030 (US$ Mn)

TABLE 37 Global Compression Therapy Market, by Sports and Athletic Use, By Region, 2017-2022 (US$ Mn)

TABLE 38 Global Compression Therapy Market, by Sports and Athletic Use, By Region, 2023-2030 (US$ Mn)

TABLE 39 Global Compression Therapy Market, by Post-Surgical and Wound Care, By Region, 2017-2022 (US$ Mn)

TABLE 40 Global Compression Therapy Market, by Post-Surgical and Wound Care, By Region, 2023-2030 (US$ Mn)

TABLE 41 Global Compression Therapy Market, by Others, By Region, 2017-2022 (US$ Mn)

TABLE 42 Global Compression Therapy Market, by Others, By Region, 2023-2030 (US$ Mn)

TABLE 43 Global Compression Therapy Market, by Elastic, By Region, 2017-2022 (US$ Mn)

TABLE 44 Global Compression Therapy Market, by Elastic, By Region, 2023-2030 (US$ Mn)

TABLE 45 Global Compression Therapy Market, by Inelastic, By Region, 2017-2022 (US$ Mn)

TABLE 46 Global Compression Therapy Market, by Inelastic, By Region, 2023-2030 (US$ Mn)

TABLE 47 Global Compression Therapy Market, by Other Materials, By Region, 2017-2022 (US$ Mn)

TABLE 48 Global Compression Therapy Market, by Other Materials, By Region, 2023-2030 (US$ Mn)

TABLE 49 Global Compression Therapy Market, by Hospitals and Clinics, By Region, 2017-2022 (US$ Mn)

TABLE 50 Global Compression Therapy Market, by Hospitals and Clinics, By Region, 2023-2030 (US$ Mn)

TABLE 51 Global Compression Therapy Market, by Homecare, By Region, 2017-2022 (US$ Mn)

TABLE 52 Global Compression Therapy Market, by Homecare, By Region, 2023-2030 (US$ Mn)

TABLE 53 Global Compression Therapy Market, by Rehabilitation Centers, By Region, 2017-2022 (US$ Mn)

TABLE 54 Global Compression Therapy Market, by Rehabilitation Centers, By Region, 2023-2030 (US$ Mn)

TABLE 55 Global Compression Therapy Market, by Sports and Fitness Centers, By Region, 2017-2022 (US$ Mn)

TABLE 56 Global Compression Therapy Market, by Sports and Fitness Centers, By Region, 2023-2030 (US$ Mn)

TABLE 57 Global Compression Therapy Market, by Male, By Region, 2017-2022 (US$ Mn)

TABLE 58 Global Compression Therapy Market, by Male, By Region, 2023-2030 (US$ Mn)

TABLE 59 Global Compression Therapy Market, by Female, By Region, 2017-2022 (US$ Mn)

TABLE 60 Global Compression Therapy Market, by Female, By Region, 2023-2030 (US$ Mn)

TABLE 61 Global Compression Therapy Market, by Adults, By Region, 2017-2022 (US$ Mn)

TABLE 62 Global Compression Therapy Market, by Adults, By Region, 2023-2030 (US$ Mn)

TABLE 63 Global Compression Therapy Market, by Pediatric, By Region, 2017-2022 (US$ Mn)

TABLE 64 Global Compression Therapy Market, by Pediatric, By Region, 2023-2030 (US$ Mn)

TABLE 65 Global Compression Therapy Market, by Product Type, 2017-2022 (US$ Mn)

TABLE 66 Global Compression Therapy Market, by Product Type, 2023-2030 (US$ Mn)

TABLE 67 Global Compression Therapy Market, by Compression Level, 2017-2022 (US$ Mn)

TABLE 68 Global Compression Therapy Market, by Compression Level, 2023-2030 (US$ Mn)

TABLE 69 Global Compression Therapy Market, by Application, 2017-2022 (US$ Mn)

TABLE 70 Global Compression Therapy Market, by Application, 2023-2030 (US$ Mn)

TABLE 71 Global Compression Therapy Market, by Compression Material, 2017-2022 (US$ Mn)

TABLE 72 Global Compression Therapy Market, by Compression Material, 2023-2030 (US$ Mn)

TABLE 73 Global Compression Therapy Market, by End User, 2017-2022 (US$ Mn)

TABLE 74 Global Compression Therapy Market, by End User, 2023-2030 (US$ Mn)

TABLE 75 Global Compression Therapy Market, by Gender, 2017-2022 (US$ Mn)

TABLE 76 Global Compression Therapy Market, by Gender, 2023-2030 (US$ Mn)

TABLE 77 Global Compression Therapy Market, by Age Group, 2017-2022 (US$ Mn)

TABLE 78 Global Compression Therapy Market, by Age Group, 2023-2030 (US$ Mn)

TABLE 79 Global Compression Therapy Market, by Region, 2017-2022 (US$ Mn)

TABLE 80 Global Compression Therapy Market, by Region, 2023-2030 (US$ Mn)

TABLE 81 North America Compression Therapy Market, by Product Type, 2017-2022 (US$ Mn)

TABLE 82 North America Compression Therapy Market, by Product Type, 2023-2030 (US$ Mn)

TABLE 83 North America Compression Therapy Market, by Compression Level, 2017-2022 (US$ Mn)

TABLE 84 North America Compression Therapy Market, by Compression Level, 2023-2030 (US$ Mn)

TABLE 85 North America Compression Therapy Market, by Application, 2017-2022 (US$ Mn)

TABLE 86 North America Compression Therapy Market, by Application, 2023-2030 (US$ Mn)

TABLE 87 North America Compression Therapy Market, by Compression Material, 2017-2022 (US$ Mn)

TABLE 88 North America Compression Therapy Market, by Compression Material, 2023-2030 (US$ Mn)

TABLE 89 North America Compression Therapy Market, by End User, 2017-2022 (US$ Mn)

TABLE 90 North America Compression Therapy Market, by End User, 2023-2030 (US$ Mn)

TABLE 91 North America Compression Therapy Market, by Gender, 2017-2022 (US$ Mn)

TABLE 92 North America Compression Therapy Market, by Gender, 2023-2030 (US$ Mn)

TABLE 93 North America Compression Therapy Market, by Age Group, 2017-2022 (US$ Mn)

TABLE 94 North America Compression Therapy Market, by Age Group, 2023-2030 (US$ Mn)

TABLE 95 North America Compression Therapy Market, by Country, 2017-2022 (US$ Mn)

TABLE 96 North America Compression Therapy Market, by Country, 2023-2030 (US$ Mn)

TABLE 97 United States Compression Therapy Market, by Product Type, 2017-2022 (US$ Mn)

TABLE 98 United States Compression Therapy Market, by Product Type, 2023-2030 (US$ Mn)

TABLE 99 United States Compression Therapy Market, by Compression Level, 2017-2022 (US$ Mn)

TABLE 100 United States Compression Therapy Market, by Compression Level, 2023-2030 (US$ Mn)

TABLE 101 United States Compression Therapy Market, by Application, 2017-2022 (US$ Mn)

TABLE 102 United States Compression Therapy Market, by Application, 2023-2030 (US$ Mn)

TABLE 103 United States Compression Therapy Market, by Compression Material, 2017-2022 (US$ Mn)

TABLE 104 United States Compression Therapy Market, by Compression Material, 2023-2030 (US$ Mn)

TABLE 105 United States Compression Therapy Market, by End User, 2017-2022 (US$ Mn)

TABLE 106 United States Compression Therapy Market, by End User, 2023-2030 (US$ Mn)

TABLE 107 United States Compression Therapy Market, by Gender, 2017-2022 (US$ Mn)

TABLE 108 United States Compression Therapy Market, by Gender, 2023-2030 (US$ Mn)

TABLE 109 United States Compression Therapy Market, by Age Group, 2017-2022 (US$ Mn)

TABLE 110 United States Compression Therapy Market, by Age Group, 2023-2030 (US$ Mn)

TABLE 111 Canada Compression Therapy Market, by Product Type, 2017-2022 (US$ Mn)

TABLE 112 Canada Compression Therapy Market, by Product Type, 2023-2030 (US$ Mn)

TABLE 113 Canada Compression Therapy Market, by Compression Level, 2017-2022 (US$ Mn)

TABLE 114 Canada Compression Therapy Market, by Compression Level, 2023-2030 (US$ Mn)

TABLE 115 Canada Compression Therapy Market, by Application, 2017-2022 (US$ Mn)

TABLE 116 Canada Compression Therapy Market, by Application, 2023-2030 (US$ Mn)

TABLE 117 Canada Compression Therapy Market, by Compression Material, 2017-2022 (US$ Mn)

TABLE 118 Canada Compression Therapy Market, by Compression Material, 2023-2030 (US$ Mn)

TABLE 119 Canada Compression Therapy Market, by End User, 2017-2022 (US$ Mn)

TABLE 120 Canada Compression Therapy Market, by End User, 2023-2030 (US$ Mn)

TABLE 121 Canada Compression Therapy Market, by Gender, 2017-2022 (US$ Mn)

TABLE 122 Canada Compression Therapy Market, by Gender, 2023-2030 (US$ Mn)

TABLE 123 Canada Compression Therapy Market, by Age Group, 2017-2022 (US$ Mn)

TABLE 124 Canada Compression Therapy Market, by Age Group, 2023-2030 (US$ Mn)

TABLE 125 Mexico Compression Therapy Market, by Product Type, 2017-2022 (US$ Mn)

TABLE 126 Mexico Compression Therapy Market, by Product Type, 2023-2030 (US$ Mn)

TABLE 127 Mexico Compression Therapy Market, by Compression Level, 2017-2022 (US$ Mn)

TABLE 128 Mexico Compression Therapy Market, by Compression Level, 2023-2030 (US$ Mn)

TABLE 129 Mexico Compression Therapy Market, by Application, 2017-2022 (US$ Mn)

TABLE 130 Mexico Compression Therapy Market, by Application, 2023-2030 (US$ Mn)

TABLE 131 Mexico Compression Therapy Market, by Compression Material, 2017-2022 (US$ Mn)

TABLE 132 Mexico Compression Therapy Market, by Compression Material, 2023-2030 (US$ Mn)

TABLE 133 Mexico Compression Therapy Market, by End User, 2017-2022 (US$ Mn)

TABLE 134 Mexico Compression Therapy Market, by End User, 2023-2030 (US$ Mn)

TABLE 135 Mexico Compression Therapy Market, by Gender, 2017-2022 (US$ Mn)

TABLE 136 Mexico Compression Therapy Market, by Gender, 2023-2030 (US$ Mn)

TABLE 137 Mexico Compression Therapy Market, by Age Group, 2017-2022 (US$ Mn)

TABLE 138 Mexico Compression Therapy Market, by Age Group, 2023-2030 (US$ Mn)

TABLE 139 Europe Compression Therapy Market, by Product Type, 2017-2022 (US$ Mn)

TABLE 140 Europe Compression Therapy Market, by Product Type, 2023-2030 (US$ Mn)

TABLE 141 Europe Compression Therapy Market, by Compression Level, 2017-2022 (US$ Mn)

TABLE 142 Europe Compression Therapy Market, by Compression Level, 2023-2030 (US$ Mn)

TABLE 143 Europe Compression Therapy Market, by Application, 2017-2022 (US$ Mn)

TABLE 144 Europe Compression Therapy Market, by Application, 2023-2030 (US$ Mn)

TABLE 145 Europe Compression Therapy Market, by Compression Material, 2017-2022 (US$ Mn)

TABLE 146 Europe Compression Therapy Market, by Compression Material, 2023-2030 (US$ Mn)

TABLE 147 Europe Compression Therapy Market, by End User, 2017-2022 (US$ Mn)

TABLE 148 Europe Compression Therapy Market, by End User, 2023-2030 (US$ Mn)

TABLE 149 Europe Compression Therapy Market, by Gender, 2017-2022 (US$ Mn)

TABLE 150 Europe Compression Therapy Market, by Gender, 2023-2030 (US$ Mn)

TABLE 151 Europe Compression Therapy Market, by Age Group, 2017-2022 (US$ Mn)

TABLE 152 Europe Compression Therapy Market, by Age Group, 2023-2030 (US$ Mn)

TABLE 153 Europe Compression Therapy Market, by Country, 2017-2022 (US$ Mn)

TABLE 154 Europe Compression Therapy Market, by Country, 2023-2030 (US$ Mn)

TABLE 155 Germany Compression Therapy Market, by Product Type, 2017-2022 (US$ Mn)

TABLE 156 Germany Compression Therapy Market, by Product Type, 2023-2030 (US$ Mn)

TABLE 157 Germany Compression Therapy Market, by Compression Level, 2017-2022 (US$ Mn)

TABLE 158 Germany Compression Therapy Market, by Compression Level, 2023-2030 (US$ Mn)

TABLE 159 Germany Compression Therapy Market, by Application, 2017-2022 (US$ Mn)

TABLE 160 Germany Compression Therapy Market, by Application, 2023-2030 (US$ Mn)

TABLE 161 Germany Compression Therapy Market, by Compression Material, 2017-2022 (US$ Mn)

TABLE 162 Germany Compression Therapy Market, by Compression Material, 2023-2030 (US$ Mn)

TABLE 163 Germany Compression Therapy Market, by End User, 2017-2022 (US$ Mn)

TABLE 164 Germany Compression Therapy Market, by End User, 2023-2030 (US$ Mn)

TABLE 165 Germany Compression Therapy Market, by Gender, 2017-2022 (US$ Mn)

TABLE 166 Germany Compression Therapy Market, by Gender, 2023-2030 (US$ Mn)

TABLE 167 Germany Compression Therapy Market, by Age Group, 2017-2022 (US$ Mn)

TABLE 168 Germany Compression Therapy Market, by Age Group, 2023-2030 (US$ Mn)

TABLE 169 France Compression Therapy Market, by Product Type, 2017-2022 (US$ Mn)

TABLE 170 France Compression Therapy Market, by Product Type, 2023-2030 (US$ Mn)

TABLE 171 France Compression Therapy Market, by Compression Level, 2017-2022 (US$ Mn)

TABLE 172 France Compression Therapy Market, by Compression Level, 2023-2030 (US$ Mn)

TABLE 173 France Compression Therapy Market, by Application, 2017-2022 (US$ Mn)

TABLE 174 France Compression Therapy Market, by Application, 2023-2030 (US$ Mn)

TABLE 175 France Compression Therapy Market, by Compression Material, 2017-2022 (US$ Mn)

TABLE 176 France Compression Therapy Market, by Compression Material, 2023-2030 (US$ Mn)

TABLE 177 France Compression Therapy Market, by End User, 2017-2022 (US$ Mn)

TABLE 178 France Compression Therapy Market, by End User, 2023-2030 (US$ Mn)

TABLE 179 France Compression Therapy Market, by Gender, 2017-2022 (US$ Mn)

TABLE 180 France Compression Therapy Market, by Gender, 2023-2030 (US$ Mn)

TABLE 181 France Compression Therapy Market, by Age Group, 2017-2022 (US$ Mn)

TABLE 182 France Compression Therapy Market, by Age Group, 2023-2030 (US$ Mn)

TABLE 183 United Kingdom Compression Therapy Market, by Product Type, 2017-2022 (US$ Mn)

TABLE 184 United Kingdom Compression Therapy Market, by Product Type, 2023-2030 (US$ Mn)

TABLE 185 United Kingdom Compression Therapy Market, by Compression Level, 2017-2022 (US$ Mn)

TABLE 186 United Kingdom Compression Therapy Market, by Compression Level, 2023-2030 (US$ Mn)

TABLE 187 United Kingdom Compression Therapy Market, by Application, 2017-2022 (US$ Mn)

TABLE 188 United Kingdom Compression Therapy Market, by Application, 2023-2030 (US$ Mn)

TABLE 189 United Kingdom Compression Therapy Market, by Compression Material, 2017-2022 (US$ Mn)

TABLE 190 United Kingdom Compression Therapy Market, by Compression Material, 2023-2030 (US$ Mn)

TABLE 191 United Kingdom Compression Therapy Market, by End User, 2017-2022 (US$ Mn)

TABLE 192 United Kingdom Compression Therapy Market, by End User, 2023-2030 (US$ Mn)

TABLE 193 United Kingdom Compression Therapy Market, by Gender, 2017-2022 (US$ Mn)

TABLE 194 United Kingdom Compression Therapy Market, by Gender, 2023-2030 (US$ Mn)

TABLE 195 United Kingdom Compression Therapy Market, by Age Group, 2017-2022 (US$ Mn)

TABLE 196 United Kingdom Compression Therapy Market, by Age Group, 2023-2030 (US$ Mn)

TABLE 197 Italy Compression Therapy Market, by Product Type, 2017-2022 (US$ Mn)

TABLE 198 Italy Compression Therapy Market, by Product Type, 2023-2030 (US$ Mn)

TABLE 199 Italy Compression Therapy Market, by Compression Level, 2017-2022 (US$ Mn)

TABLE 200 Italy Compression Therapy Market, by Compression Level, 2023-2030 (US$ Mn)

TABLE 201 Italy Compression Therapy Market, by Application, 2017-2022 (US$ Mn)

TABLE 202 Italy Compression Therapy Market, by Application, 2023-2030 (US$ Mn)

TABLE 203 Italy Compression Therapy Market, by Compression Material, 2017-2022 (US$ Mn)

TABLE 204 Italy Compression Therapy Market, by Compression Material, 2023-2030 (US$ Mn)

TABLE 205 Italy Compression Therapy Market, by End User, 2017-2022 (US$ Mn)

TABLE 206 Italy Compression Therapy Market, by End User, 2023-2030 (US$ Mn)

TABLE 207 Italy Compression Therapy Market, by Gender, 2017-2022 (US$ Mn)

TABLE 208 Italy Compression Therapy Market, by Gender, 2023-2030 (US$ Mn)

TABLE 209 Italy Compression Therapy Market, by Age Group, 2017-2022 (US$ Mn)

TABLE 210 Italy Compression Therapy Market, by Age Group, 2023-2030 (US$ Mn)

TABLE 211 Spain Compression Therapy Market, by Product Type, 2017-2022 (US$ Mn)

TABLE 212 Spain Compression Therapy Market, by Product Type, 2023-2030 (US$ Mn)

TABLE 213 Spain Compression Therapy Market, by Compression Level, 2017-2022 (US$ Mn)

TABLE 214 Spain Compression Therapy Market, by Compression Level, 2023-2030 (US$ Mn)

TABLE 215 Spain Compression Therapy Market, by Application, 2017-2022 (US$ Mn)

TABLE 216 Spain Compression Therapy Market, by Application, 2023-2030 (US$ Mn)

TABLE 217 Spain Compression Therapy Market, by Compression Material, 2017-2022 (US$ Mn)

TABLE 218 Spain Compression Therapy Market, by Compression Material, 2023-2030 (US$ Mn)

TABLE 219 Spain Compression Therapy Market, by End User, 2017-2022 (US$ Mn)

TABLE 220 Spain Compression Therapy Market, by End User, 2023-2030 (US$ Mn)

TABLE 221 Spain Compression Therapy Market, by Gender, 2017-2022 (US$ Mn)

TABLE 222 Spain Compression Therapy Market, by Gender, 2023-2030 (US$ Mn)

TABLE 223 Spain Compression Therapy Market, by Age Group, 2017-2022 (US$ Mn)

TABLE 224 Spain Compression Therapy Market, by Age Group, 2023-2030 (US$ Mn)

TABLE 225 Benelux Compression Therapy Market, by Product Type, 2017-2022 (US$ Mn)

TABLE 226 Benelux Compression Therapy Market, by Product Type, 2023-2030 (US$ Mn)

TABLE 227 Benelux Compression Therapy Market, by Compression Level, 2017-2022 (US$ Mn)

TABLE 228 Benelux Compression Therapy Market, by Compression Level, 2023-2030 (US$ Mn)

TABLE 229 Benelux Compression Therapy Market, by Application, 2017-2022 (US$ Mn)

TABLE 230 Benelux Compression Therapy Market, by Application, 2023-2030 (US$ Mn)

TABLE 231 Benelux Compression Therapy Market, by Compression Material, 2017-2022 (US$ Mn)

TABLE 232 Benelux Compression Therapy Market, by Compression Material, 2023-2030 (US$ Mn)

TABLE 233 Benelux Compression Therapy Market, by End User, 2017-2022 (US$ Mn)

TABLE 234 Benelux Compression Therapy Market, by End User, 2023-2030 (US$ Mn)

TABLE 235 Benelux Compression Therapy Market, by Gender, 2017-2022 (US$ Mn)

TABLE 236 Benelux Compression Therapy Market, by Gender, 2023-2030 (US$ Mn)

TABLE 237 Benelux Compression Therapy Market, by Age Group, 2017-2022 (US$ Mn)

TABLE 238 Benelux Compression Therapy Market, by Age Group, 2023-2030 (US$ Mn)

TABLE 239 Russia Compression Therapy Market, by Product Type, 2017-2022 (US$ Mn)

TABLE 240 Russia Compression Therapy Market, by Product Type, 2023-2030 (US$ Mn)

TABLE 241 Russia Compression Therapy Market, by Compression Level, 2017-2022 (US$ Mn)

TABLE 242 Russia Compression Therapy Market, by Compression Level, 2023-2030 (US$ Mn)

TABLE 243 Russia Compression Therapy Market, by Application, 2017-2022 (US$ Mn)

TABLE 244 Russia Compression Therapy Market, by Application, 2023-2030 (US$ Mn)

TABLE 245 Russia Compression Therapy Market, by Compression Material, 2017-2022 (US$ Mn)

TABLE 246 Russia Compression Therapy Market, by Compression Material, 2023-2030 (US$ Mn)

TABLE 247 Russia Compression Therapy Market, by End User, 2017-2022 (US$ Mn)

TABLE 248 Russia Compression Therapy Market, by End User, 2023-2030 (US$ Mn)

TABLE 249 Russia Compression Therapy Market, by Gender, 2017-2022 (US$ Mn)

TABLE 250 Russia Compression Therapy Market, by Gender, 2023-2030 (US$ Mn)

TABLE 251 Russia Compression Therapy Market, by Age Group, 2017-2022 (US$ Mn)

TABLE 252 Russia Compression Therapy Market, by Age Group, 2023-2030 (US$ Mn)

TABLE 253 Rest of Europe Compression Therapy Market, by Product Type, 2017-2022 (US$ Mn)

TABLE 254 Rest of Europe Compression Therapy Market, by Product Type, 2023-2030 (US$ Mn)

TABLE 255 Rest of Europe Compression Therapy Market, by Compression Level, 2017-2022 (US$ Mn)

TABLE 256 Rest of Europe Compression Therapy Market, by Compression Level, 2023-2030 (US$ Mn)

TABLE 257 Rest of Europe Compression Therapy Market, by Application, 2017-2022 (US$ Mn)

TABLE 258 Rest of Europe Compression Therapy Market, by Application, 2023-2030 (US$ Mn)

TABLE 259 Rest of Europe Compression Therapy Market, by Compression Material, 2017-2022 (US$ Mn)

TABLE 260 Rest of Europe Compression Therapy Market, by Compression Material, 2023-2030 (US$ Mn)

TABLE 261 Rest of Europe Compression Therapy Market, by End User, 2017-2022 (US$ Mn)

TABLE 262 Rest of Europe Compression Therapy Market, by End User, 2023-2030 (US$ Mn)

TABLE 263 Rest of Europe Compression Therapy Market, by Gender, 2017-2022 (US$ Mn)

TABLE 264 Rest of Europe Compression Therapy Market, by Gender, 2023-2030 (US$ Mn)

TABLE 265 Rest of Europe Compression Therapy Market, by Age Group, 2017-2022 (US$ Mn)

TABLE 266 Rest of Europe Compression Therapy Market, by Age Group, 2023-2030 (US$ Mn)

TABLE 267 Asia Pacific Compression Therapy Market, by Product Type, 2017-2022 (US$ Mn)

TABLE 268 Asia Pacific Compression Therapy Market, by Product Type, 2023-2030 (US$ Mn)

TABLE 269 Asia Pacific Compression Therapy Market, by Compression Level, 2017-2022 (US$ Mn)

TABLE 270 Asia Pacific Compression Therapy Market, by Compression Level, 2023-2030 (US$ Mn)

TABLE 271 Asia Pacific Compression Therapy Market, by Application, 2017-2022 (US$ Mn)

TABLE 272 Asia Pacific Compression Therapy Market, by Application, 2023-2030 (US$ Mn)

TABLE 273 Asia Pacific Compression Therapy Market, by Compression Material, 2017-2022 (US$ Mn)

TABLE 274 Asia Pacific Compression Therapy Market, by Compression Material, 2023-2030 (US$ Mn)

TABLE 275 Asia Pacific Compression Therapy Market, by End User, 2017-2022 (US$ Mn)

TABLE 276 Asia Pacific Compression Therapy Market, by End User, 2023-2030 (US$ Mn)

TABLE 277 Asia Pacific Compression Therapy Market, by Gender, 2017-2022 (US$ Mn)

TABLE 278 Asia Pacific Compression Therapy Market, by Gender, 2023-2030 (US$ Mn)

TABLE 279 Asia Pacific Compression Therapy Market, by Age Group, 2017-2022 (US$ Mn)

TABLE 280 Asia Pacific Compression Therapy Market, by Age Group, 2023-2030 (US$ Mn)

TABLE 281 China Compression Therapy Market, by Product Type, 2017-2022 (US$ Mn)

TABLE 282 China Compression Therapy Market, by Product Type, 2023-2030 (US$ Mn)

TABLE 283 China Compression Therapy Market, by Compression Level, 2017-2022 (US$ Mn)

TABLE 284 China Compression Therapy Market, by Compression Level, 2023-2030 (US$ Mn)

TABLE 285 China Compression Therapy Market, by Application, 2017-2022 (US$ Mn)

TABLE 286 China Compression Therapy Market, by Application, 2023-2030 (US$ Mn)

TABLE 287 China Compression Therapy Market, by Compression Material, 2017-2022 (US$ Mn)

TABLE 288 China Compression Therapy Market, by Compression Material, 2023-2030 (US$ Mn)

TABLE 289 China Compression Therapy Market, by End User, 2017-2022 (US$ Mn)

TABLE 290 China Compression Therapy Market, by End User, 2023-2030 (US$ Mn)

TABLE 291 China Compression Therapy Market, by Gender, 2017-2022 (US$ Mn)

TABLE 292 China Compression Therapy Market, by Gender, 2023-2030 (US$ Mn)

TABLE 293 China Compression Therapy Market, by Age Group, 2017-2022 (US$ Mn)

TABLE 294 China Compression Therapy Market, by Age Group, 2023-2030 (US$ Mn)

TABLE 295 Japan Compression Therapy Market, by Product Type, 2017-2022 (US$ Mn)

TABLE 296 Japan Compression Therapy Market, by Product Type, 2023-2030 (US$ Mn)

TABLE 297 Japan Compression Therapy Market, by Compression Level, 2017-2022 (US$ Mn)

TABLE 298 Japan Compression Therapy Market, by Compression Level, 2023-2030 (US$ Mn)

TABLE 299 Japan Compression Therapy Market, by Application, 2017-2022 (US$ Mn)

TABLE 300 Japan Compression Therapy Market, by Application, 2023-2030 (US$ Mn)

TABLE 301 Japan Compression Therapy Market, by Compression Material, 2017-2022 (US$ Mn)

TABLE 302 Japan Compression Therapy Market, by Compression Material, 2023-2030 (US$ Mn)

TABLE 303 Japan Compression Therapy Market, by End User, 2017-2022 (US$ Mn)

TABLE 304 Japan Compression Therapy Market, by End User, 2023-2030 (US$ Mn)

TABLE 305 Japan Compression Therapy Market, by Gender, 2017-2022 (US$ Mn)

TABLE 306 Japan Compression Therapy Market, by Gender, 2023-2030 (US$ Mn)

TABLE 307 Japan Compression Therapy Market, by Age Group, 2017-2022 (US$ Mn)

TABLE 308 Japan Compression Therapy Market, by Age Group, 2023-2030 (US$ Mn)

TABLE 309 India Compression Therapy Market, by Product Type, 2017-2022 (US$ Mn)

TABLE 310 India Compression Therapy Market, by Product Type, 2023-2030 (US$ Mn)

TABLE 311 India Compression Therapy Market, by Compression Level, 2017-2022 (US$ Mn)

TABLE 312 India Compression Therapy Market, by Compression Level, 2023-2030 (US$ Mn)

TABLE 313 India Compression Therapy Market, by Application, 2017-2022 (US$ Mn)

TABLE 314 India Compression Therapy Market, by Application, 2023-2030 (US$ Mn)

TABLE 315 India Compression Therapy Market, by Compression Material, 2017-2022 (US$ Mn)

TABLE 316 India Compression Therapy Market, by Compression Material, 2023-2030 (US$ Mn)

TABLE 317 India Compression Therapy Market, by End User, 2017-2022 (US$ Mn)

TABLE 318 India Compression Therapy Market, by End User, 2023-2030 (US$ Mn)

TABLE 319 India Compression Therapy Market, by Gender, 2017-2022 (US$ Mn)

TABLE 320 India Compression Therapy Market, by Gender, 2023-2030 (US$ Mn)

TABLE 321 India Compression Therapy Market, by Age Group, 2017-2022 (US$ Mn)

TABLE 322 India Compression Therapy Market, by Age Group, 2023-2030 (US$ Mn)

TABLE 323 South Korea Compression Therapy Market, by Product Type, 2017-2022 (US$ Mn)

TABLE 324 South Korea Compression Therapy Market, by Product Type, 2023-2030 (US$ Mn)

TABLE 325 South Korea Compression Therapy Market, by Compression Level, 2017-2022 (US$ Mn)

TABLE 326 South Korea Compression Therapy Market, by Compression Level, 2023-2030 (US$ Mn)

TABLE 327 South Korea Compression Therapy Market, by Application, 2017-2022 (US$ Mn)

TABLE 328 South Korea Compression Therapy Market, by Application, 2023-2030 (US$ Mn)

TABLE 329 South Korea Compression Therapy Market, by Compression Material, 2017-2022 (US$ Mn)

TABLE 330 South Korea Compression Therapy Market, by Compression Material, 2023-2030 (US$ Mn)

TABLE 331 South Korea Compression Therapy Market, by End User, 2017-2022 (US$ Mn)

TABLE 332 South Korea Compression Therapy Market, by End User, 2023-2030 (US$ Mn)

TABLE 333 South Korea Compression Therapy Market, by Gender, 2017-2022 (US$ Mn)

TABLE 334 South Korea Compression Therapy Market, by Gender, 2023-2030 (US$ Mn)

TABLE 335 South Korea Compression Therapy Market, by Age Group, 2017-2022 (US$ Mn)

TABLE 336 South Korea Compression Therapy Market, by Age Group, 2023-2030 (US$ Mn)

TABLE 337 South-East Asia Compression Therapy Market, by Product Type, 2017-2022 (US$ Mn)

TABLE 338 South-East Asia Compression Therapy Market, by Product Type, 2023-2030 (US$ Mn)

TABLE 339 South-East Asia Compression Therapy Market, by Compression Level, 2017-2022 (US$ Mn)

TABLE 340 South-East Asia Compression Therapy Market, by Compression Level, 2023-2030 (US$ Mn)

TABLE 341 South-East Asia Compression Therapy Market, by Application, 2017-2022 (US$ Mn)

TABLE 342 South-East Asia Compression Therapy Market, by Application, 2023-2030 (US$ Mn)

TABLE 343 South-East Asia Compression Therapy Market, by Compression Material, 2017-2022 (US$ Mn)

TABLE 344 South-East Asia Compression Therapy Market, by Compression Material, 2023-2030 (US$ Mn)

TABLE 345 South-East Asia Compression Therapy Market, by End User, 2017-2022 (US$ Mn)

TABLE 346 South-East Asia Compression Therapy Market, by End User, 2023-2030 (US$ Mn)

TABLE 347 South-East Asia Compression Therapy Market, by Gender, 2017-2022 (US$ Mn)

TABLE 348 South-East Asia Compression Therapy Market, by Gender, 2023-2030 (US$ Mn)

TABLE 349 South-East Asia Compression Therapy Market, by Age Group, 2017-2022 (US$ Mn)

TABLE 350 South-East Asia Compression Therapy Market, by Age Group, 2023-2030 (US$ Mn)

TABLE 351 Rest of Asia Pacific Compression Therapy Market, by Product Type, 2017-2022 (US$ Mn)

TABLE 352 Rest of Asia Pacific Compression Therapy Market, by Product Type, 2023-2030 (US$ Mn)

TABLE 353 Rest of Asia Pacific Compression Therapy Market, by Compression Level, 2017-2022 (US$ Mn)

TABLE 354 Rest of Asia Pacific Compression Therapy Market, by Compression Level, 2023-2030 (US$ Mn)

TABLE 355 Rest of Asia Pacific Compression Therapy Market, by Application, 2017-2022 (US$ Mn)

TABLE 356 Rest of Asia Pacific Compression Therapy Market, by Application, 2023-2030 (US$ Mn)

TABLE 357 Rest of Asia Pacific Compression Therapy Market, by Compression Material, 2017-2022 (US$ Mn)

TABLE 358 Rest of Asia Pacific Compression Therapy Market, by Compression Material, 2023-2030 (US$ Mn)

TABLE 359 Rest of Asia Pacific Compression Therapy Market, by End User, 2017-2022 (US$ Mn)

TABLE 360 Rest of Asia Pacific Compression Therapy Market, by End User, 2023-2030 (US$ Mn)

TABLE 361 Rest of Asia Pacific Compression Therapy Market, by Gender, 2017-2022 (US$ Mn)

TABLE 362 Rest of Asia Pacific Compression Therapy Market, by Gender, 2023-2030 (US$ Mn)

TABLE 363 Rest of Asia Pacific Compression Therapy Market, by Age Group, 2017-2022 (US$ Mn)

TABLE 364 Rest of Asia Pacific Compression Therapy Market, by Age Group, 2023-2030 (US$ Mn)

TABLE 365 Latin America Compression Therapy Market, by Product Type, 2017-2022 (US$ Mn)

TABLE 366 Latin America Compression Therapy Market, by Product Type, 2023-2030 (US$ Mn)

TABLE 367 Latin America Compression Therapy Market, by Compression Level, 2017-2022 (US$ Mn)

TABLE 368 Latin America Compression Therapy Market, by Compression Level, 2023-2030 (US$ Mn)

TABLE 369 Latin America Compression Therapy Market, by Application, 2017-2022 (US$ Mn)

TABLE 370 Latin America Compression Therapy Market, by Application, 2023-2030 (US$ Mn)

TABLE 371 Latin America Compression Therapy Market, by Compression Material, 2017-2022 (US$ Mn)

TABLE 372 Latin America Compression Therapy Market, by Compression Material, 2023-2030 (US$ Mn)

TABLE 373 Latin America Compression Therapy Market, by End User, 2017-2022 (US$ Mn)

TABLE 374 Latin America Compression Therapy Market, by End User, 2023-2030 (US$ Mn)

TABLE 375 Latin America Compression Therapy Market, by Gender, 2017-2022 (US$ Mn)

TABLE 376 Latin America Compression Therapy Market, by Gender, 2023-2030 (US$ Mn)

TABLE 377 Latin America Compression Therapy Market, by Age Group, 2017-2022 (US$ Mn)

TABLE 378 Latin America Compression Therapy Market, by Age Group, 2023-2030 (US$ Mn)

TABLE 379 Brazil Compression Therapy Market, by Product Type, 2017-2022 (US$ Mn)

TABLE 380 Brazil Compression Therapy Market, by Product Type, 2023-2030 (US$ Mn)

TABLE 381 Brazil Compression Therapy Market, by Compression Level, 2017-2022 (US$ Mn)

TABLE 382 Brazil Compression Therapy Market, by Compression Level, 2023-2030 (US$ Mn)

TABLE 383 Brazil Compression Therapy Market, by Application, 2017-2022 (US$ Mn)

TABLE 384 Brazil Compression Therapy Market, by Application, 2023-2030 (US$ Mn)

TABLE 385 Brazil Compression Therapy Market, by Compression Material, 2017-2022 (US$ Mn)

TABLE 386 Brazil Compression Therapy Market, by Compression Material, 2023-2030 (US$ Mn)

TABLE 387 Brazil Compression Therapy Market, by End User, 2017-2022 (US$ Mn)

TABLE 388 Brazil Compression Therapy Market, by End User, 2023-2030 (US$ Mn)

TABLE 389 Brazil Compression Therapy Market, by Gender, 2017-2022 (US$ Mn)

TABLE 390 Brazil Compression Therapy Market, by Gender, 2023-2030 (US$ Mn)

TABLE 391 Brazil Compression Therapy Market, by Age Group, 2017-2022 (US$ Mn)

TABLE 392 Brazil Compression Therapy Market, by Age Group, 2023-2030 (US$ Mn)

TABLE 393 Argentina Compression Therapy Market, by Product Type, 2017-2022 (US$ Mn)

TABLE 394 Argentina Compression Therapy Market, by Product Type, 2023-2030 (US$ Mn)

TABLE 395 Argentina Compression Therapy Market, by Compression Level, 2017-2022 (US$ Mn)

TABLE 396 Argentina Compression Therapy Market, by Compression Level, 2023-2030 (US$ Mn)

TABLE 397 Argentina Compression Therapy Market, by Application, 2017-2022 (US$ Mn)

TABLE 398 Argentina Compression Therapy Market, by Application, 2023-2030 (US$ Mn)

TABLE 399 Argentina Compression Therapy Market, by Compression Material, 2017-2022 (US$ Mn)

TABLE 400 Argentina Compression Therapy Market, by Compression Material, 2023-2030 (US$ Mn)

TABLE 401 Argentina Compression Therapy Market, by End User, 2017-2022 (US$ Mn)

TABLE 402 Argentina Compression Therapy Market, by End User, 2023-2030 (US$ Mn)

TABLE 403 Argentina Compression Therapy Market, by Gender, 2017-2022 (US$ Mn)

TABLE 404 Argentina Compression Therapy Market, by Gender, 2023-2030 (US$ Mn)

TABLE 405 Argentina Compression Therapy Market, by Age Group, 2017-2022 (US$ Mn)

TABLE 406 Argentina Compression Therapy Market, by Age Group, 2023-2030 (US$ Mn)

TABLE 407 Rest of Latin America Compression Therapy Market, by Product Type, 2017-2022 (US$ Mn)

TABLE 408 Rest of Latin America Compression Therapy Market, by Product Type, 2023-2030 (US$ Mn)

TABLE 409 Rest of Latin America Compression Therapy Market, by Compression Level, 2017-2022 (US$ Mn)

TABLE 410 Rest of Latin America Compression Therapy Market, by Compression Level, 2023-2030 (US$ Mn)

TABLE 411 Rest of Latin America Compression Therapy Market, by Application, 2017-2022 (US$ Mn)

TABLE 412 Rest of Latin America Compression Therapy Market, by Application, 2023-2030 (US$ Mn)

TABLE 413 Rest of Latin America Compression Therapy Market, by Compression Material, 2017-2022 (US$ Mn)

TABLE 414 Rest of Latin America Compression Therapy Market, by Compression Material, 2023-2030 (US$ Mn)

TABLE 415 Rest of Latin America Compression Therapy Market, by End User, 2017-2022 (US$ Mn)

TABLE 416 Rest of Latin America Compression Therapy Market, by End User, 2023-2030 (US$ Mn)

TABLE 417 Rest of Latin America Compression Therapy Market, by Gender, 2017-2022 (US$ Mn)

TABLE 418 Rest of Latin America Compression Therapy Market, by Gender, 2023-2030 (US$ Mn)

TABLE 419 Rest of Latin America Compression Therapy Market, by Age Group, 2017-2022 (US$ Mn)

TABLE 420 Rest of Latin America Compression Therapy Market, by Age Group, 2023-2030 (US$ Mn)

TABLE 421 Middle East Compression Therapy Market, by Product Type, 2017-2022 (US$ Mn)

TABLE 422 Middle East Compression Therapy Market, by Product Type, 2023-2030 (US$ Mn)

TABLE 423 Middle East Compression Therapy Market, by Compression Level, 2017-2022 (US$ Mn)

TABLE 424 Middle East Compression Therapy Market, by Compression Level, 2023-2030 (US$ Mn)

TABLE 425 Middle East Compression Therapy Market, by Application, 2017-2022 (US$ Mn)

TABLE 426 Middle East Compression Therapy Market, by Application, 2023-2030 (US$ Mn)

TABLE 427 Middle East Compression Therapy Market, by Compression Material, 2017-2022 (US$ Mn)

TABLE 428 Middle East Compression Therapy Market, by Compression Material, 2023-2030 (US$ Mn)

TABLE 429 Middle East Compression Therapy Market, by End User, 2017-2022 (US$ Mn)

TABLE 430 Middle East Compression Therapy Market, by End User, 2023-2030 (US$ Mn)

TABLE 431 Middle East Compression Therapy Market, by Gender, 2017-2022 (US$ Mn)

TABLE 432 Middle East Compression Therapy Market, by Gender, 2023-2030 (US$ Mn)

TABLE 433 Middle East Compression Therapy Market, by Age Group, 2017-2022 (US$ Mn)

TABLE 434 Middle East Compression Therapy Market, by Age Group, 2023-2030 (US$ Mn)

TABLE 435 UAE Compression Therapy Market, by Product Type, 2017-2022 (US$ Mn)

TABLE 436 UAE Compression Therapy Market, by Product Type, 2023-2030 (US$ Mn)

TABLE 437 UAE Compression Therapy Market, by Compression Level, 2017-2022 (US$ Mn)

TABLE 438 UAE Compression Therapy Market, by Compression Level, 2023-2030 (US$ Mn)

TABLE 439 UAE Compression Therapy Market, by Application, 2017-2022 (US$ Mn)

TABLE 440 UAE Compression Therapy Market, by Application, 2023-2030 (US$ Mn)

TABLE 441 UAE Compression Therapy Market, by Compression Material, 2017-2022 (US$ Mn)

TABLE 442 UAE Compression Therapy Market, by Compression Material, 2023-2030 (US$ Mn)

TABLE 443 UAE Compression Therapy Market, by End User, 2017-2022 (US$ Mn)

TABLE 444 UAE Compression Therapy Market, by End User, 2023-2030 (US$ Mn)

TABLE 445 UAE Compression Therapy Market, by Gender, 2017-2022 (US$ Mn)

TABLE 446 UAE Compression Therapy Market, by Gender, 2023-2030 (US$ Mn)

TABLE 447 UAE Compression Therapy Market, by Age Group, 2017-2022 (US$ Mn)

TABLE 448 UAE Compression Therapy Market, by Age Group, 2023-2030 (US$ Mn)

TABLE 449 Saudi Arabia Compression Therapy Market, by Product Type, 2017-2022 (US$ Mn)

TABLE 450 Saudi Arabia Compression Therapy Market, by Product Type, 2023-2030 (US$ Mn)

TABLE 451 Saudi Arabia Compression Therapy Market, by Compression Level, 2017-2022 (US$ Mn)

TABLE 452 Saudi Arabia Compression Therapy Market, by Compression Level, 2023-2030 (US$ Mn)

TABLE 453 Saudi Arabia Compression Therapy Market, by Application, 2017-2022 (US$ Mn)

TABLE 454 Saudi Arabia Compression Therapy Market, by Application, 2023-2030 (US$ Mn)

TABLE 455 Saudi Arabia Compression Therapy Market, by Compression Material, 2017-2022 (US$ Mn)

TABLE 456 Saudi Arabia Compression Therapy Market, by Compression Material, 2023-2030 (US$ Mn)

TABLE 457 Saudi Arabia Compression Therapy Market, by End User, 2017-2022 (US$ Mn)

TABLE 458 Saudi Arabia Compression Therapy Market, by End User, 2023-2030 (US$ Mn)

TABLE 459 Saudi Arabia Compression Therapy Market, by Gender, 2017-2022 (US$ Mn)

TABLE 460 Saudi Arabia Compression Therapy Market, by Gender, 2023-2030 (US$ Mn)

TABLE 461 Saudi Arabia Compression Therapy Market, by Age Group, 2017-2022 (US$ Mn)

TABLE 462 Saudi Arabia Compression Therapy Market, by Age Group, 2023-2030 (US$ Mn)

TABLE 463 Rest of Middle East Compression Therapy Market, by Product Type, 2017-2022 (US$ Mn)

TABLE 464 Rest of Middle East Compression Therapy Market, by Product Type, 2023-2030 (US$ Mn)

TABLE 465 Rest of Middle East Compression Therapy Market, by Compression Level, 2017-2022 (US$ Mn)

TABLE 466 Rest of Middle East Compression Therapy Market, by Compression Level, 2023-2030 (US$ Mn)

TABLE 467 Rest of Middle East Compression Therapy Market, by Application, 2017-2022 (US$ Mn)

TABLE 468 Rest of Middle East Compression Therapy Market, by Application, 2023-2030 (US$ Mn)

TABLE 469 Rest of Middle East Compression Therapy Market, by Compression Material, 2017-2022 (US$ Mn)

TABLE 470 Rest of Middle East Compression Therapy Market, by Compression Material, 2023-2030 (US$ Mn)

TABLE 471 Rest of Middle East Compression Therapy Market, by End User, 2017-2022 (US$ Mn)

TABLE 472 Rest of Middle East Compression Therapy Market, by End User, 2023-2030 (US$ Mn)

TABLE 473 Rest of Middle East Compression Therapy Market, by Gender, 2017-2022 (US$ Mn)

TABLE 474 Rest of Middle East Compression Therapy Market, by Gender, 2023-2030 (US$ Mn)

TABLE 475 Rest of Middle East Compression Therapy Market, by Age Group, 2017-2022 (US$ Mn)

TABLE 476 Rest of Middle East Compression Therapy Market, by Age Group, 2023-2030 (US$ Mn)

TABLE 477 Africa Compression Therapy Market, by Product Type, 2017-2022 (US$ Mn)

TABLE 478 Africa Compression Therapy Market, by Product Type, 2023-2030 (US$ Mn)

TABLE 479 Africa Compression Therapy Market, by Compression Level, 2017-2022 (US$ Mn)

TABLE 480 Africa Compression Therapy Market, by Compression Level, 2023-2030 (US$ Mn)

TABLE 481 Africa Compression Therapy Market, by Application, 2017-2022 (US$ Mn)

TABLE 482 Africa Compression Therapy Market, by Application, 2023-2030 (US$ Mn)

TABLE 483 Africa Compression Therapy Market, by Compression Material, 2017-2022 (US$ Mn)

TABLE 484 Africa Compression Therapy Market, by Compression Material, 2023-2030 (US$ Mn)

TABLE 485 Africa Compression Therapy Market, by End User, 2017-2022 (US$ Mn)

TABLE 486 Africa Compression Therapy Market, by End User, 2023-2030 (US$ Mn)

TABLE 487 Africa Compression Therapy Market, by Gender, 2017-2022 (US$ Mn)

TABLE 488 Africa Compression Therapy Market, by Gender, 2023-2030 (US$ Mn)

TABLE 489 Africa Compression Therapy Market, by Age Group, 2017-2022 (US$ Mn)

TABLE 490 Africa Compression Therapy Market, by Age Group, 2023-2030 (US$ Mn)

TABLE 491 South Africa Compression Therapy Market, by Product Type, 2017-2022 (US$ Mn)

TABLE 492 South Africa Compression Therapy Market, by Product Type, 2023-2030 (US$ Mn)

TABLE 493 South Africa Compression Therapy Market, by Compression Level, 2017-2022 (US$ Mn)

TABLE 494 South Africa Compression Therapy Market, by Compression Level, 2023-2030 (US$ Mn)

TABLE 495 South Africa Compression Therapy Market, by Application, 2017-2022 (US$ Mn)

TABLE 496 South Africa Compression Therapy Market, by Application, 2023-2030 (US$ Mn)

TABLE 497 South Africa Compression Therapy Market, by Compression Material, 2017-2022 (US$ Mn)

TABLE 498 South Africa Compression Therapy Market, by Compression Material, 2023-2030 (US$ Mn)

TABLE 499 South Africa Compression Therapy Market, by End User, 2017-2022 (US$ Mn)

TABLE 500 South Africa Compression Therapy Market, by End User, 2023-2030 (US$ Mn)

TABLE 501 South Africa Compression Therapy Market, by Gender, 2017-2022 (US$ Mn)

TABLE 502 South Africa Compression Therapy Market, by Gender, 2023-2030 (US$ Mn)

TABLE 503 South Africa Compression Therapy Market, by Age Group, 2017-2022 (US$ Mn)

TABLE 504 South Africa Compression Therapy Market, by Age Group, 2023-2030 (US$ Mn)

TABLE 505 Egypt Compression Therapy Market, by Product Type, 2017-2022 (US$ Mn)

TABLE 506 Egypt Compression Therapy Market, by Product Type, 2023-2030 (US$ Mn)

TABLE 507 Egypt Compression Therapy Market, by Compression Level, 2017-2022 (US$ Mn)

TABLE 508 Egypt Compression Therapy Market, by Compression Level, 2023-2030 (US$ Mn)

TABLE 509 Egypt Compression Therapy Market, by Application, 2017-2022 (US$ Mn)

TABLE 510 Egypt Compression Therapy Market, by Application, 2023-2030 (US$ Mn)

TABLE 511 Egypt Compression Therapy Market, by Compression Material, 2017-2022 (US$ Mn)

TABLE 512 Egypt Compression Therapy Market, by Compression Material, 2023-2030 (US$ Mn)

TABLE 513 Egypt Compression Therapy Market, by End User, 2017-2022 (US$ Mn)

TABLE 514 Egypt Compression Therapy Market, by End User, 2023-2030 (US$ Mn)

TABLE 515 Egypt Compression Therapy Market, by Gender, 2017-2022 (US$ Mn)

TABLE 516 Egypt Compression Therapy Market, by Gender, 2023-2030 (US$ Mn)

TABLE 517 Egypt Compression Therapy Market, by Age Group, 2017-2022 (US$ Mn)

TABLE 518 Egypt Compression Therapy Market, by Age Group, 2023-2030 (US$ Mn)

TABLE 519 Rest of Africa Compression Therapy Market, by Product Type, 2017-2022 (US$ Mn)

TABLE 520 Rest of Africa Compression Therapy Market, by Product Type, 2023-2030 (US$ Mn)

TABLE 521 Rest of Africa Compression Therapy Market, by Compression Level, 2017-2022 (US$ Mn)

TABLE 522 Rest of Africa Compression Therapy Market, by Compression Level, 2023-2030 (US$ Mn)

TABLE 523 Rest of Africa Compression Therapy Market, by Application, 2017-2022 (US$ Mn)

TABLE 524 Rest of Africa Compression Therapy Market, by Application, 2023-2030 (US$ Mn)

TABLE 525 Rest of Africa Compression Therapy Market, by Compression Material, 2017-2022 (US$ Mn)

TABLE 526 Rest of Africa Compression Therapy Market, by Compression Material, 2023-2030 (US$ Mn)

TABLE527 Rest of Africa Compression Therapy Market, by End User, 2017-2022 (US$ Mn)

TABLE 528 Rest of Africa Compression Therapy Market, by End User, 2023-2030 (US$ Mn)

TABLE 529 Rest of Africa Compression Therapy Market, by Gender, 2017-2022 (US$ Mn)

TABLE 530 Rest of Africa Compression Therapy Market, by Gender, 2023-2030 (US$ Mn)

TABLE 531 Rest of Africa Compression Therapy Market, by Age Group, 2017-2022 (US$ Mn)

TABLE 532 Rest of Africa Compression Therapy Market, by Age Group, 2023-2030 (US$ Mn)

Frequently asked questions

How big is the global market for compression therapy right now?

In 2022, the market for compression therapy was estimated to be worth USD 3514.8 million.

What is the compression therapy market’s anticipated growth rate from 2023 to 2030?

The market for compression therapy is anticipated to increase at a CAGR of 5.80% from 2023 to 2030, reaching USD 5518.05 million in 2030.

In terms of the product type, which market category is in the lead?

Compression bandages are the most popular category of product type.

Which segment is leading the market in terms of compression level?

Gradient compression, by the compression level, is the notable segment.

Which application segment is estimated to have the highest CAGR throughout the forecast period?

During the projection period, the venous disorders category is anticipated to exhibit the highest CAGR.

In which region is the market for compression therapy expanding?

The compression therapy market was ruled by North America.

Who are the key participants in the market for compression therapy globally?

The top players include Cardinal Health; Julius Zorn GmbH; Hartmann AG; Medi GmbH & Co.; SIGVARIS; BSN Medical GmbH; Arjo Huntleigh; 3M Health Care; Spectrum Healthcare; Bio Compression Systems, Inc.; Stryker; Gottfried Medical, and others.

What are the main market factors driving the compression therapy sector?

Compression therapy is now more widely accepted among patients and healthcare professionals as a result of increased knowledge of its benefits for accelerating wound healing, minimizing edema, and treating chronic venous disorders. Superior treatment outcomes, as a result, have helped to maintain compression therapy’s favorable reputation. These are the significant factors that boost the growth of the global market.

What main market challenges prevent the compression therapy sector from growing?

The challenges limiting the growth of the compression therapy market are the research and development costs and the global supply chain disruptions.

What are the main market opportunities for the compression therapy sector?

Compression therapy integration potential has been made possible by the COVID-19 pandemic, which has pushed the development of telemedicine and remote monitoring. Moreover, compression therapy patients from outside can be drawn to areas with a strong medical tourism industry, expanding the market’s reach internationally.

Middle East and Africa Veterinary Vaccines Market

Published:
Report ID: 37309

North America Cancer Therapy Market

Published:
Report ID: 37315

Liver Health Supplements Market

Published:
Report ID: 37298

Asia Pacific Stem Cell Therapy Market

Published:
Report ID: 37280

Walking Assist Devices Market

Published:
Report ID: 37276

Bladder Cancer Market

Published:
Report ID: 37219

US Dental Consumables Market

Published:
Report ID: 37217

Colorectal Cancer (CRC) Market

Published:
Report ID: 37236

Dural Graft Market

Published:
Report ID: 37234

Uterine Cancer Market

Published:
Report ID: 37235

US Active Pharmaceutical Ingredient (API) Market

Published:
Report ID: 37221

Cancer Supportive Care Market

Published:
Report ID: 1901

Purchase Options

$2999
Delivery Format: Excel.
$4999
Designed for the individual purchaser.
$6999
Users located at a single corporate site or regional office.
$7999
Allowed for unlimited sharing globally within one company.
Smallform of Sample request

Have a question?

User Profile

Don’t settle for less – trust Mitul to help you find the best solution.

Report delivery within 24 to 48 hours

– Other Info –

What people say?-

User Review

I am very impressed with the information in this report. The author clearly did their research when they came up with this product and it has already given me a lot of ideas.

Jana Schmidt
CEDAR CX Technologies

– Connect with us –

Phone

+91 6232 49 3207


support

24/7 Research Support


sales@credenceresearch.com

– Research Methodology –

Going beyond the basics: advanced techniques in research methodology

– Trusted By –

Pepshi, LG, Nestle
Motorola, Honeywell, Johnson and johnson
LG Chem, SIEMENS, Pfizer
Unilever, Samsonite, QIAGEN