
Market Overview
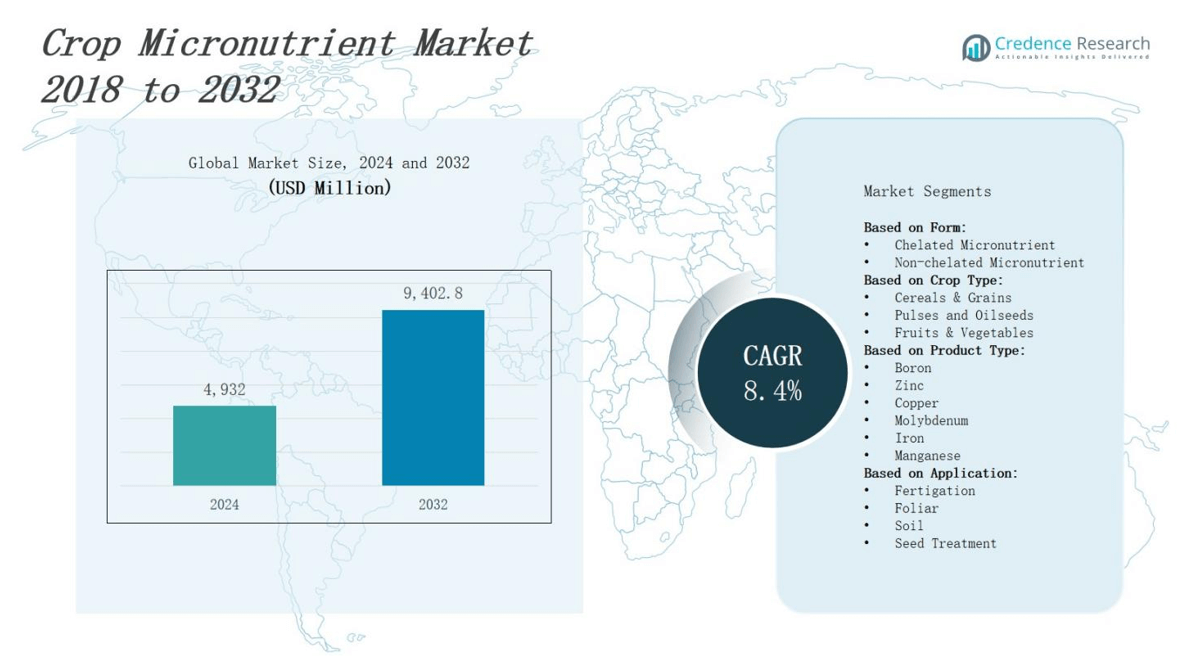
The crop micronutrient market is projected to grow from USD 4,932 million in 2024 to USD 9,402.8 million by 2032, registering a CAGR of 8.4% during the forecast period.
| REPORT ATTRIBUTE | DETAILS |
|---|---|
| Historical Period | 2020-2023 |
| Base Year | 2024 |
| Forecast Period | 2025-2032 |
| Crop Micronutrient Market Size 2024 | USD 4,932 million |
| Crop Micronutrient Market, CAGR | 8.4% |
| Crop Micronutrient Market Size 2032 | USD 9,402.8 million |
The crop micronutrient market is driven by the rising need to enhance crop yield and quality amid declining soil fertility and intensive farming practices. Increasing awareness of balanced crop nutrition, coupled with the growth of precision agriculture, supports market expansion. Governments promoting sustainable farming and micronutrient-enriched fertilizers further boost adoption. Trends include the development of chelated micronutrient formulations, integration with smart delivery systems, and growing demand from emerging economies with large agricultural bases. Additionally, climate change and nutrient-deficient soils are accelerating the use of micronutrients to improve plant resilience and productivity, driving innovation across the global agricultural input sector.
The crop micronutrient market spans Asia Pacific, North America, Europe, Latin America, and the Middle East & Africa. Asia Pacific leads due to extensive farming and government support, followed by North America and Europe with strong adoption of precision agriculture and regulated input use. Latin America shows rapid growth driven by large-scale cultivation, while the Middle East & Africa gains traction through productivity-focused initiatives. Key players include BASF, Bayer, Dow, FMC, Akzo Nobel, Dupont, Mosaic, Growmark, Kronos Micronutrients, J.R. Simplot Food, and LP.
Market Insights
- The crop micronutrient market is projected to grow from USD 4,932 million in 2024 to USD 9,402.8 million by 2032, at a CAGR of 8.4%.
- Declining soil fertility and continuous monoculture practices are driving the need for micronutrient-rich fertilizers to sustain crop yields.
- Precision agriculture and smart farming tools are improving micronutrient application efficiency, supporting tailored and cost-effective solutions.
- Government-backed programs promoting sustainable and balanced fertilization are accelerating micronutrient adoption across key farming regions.
- Lack of awareness, limited soil testing, and inconsistent usage continue to restrict market expansion, particularly in developing countries.
- Asia Pacific leads with 38% market share, followed by North America (22%), Europe (19%), Latin America (13%), and the Middle East & Africa (8%).
- Key players such as BASF, Bayer, Dow, FMC, Mosaic, and Growmark are investing in R&D, digital platforms, and regional expansion to strengthen competitiveness.
Market Drivers
Increasing Soil Nutrient Deficiency and Depletion
The crop micronutrient market is growing due to widespread nutrient depletion in soils caused by intensive farming and monoculture practices. Continuous cropping without proper replenishment has reduced the availability of essential micronutrients such as zinc, iron, and boron. It leads to lower crop productivity and poor plant health. Farmers now recognize the importance of restoring soil balance to sustain yields. Governments and agricultural institutions support micronutrient application through awareness and subsidies. The crop micronutrient market responds actively to this urgency.
- For instance, zinc deficiency in Indian soils causes yield losses ranging from 5% to 30% in staple crops such as rice, wheat, and maize, significantly impacting food security.
Rising Demand for High-Yield and Quality Crops
Growing global population and changing food preferences are placing pressure on farmers to produce higher yields and superior quality crops. Micronutrients play a vital role in enhancing plant metabolism, improving nutrient uptake, and promoting stronger crop development. The crop micronutrient market benefits from this demand by offering targeted solutions to boost plant health and food quality. It supports production efficiency while ensuring nutritional content meets market standards. Export-oriented economies are especially driving this shift.
Expansion of Precision Agriculture and Smart Farming
Technological advances in precision farming are reshaping the way nutrients are applied across agricultural fields. It allows farmers to apply specific micronutrients at the right time and location, minimizing waste and maximizing results. The crop micronutrient market aligns with these technologies through customized formulations and compatible delivery systems. This shift not only reduces costs but also improves soil and crop management. Rising adoption of drones, sensors, and GIS supports its integration with nutrient solutions.
- For instance, Farmonaut’s Jeevn AI Advisory System integrates satellite imagery, AI, and localized field data to provide personalized, real-time advisories, helping farmers optimize micronutrient application and improve crop sustainability.
Supportive Government Policies and Sustainability Goals
Several countries are promoting sustainable agriculture practices, which emphasize balanced crop nutrition and soil health. The crop micronutrient market gains traction through government-backed initiatives, including training programs and financial support. It aligns with long-term environmental objectives, including reducing synthetic fertilizer use and promoting organic alternatives. Sustainable certification schemes now include micronutrient use, encouraging broader market acceptance. Public-private collaborations continue to boost innovation and ensure farmer access to effective micronutrient solutions.
Market Trends
Growing Adoption of Chelated Micronutrients for Improved Efficiency
Chelated micronutrients are gaining popularity due to their higher bioavailability and stability in various soil types. These compounds protect essential elements like zinc, iron, and manganese from premature precipitation, making them more accessible to plants. The crop micronutrient market is experiencing a shift toward these advanced formulations, especially in regions with alkaline or saline soils. It allows for better nutrient absorption, reduced application frequency, and enhanced crop performance. Manufacturers focus on producing cost-effective and crop-specific chelated blends to meet diverse farming needs.
- For instance, Nutrien’s Micronutrient Chelate Line delivers zinc and manganese in EDTA-chelated forms, improving uptake efficiency in alkaline soil corn crops.
Integration of Micronutrients with Precision Agriculture Tools
The combination of crop nutrition with precision agriculture tools is transforming fertilizer practices worldwide. Farmers now rely on GPS mapping, remote sensing, and variable rate technology to apply micronutrients with greater accuracy. The crop micronutrient market supports this integration through innovations that match application precision with nutrient response curves. It improves resource efficiency while minimizing runoff and environmental impact. Data-driven farming encourages tailored nutrient application, especially in large-scale farming operations where uniformity is critical.
- For instance, EOSDA Crop Monitoring uses variable rate technology (VRT) combined with satellite imagery and GPS to adjust micronutrient application in real-time based on soil nutrient levels, reducing fertilizer use and environmental runoff.
Increased Demand from Organic and Sustainable Farming Segments
The rising shift toward organic and sustainable farming is creating new demand for naturally derived micronutrient products. Organic producers require certified input materials that maintain soil health without synthetic chemicals. The crop micronutrient market addresses this trend by developing organic-compliant formulations based on natural minerals, seaweed extracts, or microbial inoculants. It ensures compliance with organic farming regulations while improving crop resilience. Consumers prefer produce grown with sustainable methods, influencing farmer choices across developed and emerging markets.
Focus on Crop-Specific Micronutrient Blends and Customized Solutions
Tailored micronutrient solutions designed for specific crops and regional soil conditions are becoming more common. Different crops require distinct nutrient profiles, and generic fertilizers often fail to meet those demands. The crop micronutrient market is evolving toward customized blends that maximize productivity and address localized deficiencies. It helps farmers optimize inputs and reduce unnecessary applications. Companies invest in research and extension services to support adoption and guide farmers on effective use of crop-specific formulations.
Market Challenges Analysis
Lack of Awareness and Inconsistent Application Practices
Limited awareness among farmers regarding the importance of micronutrients continues to hinder the crop micronutrient market. Many small and mid-scale farmers still rely heavily on macronutrients like nitrogen, phosphorus, and potassium, overlooking the need for balanced micronutrient supplementation. It leads to suboptimal yields and persistent nutrient deficiencies in soils. Inconsistent application practices and the absence of soil testing infrastructure further weaken micronutrient effectiveness. Educational outreach and government extension services remain insufficient in several developing regions. Adoption rates vary significantly by geography, limiting market penetration in key agricultural economies.
High Product Costs and Limited Distribution Infrastructure
The high cost of chelated and advanced micronutrient formulations poses a challenge for widespread adoption, especially in price-sensitive markets. It discourages smallholders from using these products regularly, despite their proven benefits. The crop micronutrient market also faces constraints due to inadequate distribution networks in remote and rural areas. Logistical barriers delay product availability and reduce shelf life for certain formulations. Manufacturers struggle to maintain consistent supply while managing transportation and storage costs. These limitations affect both product accessibility and long-term market expansion.
Market Opportunities
Expansion in Emerging Agricultural Economies
Rapid agricultural development in countries such as India, Brazil, and parts of Southeast Asia presents strong growth potential for the crop micronutrient market. Governments in these regions are investing in modern farming techniques and soil health improvement programs. It creates a favorable environment for micronutrient adoption. Rising awareness of nutrient deficiencies and support for balanced fertilization drive product demand. Expanding middle-class populations with growing food quality concerns also influence farm input choices. Local players and global manufacturers can tap into this demand with region-specific solutions and training support.
Innovation in Sustainable and Organic Micronutrient Formulations
The shift toward sustainable farming opens new avenues for natural and organic micronutrient products. Consumers are increasingly demanding residue-free and environmentally friendly produce, influencing input usage at the farm level. The crop micronutrient market can benefit by offering certified, eco-friendly formulations that meet organic farming standards. It encourages adoption across horticulture, specialty crops, and export-oriented farms. Advances in bio-based delivery systems and microbial chelation methods support this trend. Companies investing in research and partnerships with organic certifiers can position themselves for long-term growth.
Market Segmentation Analysis:
By Form
The crop micronutrient market includes chelated and non-chelated formulations, with chelated micronutrients dominating due to their higher bioavailability and stability. Chelated products prevent nutrient precipitation in the soil, enhancing uptake by plants. It is particularly effective in alkaline soils where conventional micronutrients fail to perform. Farmers in high-value crop segments prefer chelated formulations for better crop health and yield. Non-chelated micronutrients remain widely used due to lower cost and easy availability, especially in traditional farming regions.
- For instance, UPL's chelated zinc product, Zinc EDTA 13%, is specifically designed to improve zinc availability in alkaline soils, enhancing maize yields by up to 20%.
By Crop Type
Cereals and grains represent the largest segment in the crop micronutrient market due to their global cultivation area and importance in food security. It drives consistent demand for zinc, iron, and boron to support plant growth and productivity. Fruits and vegetables follow closely, with higher demand for premium produce quality and visual appeal. Pulses and oilseeds also contribute steadily, especially in regions promoting protein-rich diets and crop diversification. Each crop type requires a specific micronutrient profile, shaping product development.
- For instance, zinc-enriched fertilizers are prioritized in rice cultivation to combat widespread zinc deficiency in lowland soils, thereby improving crop yield and quality.
By Product Type
Zinc holds the largest share among product types due to its essential role in enzyme activity and plant development. The crop micronutrient market also sees strong demand for iron and boron, particularly in fruits and vegetables. Manganese and copper support chlorophyll formation and disease resistance, making them valuable for intensive farming. Molybdenum, though used in smaller quantities, remains critical for nitrogen fixation in legume crops. It enables balanced crop nutrition across various agro-climatic conditions.
Segments:
Based on Form:
- Chelated Micronutrient
- Non-chelated Micronutrient
Based on Crop Type:
- Cereals & Grains
- Pulses and Oilseeds
- Fruits & Vegetables
Based on Product Type:
- Boron
- Zinc
- Copper
- Molybdenum
- Iron
- Manganese
Based on Application:
- Fertigation
- Foliar
- Soil
- Seed Treatment
Based on the Geography:
- North America
- U.S.
- Canada
- Mexico
- Europe
- Germany
- France
- U.K.
- Italy
- Spain
- Rest of Europe
- Asia Pacific
- China
- Japan
- India
- South Korea
- South-east Asia
- Rest of Asia Pacific
- Latin America
- Brazil
- Argentina
- Rest of Latin America
- Middle East & Africa
- GCC Countries
- South Africa
- Rest of the Middle East and Africa
Regional Analysis
Asia Pacific
Asia Pacific holds the largest share in the crop micronutrient market with 38% of the global revenue. Strong agricultural activity in countries like India, China, and Indonesia supports high demand. It benefits from government programs promoting balanced fertilization and sustainable practices. Soil deficiencies across vast cultivated areas increase the need for targeted micronutrient solutions. The presence of a large farming population and rising adoption of modern techniques further strengthens market growth. Regional manufacturers and international players are expanding distribution networks to improve product accessibility.
North America
North America accounts for 22% of the crop micronutrient market, driven by high awareness of plant nutrition and widespread use of precision agriculture. The United States dominates the regional market, supported by strong infrastructure, advanced farming equipment, and research initiatives. It focuses on chelated micronutrient use in high-value crops such as corn, soybeans, and fruits. Regulatory support for sustainable agriculture and increasing demand for organic produce continue to push the adoption of micronutrient-based inputs. Technological innovation and strong retail networks enhance product penetration.
Europe
Europe holds a 19% share in the crop micronutrient market, with emphasis on environmentally friendly and regulated farming inputs. Countries like France, Germany, and Italy lead demand due to well-established agricultural sectors and strict nutrient management policies. It adopts chelated formulations to comply with soil and water protection regulations. Farmers in the region prefer customized nutrient solutions aligned with crop-specific needs and traceability standards. Growing interest in organic farming and EU Green Deal objectives supports long-term market growth. Export-oriented horticulture segments contribute significantly to product demand.
Latin America and Middle East & Africa
Latin America captures 13% while the Middle East & Africa holds 8% of the crop micronutrient market. Brazil and Argentina are key contributors in Latin America due to large-scale soybean and maize cultivation. In the Middle East & Africa, micronutrient use is increasing with rising agricultural investments and efforts to improve soil productivity. It benefits from international support programs and regional initiatives targeting food security.
Key Player Analysis
- Kronos Micronutrient
- Bayer
- Dow
- R. Simplot Food
- Growmark
- Mosaic
- BASF
- Dupont
- LP
- FMC
- Akzo Nobel
Competitive Analysis
The crop micronutrient market features a mix of global agrochemical giants and regional specialists competing through product innovation, distribution reach, and crop-specific formulations. Companies such as BASF, Bayer, Dow, and FMC lead the market with strong R&D capabilities, established brands, and broad geographic presence. It witnesses intense competition focused on chelated micronutrient development, precision agriculture compatibility, and sustainability. Players like Mosaic, Kronos Micronutrients, and Growmark target specific crop types and soil conditions, offering tailored solutions. Akzo Nobel, Dupont, and J.R. Simplot Food enhance competitiveness through partnerships and advanced delivery systems. LP and other niche companies focus on cost-effective offerings in emerging markets. Strategic initiatives include expanding manufacturing capacity, acquiring regional distributors, and developing eco-certified products to meet evolving regulatory and consumer demands. The crop micronutrient market remains dynamic, with companies investing in field trials, digital platforms, and farmer education to strengthen their competitive edge and gain share across high-growth regions.
Recent Developments
- In July 2025, Kemin Industries introduced Valena™ FLOW, a foliar fertilizer combining zinc and patented 1,3-beta-glucan to improve root development, nutrient absorption, and plant resilience.
- In May 2025, Syngenta completed the acquisition of Intrinsyx Bio, strengthening its biologicals portfolio with endophyte-based technology that improves nutrient use efficiency and plant performance.
- In early 2025, Crystal Crop Protection Limited launched products like Proclaim XTRA Insecticide (though this is insecticide-focused rather than micronutrients specifically.
- In January 2025, AgroLiquid finalized the acquisition of Monty’s Plant Food Company, integrating Monty’s soil health technologies with its own liquid fertilizer offerings.
Market Concentration & Characteristics
The crop micronutrient market shows moderate concentration, with a mix of global agrochemical leaders and regional suppliers competing across diverse agricultural landscapes. Major players such as BASF, Bayer, Dow, and FMC command significant market share through strong product portfolios, established distribution networks, and advanced R&D capabilities. It is characterized by product differentiation, with emphasis on chelated formulations, crop-specific blends, and compatibility with precision agriculture tools. Regional companies focus on affordability and localization to address varied soil conditions and farmer preferences. The market remains highly fragmented in developing regions due to the presence of local input manufacturers and inconsistent product standards. Regulatory frameworks, soil health initiatives, and sustainability goals shape market behavior and influence investment patterns. It requires consistent innovation, extension services, and pricing strategies to compete effectively. Companies prioritize strategic partnerships, field trials, and digital advisory platforms to strengthen market presence and improve product adoption among smallholders and commercial growers.
Report Coverage
The research report offers an in-depth analysis based on Form, Crop Type, Product Type, Appliction and Geography. It details leading market players, providing an overview of their business, product offerings, investments, revenue streams, and key applications. Additionally, the report includes insights into the competitive environment, SWOT analysis, current market trends, as well as the primary drivers and constraints. Furthermore, it discusses various factors that have driven market expansion in recent years. The report also explores market dynamics, regulatory scenarios, and technological advancements that are shaping the industry. It assesses the impact of external factors and global economic changes on market growth. Lastly, it provides strategic recommendations for new entrants and established companies to navigate the complexities of the market.
Future Outlook
- Demand for crop micronutrients will increase due to ongoing soil degradation and nutrient imbalance.
- Precision farming will drive growth by enabling targeted and efficient micronutrient application.
- Chelated formulations will gain popularity for their superior nutrient delivery and soil compatibility.
- Government support for sustainable agriculture will expand micronutrient use among small and mid-sized farmers.
- Rising consumer demand for high-quality, nutrient-rich food will influence micronutrient adoption.
- Organic farming trends will create opportunities for bio-based and certified micronutrient products.
- Regional manufacturers will expand presence through localized product development and distribution networks.
- Integration of digital platforms and advisory services will enhance farmer awareness and usage.
- Export-driven crop segments will adopt micronutrient strategies to meet international quality standards.
- Strategic partnerships and R&D investments will shape innovation in product formulation and delivery methods.

Request a Free Sample
Fill in your details and we'll send you a free sample report.
- Sample data tables & charts
- Research methodology
Market Dynamics
Increasing Soil Nutrient Deficiency and Depletion
Intensive farming and monoculture practices have led to widespread micronutrient depletion in soils, reducing crop productivity and necessitating the use of micronutrient-rich fertilizers to restore soil health and sustain yields.
Expansion of Precision Agriculture and Smart Farming
Technological advances such as drones, sensors, and GIS enable precise application of micronutrients, improving efficiency, reducing waste, and supporting the adoption of tailored nutrient solutions for different crops and soil conditions.
Supportive Government Policies and Sustainability Goals
Government-backed initiatives, subsidies, and training programs promoting sustainable agriculture and balanced fertilization are accelerating the adoption of micronutrient products, especially in regions with large agricultural sectors.
Rising Demand for High-Yield and Quality Crops
Growing global population and changing food preferences are driving farmers to seek higher yields and better quality crops, with micronutrients playing a crucial role in enhancing plant metabolism, nutrient uptake, and crop resilience.
Innovation in Chelated and Organic Micronutrient Formulations
The development of advanced chelated and organic-compliant micronutrient products is meeting the needs of both conventional and organic farmers, improving nutrient bioavailability and supporting sustainable farming practices.
Need a Custom Version of This Report?
Tailor the scope, geography, or segments to your exact requirements.
- Custom geography or segment scope
- Direct access to our analyst team
Frequently Asked Questions
What is the current size of the crop micronutrient market?
What are the key segments within the crop micronutrient market?
What are some challenges faced by the crop micronutrient market?
Who are the major players in the crop micronutrient market?
Table of Content
Chapter 1 Market Segmentation
- 1.1 Segmentation Framework
- 1.1.1 Product and Service Classification
- 1.1.2 Application and End-Use Classification
- 1.1.3 Technology and Solution Classification
- 1.1.4 Customer and Distribution Channel Classification
- 1.1.5 Geographic Segmentation
- 1.1.6 Market Segment Definitions and Boundaries
- 1.2 By Form
- 1.2.1 Chelated Micronutrient
- 1.2.2 Non-chelated Micronutrient
- 1.3 By Crop Type
- 1.3.1 Cereals & Grains
- 1.3.2 Pulses and Oilseeds
- 1.3.3 Fruits & Vegetables
- 1.4 By Application
- 1.4.1 Fertigation
- 1.4.2 Foliar
- 1.4.3 Soil
- 1.4.4 Seed Treatment
- 1.5 By Product Type
- 1.5.1 Boron
- 1.5.2 Zinc
- 1.5.3 Copper
- 1.5.4 Molybdenum
- 1.5.5 Iron
- 1.5.6 Manganese
Chapter 2 Introduction
- 2.1 Report Objectives and Scope
- 2.2 Product Definition and Industry Terminology
- 2.3 Market Inclusions and Exclusions
- 2.4 Research Process
- 2.4.1 Primary Research and Expert Interviews
- 2.4.2 Secondary Research and Source Review
- 2.4.3 Top-Down and Bottom-Up Estimation
- 2.4.4 Data Triangulation and Verification
- 2.5 Market Size Measurement Basis
- 2.5.1 2024: USD 4,932 million → 2032: USD 9,402.8 million
- 2.6 Historical and Forecast Reference Periods
- 2.6.1 Base Year: 2024
- 2.6.2 Forecast Period: 2024-2032
- 2.7 Research Assumptions and Limitations
Chapter 3 Executive Summary
- 3.1 Market Snapshot and Key Findings
- 3.2 Base-Year Market Size, 2024
- 3.3 Forecast Market Size, 2032
- 3.4 Revenue and Volume Growth Outlook
- 3.5 Key Demand and Supply Indicators
- 3.6 Leading Market Segments
- 3.7 Fastest-Growing Market Opportunities
- 3.8 Regional Performance Highlights
- 3.9 Technology and Industry Transformation
- 3.10 Competitive Landscape Summary
- 3.11 Analyst View and Strategic Implications
Chapter 4 Global Crop Micronutrient Market Trends and Developments
- 4.1 Historical Industry Development
- 4.2 Recent Market Trends and Developments
- 4.3 Demand and Customer Behavior Trends
- 4.4 Technology and Product Innovation
- 4.5 Artificial Intelligence, Automation and Digitalization
- 4.6 Local Manufacturing and Supply Chain Realignment
- 4.7 Industry Partnerships, Mergers and Acquisitions
- 4.8 Sustainability and Circular Economy Developments
- 4.9 Government and Private Sector Investment Trends
- 4.10 Emerging Business Models and Commercialization
- 4.11 Industry Developments and Announcements
Chapter 5 Global Crop Micronutrient Market Production, Supply and Demand Analysis
- 5.1 Demand Trend and Consumption Analysis
- 5.2 Demand Forecast, 2024-2032
- 5.3 Production and Output Trend
- 5.4 Production and Output Forecast, 2024-2032
- 5.5 Installed Capacity and Capacity Utilization
- 5.6 Company-Wise Production Plants and Statistics
- 5.6.1 Installed Production Capacity
- 5.6.2 Actual Production
- 5.6.3 Planned Capacity and Expansion Targets
- 5.7 Supply Chain Structure and Procurement Trends
- 5.8 Supply-Demand Gap and Bottlenecks
- 5.9 Import Dependence and Sourcing Structure
- 5.10 Contract Manufacturing and Outsourcing
- 5.11 Regional Supply and Demand Concentration
Chapter 6 Global Crop Micronutrient Market Pricing Analysis
- 6.1 Pricing Structure and Measurement
- 6.2 Historical Pricing Trends
- 6.3 Pricing Outlook, 2024-2032
- 6.4 Average Selling Price and Unit Economics
- 6.5 Pricing by Product and Market Segment
- 6.6 Geographic Pricing Differences
- 6.7 Key Input, Energy, Labor and Logistics Costs
- 6.8 Contract Pricing and Purchasing Models
- 6.9 Pricing Sensitivity and Competitive Positioning
- 6.10 Price, Margin and Profitability Implications
Chapter 7 Global Crop Micronutrient Market Dynamics
- 7.1 Market Growth Drivers
- 7.1.1 Demand-Side Drivers
- 7.1.2 Technology and Innovation Drivers
- 7.1.3 Infrastructure and Investment Drivers
- 7.1.4 Regulatory and Policy Drivers
- 7.2 Market Restraints
- 7.2.1 Cost and Affordability Constraints
- 7.2.2 Technology and Adoption Barriers
- 7.2.3 Supply Chain and Operational Constraints
- 7.3 Market Challenges
- 7.3.1 Competitive Pressure and Margin Erosion
- 7.3.2 Skills, Infrastructure and Implementation Gaps
- 7.4 Emerging Market Opportunities
- 7.5 Market Dynamics Impact and Time-Horizon Assessment
Chapter 8 Global Crop Micronutrient Value Chain Analysis
- 8.1 Industry Value Chain Overview
- 8.2 Upstream Suppliers and Critical Inputs
- 8.3 Technology and Component Providers
- 8.4 Manufacturing or Service Delivery
- 8.5 Distribution, Channel Partners and Integrators
- 8.6 Downstream Applications and End Users
- 8.7 Value Addition and Profit Pools
- 8.8 Vertical Integration and Outsourcing
- 8.9 Supplier Concentration and Risk
- 8.10 Supply Chain Localization and Resilience
Chapter 9 Global Crop Micronutrient Market Regulations and Policies
- 9.1 Relevant Laws, Standards and Compliance Frameworks
- 9.2 Product, Service, Safety and Quality Requirements
- 9.3 Government Policies, Incentives and Subsidies
- 9.4 Imports, Exports and Trade Barriers
- 9.5 Public Procurement and Local Content Requirements
- 9.6 Environmental and Sustainability Compliance
- 9.7 Data Protection, AI and Cybersecurity Compliance
- 9.8 Upcoming Policy Changes and Market Implications
Chapter 10 Global Crop Micronutrient Market Hotspots and Opportunities
- 10.1 Market Opportunity Mapping and Growth Hotspots
- 10.2 High-Growth Applications and Customer Groups
- 10.3 Underserved Markets and White-Space Opportunities
- 10.4 Emerging Technology and Product Opportunities
- 10.5 New Capacity and Investment Hotspots
- 10.6 Market Entry and Expansion Opportunities
- 10.7 Distribution and Partnership Opportunities
- 10.8 Near-Term and Long-Term Commercial Potential
- 10.9 Opportunity Attractiveness and Execution Risks
Chapter 11 Global Crop Micronutrient Market Outlook, 2024-2032
- 11.1 Market Size and Analysis
- 11.1.1 Revenue (Market Measurement: 2024: USD 4,932 million → 2032: USD 9,402.8 million)
- 11.1.2 Market Volume and Quantity Sold
- 11.1.3 Historical Market Size
- 11.1.4 Base-Year Market Size, 2024
- 11.2 Market Forecast, 2024-2032
- 11.2.1 Revenue Forecast to 2032
- 11.2.2 Volume Forecast to 2032
- 11.2.3 CAGR and Year-on-Year Growth
- 11.2.4 Incremental Revenue Opportunity
- 11.3 Forecast Assumptions and Scenario Analysis
- 11.3.1 Base-Case Forecast
- 11.3.2 Optimistic and Conservative Scenarios
- 11.3.3 Technology, Pricing and Policy Sensitivities
- 11.4 Market Attractiveness and Growth Outlook
Chapter 12 Global Crop Micronutrient Market Segmentation and Outlook
- 12.1 Segmentation Summary and Market Shares, 2024
- 12.2 Largest and Fastest-Growing Segments
- 12.3 By Form - Market Size and Forecast, 2024-2032
- 12.3.1 Segment Definition and Scope
- 12.3.2 Historical Market Size
- 12.3.3 Revenue Forecast, 2024-2032
- 12.3.4 Volume Forecast, 2024-2032
- 12.3.5 Base-Year Market Share, 2024
- 12.3.6 Segment CAGR and Growth Drivers
- 12.3.7 Subsegment Market Size and Forecast
- 12.3.7.1 Chelated Micronutrient
- 12.3.7.2 Non-chelated Micronutrient
- 12.3.8 Subsegment Pricing and Adoption Trends
- 12.3.9 Leading Suppliers and Competition
- 12.3.10 Regional Demand and Opportunities
- 12.4 By Crop Type - Market Size and Forecast, 2024-2032
- 12.4.1 Segment Definition and Scope
- 12.4.2 Historical Market Size
- 12.4.3 Revenue Forecast, 2024-2032
- 12.4.4 Volume Forecast, 2024-2032
- 12.4.5 Base-Year Market Share, 2024
- 12.4.6 Segment CAGR and Growth Drivers
- 12.4.7 Subsegment Market Size and Forecast
- 12.4.7.1 Cereals & Grains
- 12.4.7.2 Pulses and Oilseeds
- 12.4.7.3 Fruits & Vegetables
- 12.4.8 Subsegment Pricing and Adoption Trends
- 12.4.9 Leading Suppliers and Competition
- 12.4.10 Regional Demand and Opportunities
- 12.5 By Application - Market Size and Forecast, 2024-2032
- 12.5.1 Segment Definition and Scope
- 12.5.2 Historical Market Size
- 12.5.3 Revenue Forecast, 2024-2032
- 12.5.4 Volume Forecast, 2024-2032
- 12.5.5 Base-Year Market Share, 2024
- 12.5.6 Segment CAGR and Growth Drivers
- 12.5.7 Subsegment Market Size and Forecast
- 12.5.7.1 Fertigation
- 12.5.7.2 Foliar
- 12.5.7.3 Soil
- 12.5.7.4 Seed Treatment
- 12.5.8 Subsegment Pricing and Adoption Trends
- 12.5.9 Leading Suppliers and Competition
- 12.5.10 Regional Demand and Opportunities
- 12.6 By Product Type - Market Size and Forecast, 2024-2032
- 12.6.1 Segment Definition and Scope
- 12.6.2 Historical Market Size
- 12.6.3 Revenue Forecast, 2024-2032
- 12.6.4 Volume Forecast, 2024-2032
- 12.6.5 Base-Year Market Share, 2024
- 12.6.6 Segment CAGR and Growth Drivers
- 12.6.7 Subsegment Market Size and Forecast
- 12.6.7.1 Boron
- 12.6.7.2 Zinc
- 12.6.7.3 Copper
- 12.6.7.4 Molybdenum
- 12.6.7.5 Iron
- 12.6.7.6 Manganese
- 12.6.8 Subsegment Pricing and Adoption Trends
- 12.6.9 Leading Suppliers and Competition
- 12.6.10 Regional Demand and Opportunities
- 12.7 Segment Growth Comparison
- 12.8 Segment Attractiveness and Priority Matrix
Chapter 13 Global Crop Micronutrient End-Use and Application Market Outlook
- 13.1 End-Use Industry and Customer Demand Structure
- 13.2 Leading Applications and Customer Groups
- 13.3 End-Use Market Size, Share and Forecast
- 13.4 Major End-Use Industry Deep Dives
- 13.4.1 Customer Requirements and Use Cases
- 13.4.2 Demand and Replacement Cycles
- 13.4.3 Technical and Regulatory Considerations
- 13.4.4 Purchasing and Procurement Models
- 13.4.5 Leading Vendors and Distribution Channels
- 13.4.6 Forecast and Commercial Opportunities
- 13.5 Emerging Applications and Cross-Segment Demand
- 13.6 End-Use Industry Investment Priorities
Chapter 14 Global Crop Micronutrient Geographic Market Outlook, 2024-2032
- 14.1 Regional Market Size and Share, 2024
- 14.2 Regional Market Forecast, 2024-2032
- 14.3 Regional Pricing, Production and Demand Differences
- 14.4 North America
- 14.4.1 United States
- 14.4.2 Canada
- 14.4.3 Mexico
- 14.5 Europe
- 14.5.1 Germany
- 14.5.2 France
- 14.5.3 Italy
- 14.5.4 United Kingdom
- 14.5.5 Spain
- 14.5.6 Poland
- 14.5.7 Russia
- 14.5.8 Netherlands
- 14.5.9 Belgium
- 14.5.10 Sweden
- 14.5.11 Denmark
- 14.5.12 Norway
- 14.5.13 Rest of Europe
- 14.6 Asia Pacific
- 14.6.1 China
- 14.6.2 India
- 14.6.3 Japan
- 14.6.4 South Korea
- 14.6.5 Thailand
- 14.6.6 Indonesia
- 14.6.7 Vietnam
- 14.6.8 Malaysia
- 14.6.9 Australia
- 14.6.10 Rest of Asia Pacific
- 14.7 Latin America
- 14.7.1 Brazil
- 14.7.2 Argentina
- 14.7.3 Colombia
- 14.7.4 Chile
- 14.7.5 Rest of Latin America
- 14.8 Middle East
- 14.8.1 Saudi Arabia
- 14.8.2 United Arab Emirates
- 14.8.3 Turkey
- 14.8.4 Israel
- 14.8.5 Iran
- 14.8.6 Rest of the Middle East
- 14.9 Africa
- 14.9.1 South Africa
- 14.9.2 Egypt
- 14.9.3 Nigeria
- 14.9.4 Morocco
- 14.9.5 Rest of Africa
- 14.10 Regional Investment, Policy and Supply Chain Differences
- 14.11 Regional Competitive Landscape
- 14.12 Geographic Growth Hotspots
Chapter 15 Global Crop Micronutrient Technology, Innovation and Sustainability Outlook
- 15.1 Technology Landscape and Maturity
- 15.2 Product, Process and Service Innovation
- 15.3 AI, Automation and Digital Tools in the Industry
- 15.4 Technology Adoption and Performance Benchmarking
- 15.5 Innovation Pipeline and R&D Investment
- 15.6 Patent and Intellectual Property Trends
- 15.7 Energy Efficiency and Resource Management
- 15.8 Sustainability, Recycling and Circularity
- 15.9 Technology Roadmap, 2024-2032
- 15.10 Risks of Obsolescence and Technology Substitution
Chapter 16 Global Crop Micronutrient Market Key Strategic Imperatives
- 16.1 Growth and Market Entry Priorities
- 16.2 High-Return Products and Segments
- 16.3 Pricing, Profitability and Cost Optimization
- 16.4 Technology Investment and Product Differentiation
- 16.5 Supply Chain Localization and Resilience
- 16.6 Distribution and Customer Acquisition
- 16.7 Partnership, Acquisition and Capacity Strategy
- 16.8 Regional Expansion Priorities
- 16.9 Short-, Medium- and Long-Term Actions
Chapter 17 Competition Outlook
- 17.1 Industry Competition Characteristics
- 17.2 Market Structure and Concentration
- 17.3 Market Share and Competitive Positioning, 2024
- 17.4 Company-Wise Revenue and Product Benchmarking
- 17.5 Production and Service Capacity Benchmarking
- 17.6 Technology, Pricing and Differentiation
- 17.7 Regional Footprint and Distribution Strength
- 17.8 Mergers, Acquisitions and Strategic Alliances
- 17.9 New Entrants and Competitive Threats
- 17.10 Porter's Five Forces and Industry Attractiveness
- 17.11 Competitive Outlook, 2024-2032
Chapter 18 Company Profiles
- 18.1 Company Coverage and Selection Criteria
- 18.2 BASF
- 18.2.1 Business Description
- 18.2.2 Company Ownership and Geographic Presence
- 18.2.3 Product and Service Portfolio
- 18.2.4 Manufacturing and Operating Footprint
- 18.2.5 Production Capacity and Expansion Plans
- 18.2.6 Financial Performance and Investment
- 18.2.7 Market Share and Competitive Position
- 18.2.8 Technology and Innovation Capabilities
- 18.2.9 Strategic Alliances or Partnerships
- 18.2.10 Recent Developments
- 18.2.11 Growth Strategy and Outlook
- 18.3 Bayer
- 18.4 Dow
- 18.5 FMC
- 18.6 Akzo Nobel
- 18.7 Dupont
- 18.8 Mosaic
- 18.9 Growmark
- 18.10 Kronos Micronutrient
- 18.11 J.R. Simplot Food
- 18.12 Other Relevant Market Participants
Note: Every listed company is profiled on the structure shown under the first company. The company list is preliminary and may change based on research findings, market developments, data availability and client requirements.
Chapter 19 Disclaimer
- 19.1 Research and Forecast Disclaimer
- 19.2 Data Source and Estimation Limitations
Note: The depth of individual sections depends on data availability for this market. Volume, capacity, trade and other unit-based metrics are included where applicable.

