Market Overview
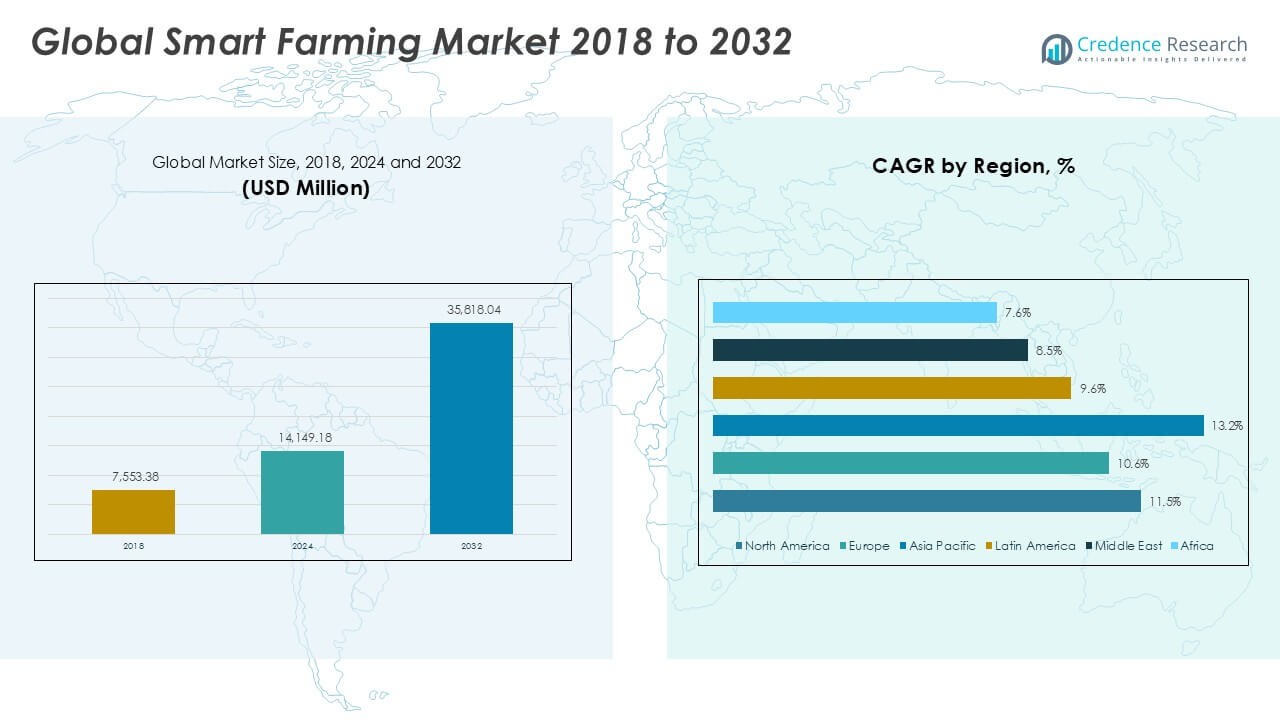
Global Smart Farming market size was valued at USD 7,553.38 million in 2018 to USD 14,149.18 million in 2024 and is anticipated to reach USD 35,818.04 million by 2032, at a CAGR of 11.47% during the forecast period.
| REPORT ATTRIBUTE |
DETAILS |
| Historical Period |
2020-2023 |
| Base Year |
2024 |
| Forecast Period |
2025-2032 |
| Smart Farming Market Size 2024 |
USD 14,149.18 Million |
| Smart Farming Market, CAGR |
11.47% |
| Smart Farming Market Size 2032 |
USD 35,818.04 Million |
The global smart farming market is led by major players such as Deere & Company, Trimble Inc., AGCO Corporation, Topcon Positioning Systems, and Climate LLC (Bayer), alongside innovators like Raven Industries, AG Leader Technology, GEA Group AG, Conservis Corporation, and CropX Technologies. These companies focus on precision farming, IoT-based monitoring, and advanced farm management platforms to strengthen competitiveness. Regionally, North America holds the largest share at 37.4% in 2024, driven by large-scale farms, strong digital infrastructure, and high adoption of precision agriculture. Europe follows with 23.7%, supported by sustainability regulations, while Asia Pacific rapidly expands with 17.8% and the fastest growth rate, fueled by food security initiatives and rising agri-tech investments.
Access crucial information at unmatched prices!
Request your sample report today & start making informed decisions powered by Credence Research Inc.!
Download Sample
Market Insights
- The global smart farming market was valued at USD 14,149.18 million in 2024 and is projected to reach USD 35,818.04 million by 2032, growing at a CAGR of 11.47%.
- Rising adoption of precision farming, which held the largest segment share in 2024, drives growth by enabling efficient resource utilization and higher crop yields.
- Key trends include the integration of IoT, AI, drones, and data analytics, along with expanding smart greenhouse adoption in regions with limited arable land.
- The competitive landscape is led by Deere & Company, Trimble Inc., AGCO Corporation, and Climate LLC (Bayer), supported by niche innovators like CropX Technologies and Conservis Corporation.
- Regionally, North America led with 37.4% share in 2024, followed by Europe at 23.7%, while Asia Pacific accounted for 17.8% and is the fastest-growing region with strong government support and food security initiatives.
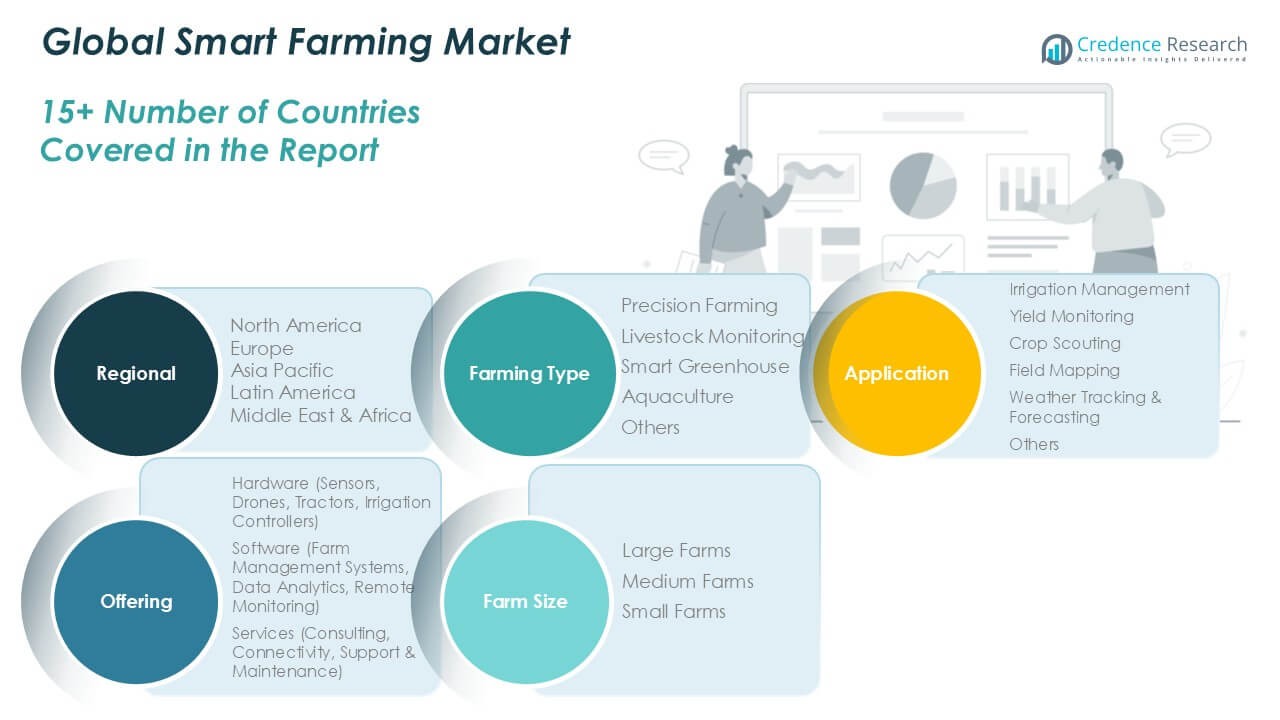
Market Segmentation Analysis:
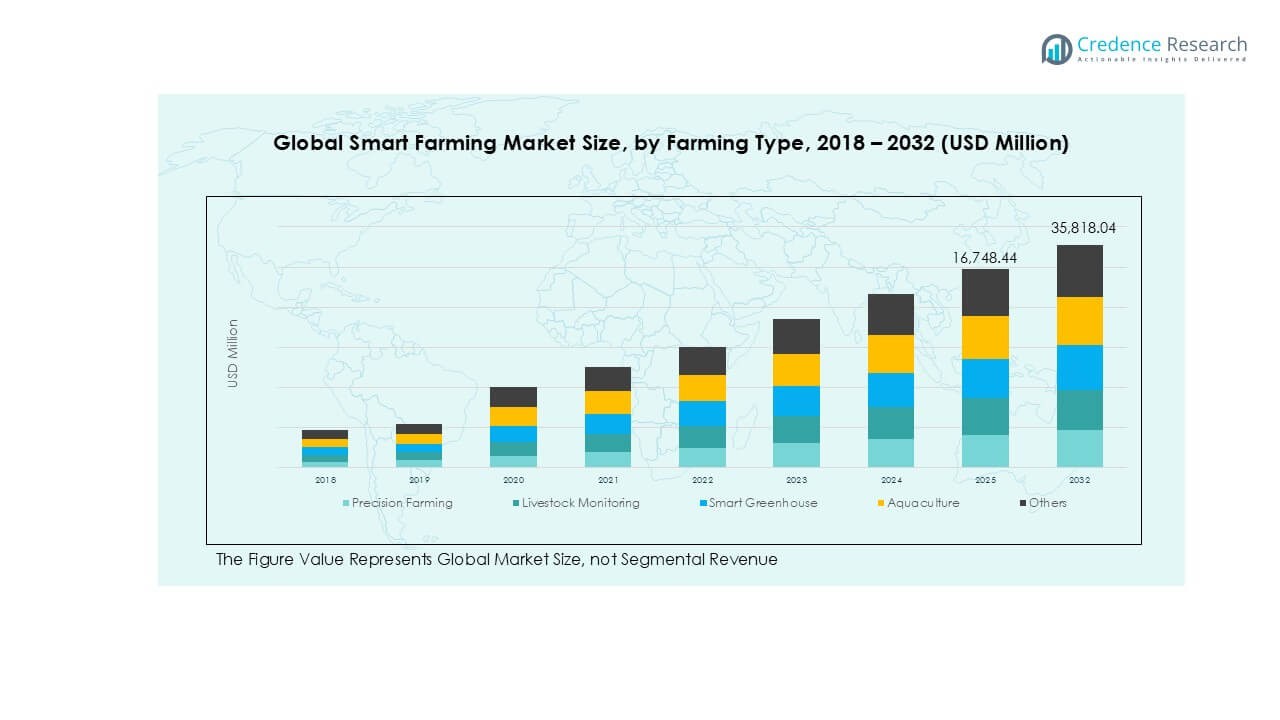
By Farming Type
Precision farming dominates the global smart farming market, holding the largest revenue share. Its growth is driven by the rising adoption of GPS-enabled equipment, variable rate technology, and IoT-based monitoring systems. Farmers increasingly rely on precision farming solutions to optimize resource utilization, reduce input costs, and improve crop productivity. Livestock monitoring and smart greenhouse solutions follow, supported by demand for animal health tracking and controlled farming environments. Aquaculture and other farming types continue to expand, though at a slower pace, as digital adoption in fisheries and niche farming segments progresses steadily.
- For instance, John Deere’s Operations Center connects more than 500 million acres globally through GPS-enabled tractors and smart farming equipment.
By Application
Irrigation management represents the leading application segment, capturing the highest market share. The dominance is linked to the growing need for efficient water usage in agriculture, especially in regions facing water scarcity. Advanced irrigation controllers, soil moisture sensors, and automated systems help reduce wastage while enhancing crop yield. Yield monitoring and crop scouting also show strong adoption, enabling real-time decision-making. Field mapping and weather tracking add further value by improving farm planning and risk management. Other applications are expanding gradually, supported by data-driven farming practices and integration with analytics platforms.
- For instance, Netafim’s drip irrigation systems have irrigated over 10 million hectares of land globally, helping farmers save water by up to 70% compared to traditional irrigation methods
By Offering
Hardware accounts for the largest share in the smart farming market, with strong demand for sensors, drones, tractors, and irrigation controllers. These tools form the backbone of precision agriculture, enabling real-time data collection and automated operations. Increasing mechanization, coupled with affordability of smart equipment, drives this segment forward. Software solutions, particularly farm management systems and data analytics platforms, are gaining momentum as farms adopt digital ecosystems. Services including consulting, connectivity, and support play a critical role in ensuring effective implementation, though they contribute a smaller share compared to hardware and software.
Key Growth Drivers
Rising Adoption of Precision Agriculture
Precision agriculture is a major growth driver in the smart farming market. Farmers increasingly deploy GPS-enabled tools, variable rate technology, and IoT sensors to optimize resource use. These solutions reduce costs, improve crop yields, and enhance sustainability. Growing government support for modern agricultural techniques further strengthens adoption. The demand for high efficiency and profitability pushes farmers to adopt technology-driven farming, making precision agriculture the largest growth contributor across global markets. Its scalability across large and medium farms sustains long-term market expansion.
- For instance, John Deere’s precision farming solutions connect more than 500 million acres globally through GPS-enabled tractors, sprayers, and data platforms.
Growing Need for Sustainable Farming Practices
Sustainability concerns strongly influence the smart farming market. Farmers face mounting pressure to reduce carbon footprints, water usage, and chemical dependency. Smart farming technologies enable resource-efficient operations through automated irrigation, smart greenhouses, and predictive analytics. These practices not only lower input costs but also meet rising consumer demand for eco-friendly food production. Governments and international bodies provide incentives for sustainable farming, creating strong adoption potential. The global push for climate-resilient agriculture ensures sustained growth of smart farming solutions focused on sustainability and resource optimization.
- For instance, Netafim has irrigated over 10 million hectares of land globally and has helped farmers achieve water savings of 50-70% compared to traditional methods.
Rising Demand for Food Security and Productivity
Global population growth drives higher demand for agricultural output, making food security a key driver. Smart farming technologies enhance productivity by integrating yield monitoring, livestock tracking, and crop scouting. Advanced tools help farmers manage risks such as climate change, water shortages, and pest infestations. By enabling data-driven decisions, these solutions maximize output on limited farmland. Growing urbanization and dietary changes further stress the agricultural system, reinforcing the need for high-efficiency farming. Smart farming ensures stable food supply chains, aligning with global food security goals.
Key Trends and Opportunities
Integration of IoT, AI, and Big Data
The integration of IoT devices, artificial intelligence, and big data analytics is reshaping smart farming. Real-time data from drones, sensors, and connected equipment supports predictive modeling for crop growth, pest control, and irrigation. AI-driven insights allow farms to optimize labor, resources, and machinery performance. Big data enhances farm planning by enabling long-term analysis of soil, weather, and yield patterns. The growing use of connected platforms creates opportunities for predictive agriculture, leading to more precise, scalable, and profitable farming operations worldwide.
- For instance, Trimble’s products are used globally, with the company having over 8,000 employees in more than 35 countries and its products sold in over 130 countries. While this shows widespread reach, it does not confirm the specific “100,000 farmers” number for the Ag Software.
Expansion of Smart Greenhouses and Controlled Environments
Smart greenhouses are emerging as a key opportunity in the smart farming market. They allow year-round crop production under controlled temperature, humidity, and nutrient conditions. Automated monitoring systems and AI-powered climate control boost yields while reducing input dependency. Rising adoption in regions with limited arable land, such as parts of Asia and the Middle East, fuels growth. The integration of renewable energy sources and hydroponic systems within smart greenhouses further expands opportunities. Controlled environment farming is expected to be a major trend in urban and high-density regions.
- For instance, Philips Horticulture LED Solutions (now known as Signify) has deployed its technology across a substantial global area, including a 68.5-hectare project for Agro-Invest in Russia, allowing for year-round production.
Key Challenges
High Initial Investment and Operating Costs
The high cost of deploying smart farming solutions remains a significant challenge. Advanced equipment such as drones, sensors, and automated tractors requires substantial capital investment, limiting adoption among small and medium farmers. Ongoing costs for maintenance, connectivity, and software updates further strain budgets. Many regions lack adequate subsidies or financial support mechanisms. This cost barrier slows down widespread implementation, especially in developing markets. Bridging affordability gaps through financing models and cost-sharing schemes will be critical for greater adoption of smart farming technologies.
Limited Digital Infrastructure and Connectivity Issues
Poor digital infrastructure, particularly in rural and developing regions, hampers smart farming adoption. Many advanced solutions rely on stable internet connectivity, cloud-based platforms, and IoT integration. However, weak networks, high data costs, and unreliable electricity supply restrict effective deployment. Farmers in underserved areas struggle to access real-time data and digital platforms. This digital divide slows technology penetration, even where awareness and demand are high. Addressing connectivity issues through rural broadband expansion and satellite-based solutions will be key to unlocking full market potential.
Regional Analysis
North America
North America accounted for the largest share of the global smart farming market in 2018, valued at USD 3,332.81 million, and reached USD 6,178.93 million in 2024. The region is projected to attain USD 15,684.68 million by 2032, expanding at a CAGR of 11.5%. Strong adoption of precision farming, livestock monitoring, and advanced farm management software drives this growth. The U.S. dominates the market due to high technology integration, strong government support, and established agri-tech players. North America’s large-scale farms and advanced digital infrastructure ensure its continued leadership in global market share.
Europe
Europe represented a major regional market, recording USD 2,170.43 million in 2018 and USD 3,920.99 million in 2024. It is expected to reach USD 9,352.72 million by 2032 at a CAGR of 10.6%. The region holds a significant market share, supported by strict regulatory frameworks emphasizing sustainable farming and reduced environmental impact. Countries such as Germany, France, and the Netherlands lead adoption with advanced greenhouse systems and precision farming solutions. Europe’s focus on food safety, climate-resilient practices, and agricultural digitization programs ensures consistent market growth and solid regional contribution.
Asia Pacific
Asia Pacific is the fastest-growing region in the smart farming market, expanding at a CAGR of 13.2%. The market was valued at USD 1,444.43 million in 2018, grew to USD 2,934.04 million in 2024, and is projected to reach USD 8,417.42 million by 2032. Rising population, food security concerns, and increasing government initiatives for agricultural modernization drive demand. China, India, and Japan lead adoption, with significant investments in smart greenhouses, drones, and irrigation management systems. Asia Pacific’s accelerating digital infrastructure and strong agricultural base enhance its global market share and growth outlook.
Latin America
Latin America held a smaller yet growing share of the smart farming market, valued at USD 334.12 million in 2018 and USD 617.57 million in 2024. It is projected to reach USD 1,371.36 million by 2032, advancing at a CAGR of 9.6%. The region’s adoption is led by Brazil and Argentina, where precision farming and irrigation management are increasingly implemented in large-scale farms. Rising demand for productivity improvement and water-efficient farming drives adoption. Government programs supporting agri-tech adoption further strengthen Latin America’s role, although infrastructural challenges limit broader penetration compared to developed markets.
Middle East
The Middle East smart farming market reached USD 174.66 million in 2018 and USD 293.13 million in 2024. It is forecasted to grow to USD 598.77 million by 2032, registering a CAGR of 8.5%. The region contributes a modest share, primarily driven by adoption of smart greenhouse technologies and controlled-environment farming. Countries like the UAE and Saudi Arabia focus on agri-tech to ensure food security amid limited arable land. Heavy investments in hydroponics, vertical farming, and IoT-based systems support market expansion, though adoption remains slower compared to more established farming regions.
Africa
Africa represented the smallest market share in 2018 at USD 96.94 million, reaching USD 204.52 million in 2024. It is projected to attain USD 393.09 million by 2032, growing at a CAGR of 7.6%. The region faces constraints such as limited infrastructure, low digital penetration, and funding challenges. However, demand for food security and modernization creates steady growth potential. South Africa and Nigeria lead adoption with pilot projects in irrigation management and livestock monitoring. International support programs and gradual improvements in connectivity are expected to drive Africa’s future contribution to the global smart farming market.
Market Segmentations:
By Farming Type
- Precision Farming
- Livestock Monitoring
- Smart Greenhouse
- Aquaculture
- Others
By Application
- Irrigation Management
- Yield Monitoring
- Crop Scouting
- Field Mapping
- Weather Tracking & Forecasting
- Others
By Offering
- Hardware (Sensors, Drones, Tractors, Irrigation Controllers)
- Software (Farm Management Systems, Data Analytics, Remote Monitoring)
- Services (Consulting, Connectivity, Support & Maintenance)
By Farm Size
- Large Farms
- Medium Farms
- Small Farms
By Geography
- North America
- Europe
- Germany
- France
- U.K.
- Italy
- Spain
- Rest of Europe
- Asia Pacific
- China
- Japan
- India
- South Korea
- South-east Asia
- Rest of Asia Pacific
- Latin America
- Brazil
- Argentina
- Rest of Latin America
- Middle East & Africa
- GCC Countries
- South Africa
- Rest of the Middle East and Africa
Competitive Landscape
The global smart farming market is highly competitive, with leading players focusing on innovation, partnerships, and digital integration to strengthen their positions. Deere & Company, Trimble Inc., and AGCO Corporation dominate with extensive product portfolios, including precision farming equipment, sensors, and farm management platforms. Companies like Topcon Positioning Systems, Raven Industries, and AG Leader Technology drive competitiveness through advanced GPS solutions, data analytics, and IoT-enabled systems. GEA Group AG and Conservis Corporation enhance their presence by targeting livestock monitoring and farm management software, respectively. Climate LLC (Bayer) and CropX Technologies contribute with strong expertise in data-driven crop analytics and soil sensing. Strategic moves such as acquisitions, product launches, and collaborations remain central to growth strategies. The market reflects a strong balance between established global corporations and specialized technology firms, ensuring continuous innovation and widespread adoption of smart farming solutions across varied agricultural applications and regions.
Shape Your Report to Specific Countries or Regions & Enjoy 30% Off!
Key Player Analysis
- Deere & Company
- Trimble Inc.
- AGCO Corporation
- Topcon Positioning Systems
- Raven Industries
- AG Leader Technology
- GEA Group AG
- Conservis Corporation
- Climate LLC (Bayer)
- CropX Technologies
Recent Developments
- In April 2025, Farmers Edge Inc. partnered with Taurus Ag Marketing Inc. to expand access to high-quality soil testing solutions across Canada. Taurus will improve the availability of advanced lab services, delivering industry-leading turnaround times and tailored insights to support data-driven decisions for growers, agronomists, and agri-businesses.
- In July 2023, Deere & Company announced the acquisition of Smart Apply, Inc. The company planned to leverage Smart Apply’s precision spraying to assist growers in addressing the challenges associated with input costs, labor, regulatory requirements, and environmental goals.
- In May 2023, AgEagle Aerial Systems Inc. announced that it had entered into a 2-year supply agreement with Wingtra AG. This agreement is intended to secure the supply of RedEdge-P sensor kits for incorporation with WingtraOne VTOL drones. This is specifically resourceful for those seeking to benefit materially from unparalleled, high precision, and plant-level detail in commercial agriculture, environmental research, forestry, and water management applications.
- In April 2023, AGCO Corporation announced a strategic collaboration with Hexagon for the expansion of AGCO’s factory-fit and aftermarket guidance offerings. The new guidance system was planned to be commercialized as Fuse Guide on Valtra and Massey Ferguson tractors.
- In February 2023, Topcon Agriculture unveiled the launch of Transplanting Control, an exceptional guidance control solution for specialty farmers. This turnkey solution was designed to boost efficiency, reduce labor, and proliferate production. Further, it delivers GNSS-driven guidance, autosteering & control, thereby proving advantageous for the growers of perennial trees, vegetables, and fruits.
- In January 2023, ASI Logistics, in collaboration with SICK, Inc., announced the successful implementation of autonomous yard truck operations. In this collaboration, ASI Logistics leveraged its groundbreaking Vehicle Automation Kit (VAK) along with the industry-leading LiDAR systems of SICK.
Report Coverage
The research report offers an in-depth analysis based on Farming Type, Application, Offering, Farm Size and Geography. It details leading market players, providing an overview of their business, product offerings, investments, revenue streams, and key applications. Additionally, the report includes insights into the competitive environment, SWOT analysis, current market trends, as well as the primary drivers and constraints. Furthermore, it discusses various factors that have driven market expansion in recent years. The report also explores market dynamics, regulatory scenarios, and technological advancements that are shaping the industry. It assesses the impact of external factors and global economic changes on market growth. Lastly, it provides strategic recommendations for new entrants and established companies to navigate the complexities of the market.
Future Outlook
- The smart farming market will grow steadily with rising adoption of precision agriculture.
- Digital platforms and IoT integration will enhance real-time farm decision-making.
- AI and big data analytics will expand predictive farming capabilities.
- Drone usage will increase for field mapping, crop scouting, and spraying.
- Smart greenhouse solutions will gain traction in land-constrained regions.
- Livestock monitoring systems will advance with wearable and sensor-based technologies.
- Sustainability and resource efficiency will remain primary drivers of adoption.
- Asia Pacific will emerge as the fastest-growing regional market.
- Partnerships between agri-tech firms and farmers will accelerate technology penetration.
- Governments will support smart farming adoption through subsidies and policies.


