
Market Overview
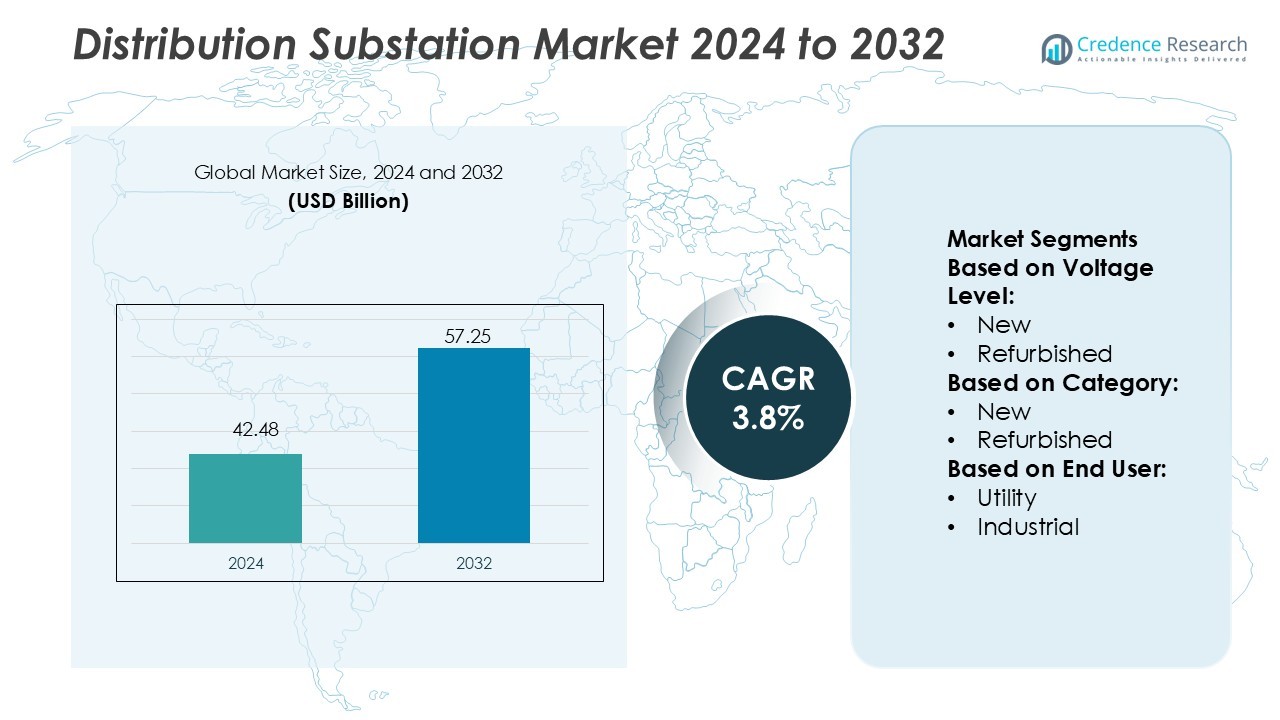
Distribution Substation Market size was valued USD 42.48 billion in 2024 and is anticipated to reach USD 57.25 billion by 2032, at a CAGR of 3.8% during the forecast period.
| REPORT ATTRIBUTE | DETAILS |
|---|---|
| Historical Period | 2020-2023 |
| Base Year | 2024 |
| Forecast Period | 2025-2032 |
| Distribution Substation Market Size 2024 | USD 42.48 Billion |
| Distribution Substation Market, CAGR | 3.8% |
| Distribution Substation Market Size 2032 | USD 57.25 Billion |
The distribution substation market includes major players offering switchgear, transformers, protection relays, and digital automation platforms for reliable grid performance. Companies strengthen portfolios with SCADA systems, smart sensors, and predictive maintenance tools that reduce outages and improve operational efficiency. Many suppliers also provide compact GIS solutions for space-constrained urban and industrial locations. Service offerings such as refurbishment, life-extension programs, and turnkey engineering help capture cost-sensitive projects and long-term utility contracts. Asia Pacific leads the market with a 34% share, supported by rapid urbanization, grid expansion, electrification programs, and strong renewable energy integration across developing and developed economies.
Market Insights
- Distribution Substation Market size was valued at USD 42.48 billion in 2024 and is projected to reach USD 57.25 billion by 2032, registering a CAGR of 3.8% during the forecast period.
- Rising demand for reliable power, renewable integration, and grid modernization drives adoption of digital protection relays, SCADA systems, smart sensors, and predictive maintenance tools to reduce outages and improve system efficiency.
- Compact GIS units gain strong traction in metro zones, industrial parks, and transport networks due to limited land availability and higher safety needs, while the new substation segment holds a dominant 68% share.
- Competition intensifies as vendors expand digital automation, life-extension services, refurbishment programs, and turnkey engineering to win utility contracts and cost-sensitive infrastructure upgrades across developing regions.
- Asia Pacific leads with a 34% regional share due to rapid urbanization, rising electricity demand, and large renewable projects, while North America and Europe focus on replacing aging assets and improving grid reliability.
Market Segmentation Analysis:
By Voltage Level
The voltage level segment includes new and refurbished units, with new installations holding a 68% market share. Utilities and industries prefer new substations because they support higher load capacity, smart protection relays, and remote monitoring. Grid modernization programs and renewable integration push demand for compact GIS and advanced AIS units. Refurbished units hold a smaller share due to aging equipment limits and reduced upgrade flexibility. The shift toward higher reliability, lower outage risk, and digital SCADA compatibility keeps new voltage-level systems dominant across transmission and distribution networks.
- For instance, Rockwell Automation’s Allen-Bradley ControlLogix platform supports a large number of I/O points (up to 128,000 digital I/O points and 4,000 analog I/O points per controller).
By Category
The category segment includes new and refurbished equipment, with new systems commanding a 71% market share. Countries invest in new control panels, switchgear, and transformers to meet rising peak-load and rural electrification needs. Utilities prefer new systems because they feature IoT sensors, real-time fault detection, and automated switching. Refurbished units serve cost-sensitive projects but have shorter life cycles and limited efficiency gains. Growing smart grid deployments, electric vehicle charging infrastructure, and renewable power plants increase purchase of new substation units across major markets.
- For instance, Efacec’s medium-voltage metal-clad air-insulated switchgear supports ratings up to 36 kV and 4,000 A with withstand currents of 50 kA, while integrating digital protection relays that react rapidly for fault isolation.
By End User
The end user segment includes utility and industrial customers, with utility operators controlling a 61% market share. Power distribution companies upgrade substations to support grid reliability, voltage regulation, and renewable energy flow. Automated substations help utilities reduce downtime, improve remote operation, and cut maintenance costs. Industrial users adopt medium-voltage substations for mining, oil and gas, metal processing, and manufacturing hubs. However, the larger installed base of urban and rural grids keeps the utility sector dominant as governments expand transmission corridors and urban load centers.
Key Growth Drivers
- Rising Investments in Grid Modernization Governments and utilities invest in modern distribution substations to strengthen grid reliability, reduce transmission losses, and manage growing power demand. Many countries focus on replacing outdated switchgear, transformers, and protection systems with advanced digital units. Smart substations equipped with real-time monitoring and automated fault isolation support stable power flow in urban and rural networks. Electrification of transport and rural communities adds new load on existing grids, creating demand for larger capacity installations. The shift toward stable, efficient power networks remains a major growth catalyst.
- For instance, ZX0.2 gas-insulated switchgear has a maximum short-circuit withstand rating of 31.5 kA for 3 seconds, not 40 kA. The 40 kA rating is available on different or higher-specification switchgear lines (e.g., ZX2).
- Expansion of Renewable Energy Integration Growing wind and solar installations drive the need for substations that manage variable power generation and reverse power flow. Distribution substations with smart relays, digital protection controls, and automated voltage regulation help balance renewable output and grid demand. Nations with aggressive clean energy targets upgrade substations to improve grid flexibility and reduce outage risks. Industrial players also invest in dedicated substations for green hydrogen, solar parks, and wind farms. This trend supports steady demand for modern high-capacity equipment.
- For instance, CG Power and Industrial Solutions manufactures power transformers rated up to 765 kV and 500 MVA (and higher, up to 1,500 MVA) for renewable evacuation projects, while its digital protection relays support IEC 61850 communication for rapid, reliable operation.
- Increased Industrial and Urban Power Consumption Rapid industrialization, commercial expansion, and urbanization increase power usage across manufacturing, data centers, transportation, and residential infrastructure. Industries require reliable medium-voltage substations to avoid production downtime and ensure equipment safety. Cities add new substations to manage rising peak-load from commercial buildings, metro rail systems, and EV charging points. The growth of smart cities, logistics parks, and industrial corridors supports higher substation investments. This rising load pressure boosts demand for advanced protection, monitoring, and automation systems.
Key Trends & Opportunities
- Growing Adoption of Digital and Smart Substations Utilities and industries shift toward digital substations equipped with remote monitoring, SCADA systems, IoT sensors, and predictive maintenance tools. These systems improve fault detection, reduce downtime, and enhance workforce safety through contactless inspection. Smart relays, automated switching, and cyber-secure communication channels enable faster grid response. Digitalization also supports renewable integration and distributed energy management. The rising demand for intelligent grid infrastructure creates a major opportunity for new installations and retrofit upgrades.
- For instance, Eaton’s Power Xpert UX 17.5 kV switchgear delivers arc-flash containment tested to 31.5 kA for 1 second. The internal arc classification (IAC) is AFLR (protection for personnel at front, sides, and rear), certified up to 31.5 kA for 1 second.
- Rising Demand for Compact GIS Solutions Gas-insulated substations gain traction due to smaller footprint, high safety, and low maintenance requirements. Urban areas, industrial zones, metro rail networks, and offshore power systems adopt GIS to overcome land constraints and environmental limitations. GIS units offer stronger arc protection, minimal outage risk, and longer service life compared to air-insulated systems. The trend supports innovation in compact switchgear, lightweight enclosures, and modular layouts. Market players gain growth opportunities by supplying GIS units for smart cities and renewable plant expansions.
- For instance, General Electric’s B65 GIS platform operates at up to 145 kV with a breaking current of 40 kA, and its g³-based GIS eliminates SF₆ while reducing CO₂ equivalent.
- Growth Potential in Refurbishment and Life-Extension Projects Aging distribution networks in North America, Europe, Asia, and Latin America create demand for refurbishment services. Utilities extend asset life by replacing worn transformers, relays, breakers, and protection panels instead of building new substations. Modern digital components improve efficiency and fault response while lowering capital investment. Vendors offering turnkey refurbishment, condition monitoring, and maintenance services find strong opportunity in cost-sensitive markets. This trend improves grid reliability without high infrastructure spending.
Key Challenges
- High Installation and Replacement Cost New substations require significant capital spending on transformers, switchgear, cabling, and protection equipment. Costs increase further when adding digital automation, cybersecurity, and advanced monitoring systems. Rural electrification projects face budget limits, forcing utilities to delay upgrades or choose refurbished units. Expensive land acquisition and civil works add more financial pressure in urban areas. These cost barriers often slow modernization plans in developing regions despite rising demand.
- Technical Skill Shortage and Cybersecurity Risks Smart and digital substations require skilled engineers to manage SCADA, communication systems, and automated relays. Many regions lack experienced technicians for installation, calibration, and cyber-secure network integration. As substations move toward remote operation, cyber threats become a serious concern. Utilities must invest in workforce training, encryption, and secure communication protocols to prevent data breaches and operational disruption. Skill shortages and cybersecurity gaps challenge large-scale digital deployment across global distribution networks.
Regional Analysis
North America
North America holds a 28% market share, driven by rapid upgrades to aging infrastructure and strong adoption of digital substations. Utilities replace outdated equipment to reduce outage frequency, enhance power quality, and increase grid automation. The U.S. leads due to investments in renewable integration, electric vehicle charging networks, and smart grid programs. Canada also focuses on rural electrification and regional interconnections. High reliability standards, cybersecurity compliance, and demand for compact GIS units support new installations. Industrial demand from data centers, oil and gas, and manufacturing further strengthens regional growth.
Europe
Europe accounts for a 24% market share, supported by strong regulations for grid efficiency, low carbon targets, and renewable integration. Countries modernize distribution networks to manage energy from offshore wind, solar plants, and distributed generation. The EU invests in digital substations and smart meters to enhance grid visibility and reliability. The U.K., Germany, and France lead installations, while Eastern Europe upgrades aging grid assets. Compact GIS adoption rises due to land constraints in urban centers. Ongoing electrification of public transport and EV infrastructure also drives substation expansion across the region.
Asia Pacific
Asia Pacific dominates the market with a 34% share, driven by rapid industrialization, urban growth, and rising electricity demand. China and India expand distribution networks for smart cities, manufacturing corridors, and renewable energy parks. Southeast Asian nations invest in new substations to improve rural power availability and reduce transmission losses. Affordable equipment supply, government electrification targets, and high power consumption in commercial hubs accelerate installations. Local production of transformers, switchgear, and control systems supports cost advantages. The region remains the fastest-growing market due to large-scale infrastructure development.
Latin America
Latin America holds a 7% market share, supported by grid expansion across Brazil, Mexico, Argentina, and Chile. Utilities improve distribution systems to manage industrial demand, renewable energy growth, and voltage stability challenges. Rural electrification and modernization of outdated substations gain priority in national energy strategies. Cost-sensitive markets often adopt refurbished equipment, while large cities deploy GIS units for space-saving and reliability. Investments from global OEMs and public-private partnerships support steady growth. Unstable power grids and frequent outages increase the need for automated protection and advanced monitoring technologies.
Middle East & Africa
The Middle East & Africa region accounts for a 7% share, driven by power demand from oil refineries, mining, desalination plants, and industrial zones. Gulf countries invest in digital substations to support urban development and renewable energy projects. Africa focuses on expanding grid access, reducing distribution losses, and increasing electrification rates in rural areas. Compact GIS systems gain adoption where extreme temperatures and sand conditions challenge traditional equipment. International funding and power sector reforms support upgrades, but budget constraints and skill shortages slow widespread modernization.
Market Segmentations:
By Voltage Level:
- New
- Refurbished
By Category:
- New
- Refurbished
By End User:
- Utility
- Industrial
By Geography
- North America
- U.S.
- Canada
- Mexico
- Europe
- Germany
- France
- U.K.
- Italy
- Spain
- Rest of Europe
- Asia Pacific
- China
- Japan
- India
- South Korea
- South-east Asia
- Rest of Asia Pacific
- Latin America
- Brazil
- Argentina
- Rest of Latin America
- Middle East & Africa
- GCC Countries
- South Africa
- Rest of the Middle East and Africa
Competitive Landscape
The competitive landscape of the distribution substation market features Rockwell Automation, Efacec, Open System International, ABB, CG Power and Industrial Solutions, Eaton, Locamation, General Electric, L&T Electrical and Automation, and Hitachi Energy. The distribution substation market is shaped by continuous product innovation, digital integration, and long-term service models. Vendors focus on advanced switchgear, protection relays, and smart monitoring platforms that enhance efficiency, safety, and outage prevention. Rising demand for GIS-based compact substations drives development of modular designs suitable for dense urban zones and industrial facilities. Companies also expand automation and SCADA capabilities to support remote control, real-time performance tracking, and predictive maintenance. Many players strengthen portfolios with cybersecurity tools, digital twins, and IoT-enabled asset management software. Strategic collaboration with utilities and EPC firms helps secure large modernization and renewable integration projects. Refurbishment and life-extension services gain traction in cost-sensitive markets, where users prefer upgrading existing assets over new builds. Overall, strong competition encourages faster adoption of digital substations, improving reliability, operational flexibility, and grid stability across global power networks.
Key Player Analysis
- Rockwell Automation
- Efacec
- Open System International
- ABB
- CG Power and Industrial Solutions
- Eaton
- Locamation
- General Electric
- L&T Electrical and Automation
- Hitachi Energy
Recent Developments
- In March 2025, Schneider Electric announced the launch of the One Digital Grid Platform. The platform provides a technical foundation for independent software solutions, which enables utilities to accelerate grid modernization and deliver more affordable and cleaner energy.
- In August 2024, Power Grid Corporation of India Ltd acquired Rajasthan IV E Power Transmission Ltd (RIVEPTL) for following its selection as the successful bidder under Tariff-Based Competitive Bidding.
- In July 2024, Iberdrola partnered with Ormazabal has announced its pivotal role in a specialized project for Iberdrola the creation of a mobile substation tailored for emergency scenarios.The key features of the substation include Ormazabal cpg.0 primary distribution switchgear with a 24 kV / 1600 A / 25 kA busbar, alongside protection and control equipment.
- In June 2024, ABB launched ABB Ability™ OPTIMAX® 6.4, an enhanced software solution designed as a key component of their digital energy infrastructure. This upgrade mainly focuses on endorsing energy efficiency and helping industrial operators accelerate decarbonization.
Report Coverage
The research report offers an in-depth analysis based on Voltage Level, Catagory, End-User and Geography. It details leading market players, providing an overview of their business, product offerings, investments, revenue streams, and key applications. Additionally, the report includes insights into the competitive environment, SWOT analysis, current market trends, as well as the primary drivers and constraints. Furthermore, it discusses various factors that have driven market expansion in recent years. The report also explores market dynamics, regulatory scenarios, and technological advancements that are shaping the industry. It assesses the impact of external factors and global economic changes on market growth. Lastly, it provides strategic recommendations for new entrants and established companies to navigate the complexities of the market.
Future Outlook
- Digital substations will see wider adoption due to automation and remote control needs.
- Utilities will upgrade aging assets to improve grid reliability and reduce power losses.
- Compact GIS units will gain demand in urban areas with space and safety constraints.
- Smart sensors and predictive maintenance tools will reduce downtime and equipment failures.
- Renewable energy projects will drive new substation installations for flexible power flow.
- Cybersecure communication networks will become a standard requirement in modern grids.
- Industrial zones, data centers, and transport networks will add dedicated medium-voltage substations.
- Rural electrification programs will increase demand for cost-effective and modular units.
- Refurbishment and life-extension services will rise in cost-sensitive and developing regions.
- Vendor competition will intensify as companies expand automation, condition monitoring, and digital platforms.

Request a Free Sample
Fill in your details and we'll send you a free sample report.
- Sample data tables & charts
- Research methodology
Need a Custom Version of This Report?
Tailor the scope, geography, or segments to your exact requirements.
- Custom geography or segment scope
- Direct access to our analyst team
Frequently Asked Questions
What is the current market size for the Distribution Substation Market, and what is its projected size in 2032?
At what Compound Annual Growth Rate is the Distribution Substation Market projected to grow between 2025 and 2032?
Which Distribution Substation Market segment held the largest share in 2024?
What are the primary factors fueling the growth of the Distribution Substation Market?
Who are the leading companies in the Distribution Substation Market?
Which region commanded the largest share of the Distribution Substation Market in 2024?
Table of Content
Chapter 1 Market Segmentation
- 1.1 Segmentation Framework
- 1.1.1 Product and Service Classification
- 1.1.2 Application and End-Use Classification
- 1.1.3 Technology and Solution Classification
- 1.1.4 Customer and Distribution Channel Classification
- 1.1.5 Geographic Segmentation
- 1.1.6 Market Segment Definitions and Boundaries
Chapter 2 Introduction
- 2.1 Report Objectives and Scope
- 2.2 Product Definition and Industry Terminology
- 2.3 Market Inclusions and Exclusions
- 2.4 Research Process
- 2.4.1 Primary Research and Expert Interviews
- 2.4.2 Secondary Research and Source Review
- 2.4.3 Top-Down and Bottom-Up Estimation
- 2.4.4 Data Triangulation and Verification
- 2.5 Market Size Measurement Basis
- 2.5.1 2024: USD 42.48 billion → 2032: USD 57.25 billion
- 2.6 Historical and Forecast Reference Periods
- 2.6.1 Base Year: 2024
- 2.6.2 Forecast Period: 2024-2032
- 2.7 Research Assumptions and Limitations
Chapter 3 Executive Summary
- 3.1 Market Snapshot and Key Findings
- 3.2 Base-Year Market Size, 2024
- 3.3 Forecast Market Size, 2032
- 3.4 Revenue and Volume Growth Outlook
- 3.5 Key Demand and Supply Indicators
- 3.6 Leading Market Segments
- 3.7 Fastest-Growing Market Opportunities
- 3.8 Regional Performance Highlights
- 3.9 Technology and Industry Transformation
- 3.10 Competitive Landscape Summary
- 3.11 Analyst View and Strategic Implications
Chapter 4 Global Distribution Substation Market Trends and Developments
- 4.1 Historical Industry Development
- 4.2 Recent Market Trends and Developments
- 4.3 Demand and Customer Behavior Trends
- 4.4 Technology and Product Innovation
- 4.5 Artificial Intelligence, Automation and Digitalization
- 4.6 Local Manufacturing and Supply Chain Realignment
- 4.7 Industry Partnerships, Mergers and Acquisitions
- 4.8 Sustainability and Circular Economy Developments
- 4.9 Government and Private Sector Investment Trends
- 4.10 Emerging Business Models and Commercialization
- 4.11 Industry Developments and Announcements
Chapter 5 Global Distribution Substation Market Production, Supply and Demand Analysis
- 5.1 Demand Trend and Consumption Analysis
- 5.2 Demand Forecast, 2024-2032
- 5.3 Production and Output Trend
- 5.4 Production and Output Forecast, 2024-2032
- 5.5 Installed Capacity and Capacity Utilization
- 5.6 Company-Wise Production Plants and Statistics
- 5.6.1 Installed Production Capacity
- 5.6.2 Actual Production
- 5.6.3 Planned Capacity and Expansion Targets
- 5.7 Supply Chain Structure and Procurement Trends
- 5.8 Supply-Demand Gap and Bottlenecks
- 5.9 Import Dependence and Sourcing Structure
- 5.10 Contract Manufacturing and Outsourcing
- 5.11 Regional Supply and Demand Concentration
Chapter 6 Global Distribution Substation Market Pricing Analysis
- 6.1 Pricing Structure and Measurement
- 6.2 Historical Pricing Trends
- 6.3 Pricing Outlook, 2024-2032
- 6.4 Average Selling Price and Unit Economics
- 6.5 Pricing by Product and Market Segment
- 6.6 Geographic Pricing Differences
- 6.7 Key Input, Energy, Labor and Logistics Costs
- 6.8 Contract Pricing and Purchasing Models
- 6.9 Pricing Sensitivity and Competitive Positioning
- 6.10 Price, Margin and Profitability Implications
Chapter 7 Global Distribution Substation Market Dynamics
- 7.1 Market Growth Drivers
- 7.1.1 Demand-Side Drivers
- 7.1.2 Technology and Innovation Drivers
- 7.1.3 Infrastructure and Investment Drivers
- 7.1.4 Regulatory and Policy Drivers
- 7.2 Market Restraints
- 7.2.1 Cost and Affordability Constraints
- 7.2.2 Technology and Adoption Barriers
- 7.2.3 Supply Chain and Operational Constraints
- 7.3 Market Challenges
- 7.3.1 Competitive Pressure and Margin Erosion
- 7.3.2 Skills, Infrastructure and Implementation Gaps
- 7.4 Emerging Market Opportunities
- 7.5 Market Dynamics Impact and Time-Horizon Assessment
Chapter 8 Global Distribution Substation Value Chain Analysis
- 8.1 Industry Value Chain Overview
- 8.2 Upstream Suppliers and Critical Inputs
- 8.3 Technology and Component Providers
- 8.4 Manufacturing or Service Delivery
- 8.5 Distribution, Channel Partners and Integrators
- 8.6 Downstream Applications and End Users
- 8.7 Value Addition and Profit Pools
- 8.8 Vertical Integration and Outsourcing
- 8.9 Supplier Concentration and Risk
- 8.10 Supply Chain Localization and Resilience
Chapter 9 Global Distribution Substation Market Regulations and Policies
- 9.1 Relevant Laws, Standards and Compliance Frameworks
- 9.2 Product, Service, Safety and Quality Requirements
- 9.3 Government Policies, Incentives and Subsidies
- 9.4 Imports, Exports and Trade Barriers
- 9.5 Public Procurement and Local Content Requirements
- 9.6 Environmental and Sustainability Compliance
- 9.7 Upcoming Policy Changes and Market Implications
Chapter 10 Global Distribution Substation Market Hotspots and Opportunities
- 10.1 Market Opportunity Mapping and Growth Hotspots
- 10.2 High-Growth Applications and Customer Groups
- 10.3 Underserved Markets and White-Space Opportunities
- 10.4 Emerging Technology and Product Opportunities
- 10.5 New Capacity and Investment Hotspots
- 10.6 Market Entry and Expansion Opportunities
- 10.7 Distribution and Partnership Opportunities
- 10.8 Near-Term and Long-Term Commercial Potential
- 10.9 Opportunity Attractiveness and Execution Risks
Chapter 11 Global Distribution Substation Market Outlook, 2024-2032
- 11.1 Market Size and Analysis
- 11.1.1 Revenue (Market Measurement: 2024: USD 42.48 billion → 2032: USD 57.25 billion)
- 11.1.2 Market Volume and Quantity Sold
- 11.1.3 Historical Market Size
- 11.1.4 Base-Year Market Size, 2024
- 11.2 Market Forecast, 2024-2032
- 11.2.1 Revenue Forecast to 2032
- 11.2.2 Volume Forecast to 2032
- 11.2.3 CAGR and Year-on-Year Growth
- 11.2.4 Incremental Revenue Opportunity
- 11.3 Forecast Assumptions and Scenario Analysis
- 11.3.1 Base-Case Forecast
- 11.3.2 Optimistic and Conservative Scenarios
- 11.3.3 Technology, Pricing and Policy Sensitivities
- 11.4 Market Attractiveness and Growth Outlook
Chapter 12 Global Distribution Substation Market Segmentation and Outlook
- 12.1 Segmentation Summary and Market Shares, 2024
- 12.2 Largest and Fastest-Growing Segments
- 12.3 Segment Growth Comparison
- 12.4 Segment Attractiveness and Priority Matrix
Chapter 13 Global Distribution Substation Geographic Market Outlook, 2024-2032
- 13.1 Regional Market Size and Share, 2024
- 13.2 Regional Market Forecast, 2024-2032
- 13.3 Regional Pricing, Production and Demand Differences
- 13.4 North America
- 13.4.1 United States
- 13.4.2 Canada
- 13.4.3 Mexico
- 13.5 Europe
- 13.5.1 Germany
- 13.5.2 France
- 13.5.3 Italy
- 13.5.4 United Kingdom
- 13.5.5 Spain
- 13.5.6 Poland
- 13.5.7 Russia
- 13.5.8 Netherlands
- 13.5.9 Belgium
- 13.5.10 Sweden
- 13.5.11 Denmark
- 13.5.12 Norway
- 13.5.13 Rest of Europe
- 13.6 Asia Pacific
- 13.6.1 China
- 13.6.2 India
- 13.6.3 Japan
- 13.6.4 South Korea
- 13.6.5 Thailand
- 13.6.6 Indonesia
- 13.6.7 Vietnam
- 13.6.8 Malaysia
- 13.6.9 Australia
- 13.6.10 Rest of Asia Pacific
- 13.7 Latin America
- 13.7.1 Brazil
- 13.7.2 Argentina
- 13.7.3 Colombia
- 13.7.4 Chile
- 13.7.5 Rest of Latin America
- 13.8 Middle East
- 13.8.1 Saudi Arabia
- 13.8.2 United Arab Emirates
- 13.8.3 Turkey
- 13.8.4 Israel
- 13.8.5 Iran
- 13.8.6 Rest of the Middle East
- 13.9 Africa
- 13.9.1 South Africa
- 13.9.2 Egypt
- 13.9.3 Nigeria
- 13.9.4 Morocco
- 13.9.5 Rest of Africa
- 13.10 Regional Investment, Policy and Supply Chain Differences
- 13.11 Regional Competitive Landscape
- 13.12 Geographic Growth Hotspots
Chapter 14 Global Distribution Substation Technology, Innovation and Sustainability Outlook
- 14.1 Technology Landscape and Maturity
- 14.2 Product, Process and Service Innovation
- 14.3 AI, Automation and Digital Tools in the Industry
- 14.4 Technology Adoption and Performance Benchmarking
- 14.5 Innovation Pipeline and R&D Investment
- 14.6 Patent and Intellectual Property Trends
- 14.7 Energy Efficiency and Resource Management
- 14.8 Sustainability, Recycling and Circularity
- 14.9 Technology Roadmap, 2024-2032
- 14.10 Risks of Obsolescence and Technology Substitution
Chapter 15 Global Distribution Substation Market Key Strategic Imperatives
- 15.1 Growth and Market Entry Priorities
- 15.2 High-Return Products and Segments
- 15.3 Pricing, Profitability and Cost Optimization
- 15.4 Technology Investment and Product Differentiation
- 15.5 Supply Chain Localization and Resilience
- 15.6 Distribution and Customer Acquisition
- 15.7 Partnership, Acquisition and Capacity Strategy
- 15.8 Regional Expansion Priorities
- 15.9 Short-, Medium- and Long-Term Actions
Chapter 16 Competition Outlook
- 16.1 Industry Competition Characteristics
- 16.2 Market Structure and Concentration
- 16.3 Market Share and Competitive Positioning, 2024
- 16.4 Company-Wise Revenue and Product Benchmarking
- 16.5 Production and Service Capacity Benchmarking
- 16.6 Technology, Pricing and Differentiation
- 16.7 Regional Footprint and Distribution Strength
- 16.8 Mergers, Acquisitions and Strategic Alliances
- 16.9 New Entrants and Competitive Threats
- 16.10 Porter's Five Forces and Industry Attractiveness
- 16.11 Competitive Outlook, 2024-2032
Chapter 17 Company Profiles
- 17.1 Company Coverage and Selection Criteria
- 17.2 Leading Market Participants – Standard Profile Structure
- 17.2.1 Business Description
- 17.2.2 Company Ownership and Geographic Presence
- 17.2.3 Product and Service Portfolio
- 17.2.4 Manufacturing and Operating Footprint
- 17.2.5 Production Capacity and Expansion Plans
- 17.2.6 Financial Performance and Investment
- 17.2.7 Market Share and Competitive Position
- 17.2.8 Technology and Innovation Capabilities
- 17.2.9 Strategic Alliances or Partnerships
- 17.2.10 Recent Developments
- 17.2.11 Growth Strategy and Outlook
- 17.3 Other Relevant Market Participants
Note: Every listed company is profiled on the structure shown under the first company. The company list is preliminary and may change based on research findings, market developments, data availability and client requirements.
Chapter 18 Disclaimer
- 18.1 Research and Forecast Disclaimer
- 18.2 Data Source and Estimation Limitations
Note: The depth of individual sections depends on data availability for this market. Volume, capacity, trade and other unit-based metrics are included where applicable.

