Gate fees and heat sales fund residual waste plants
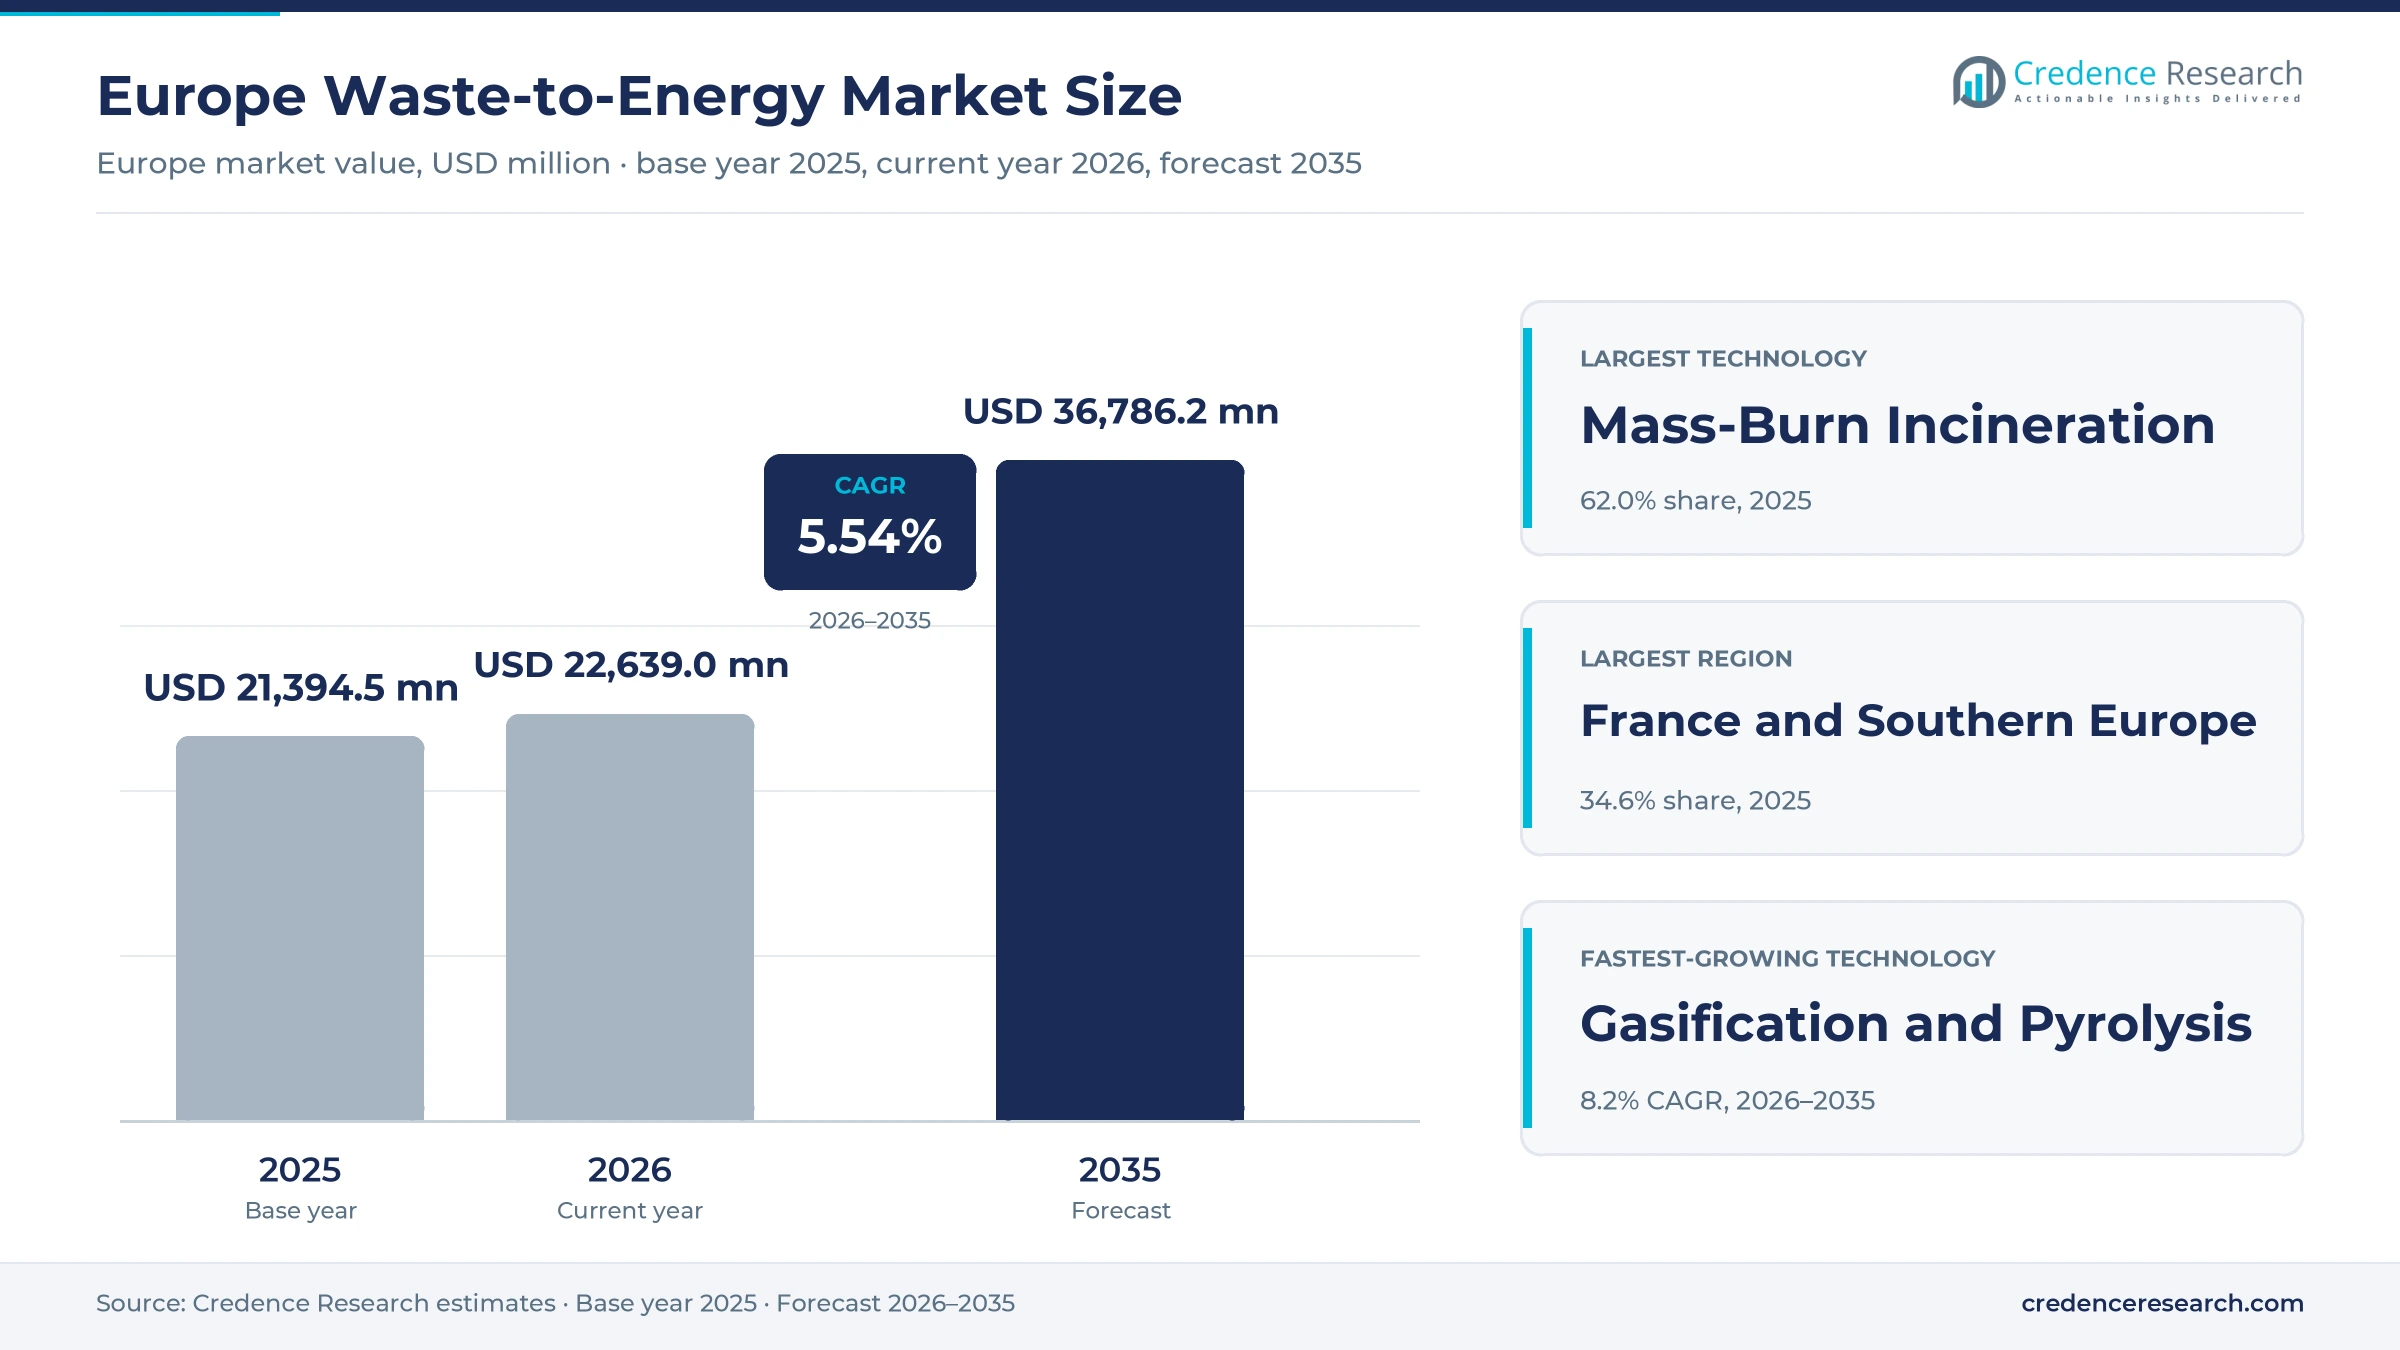
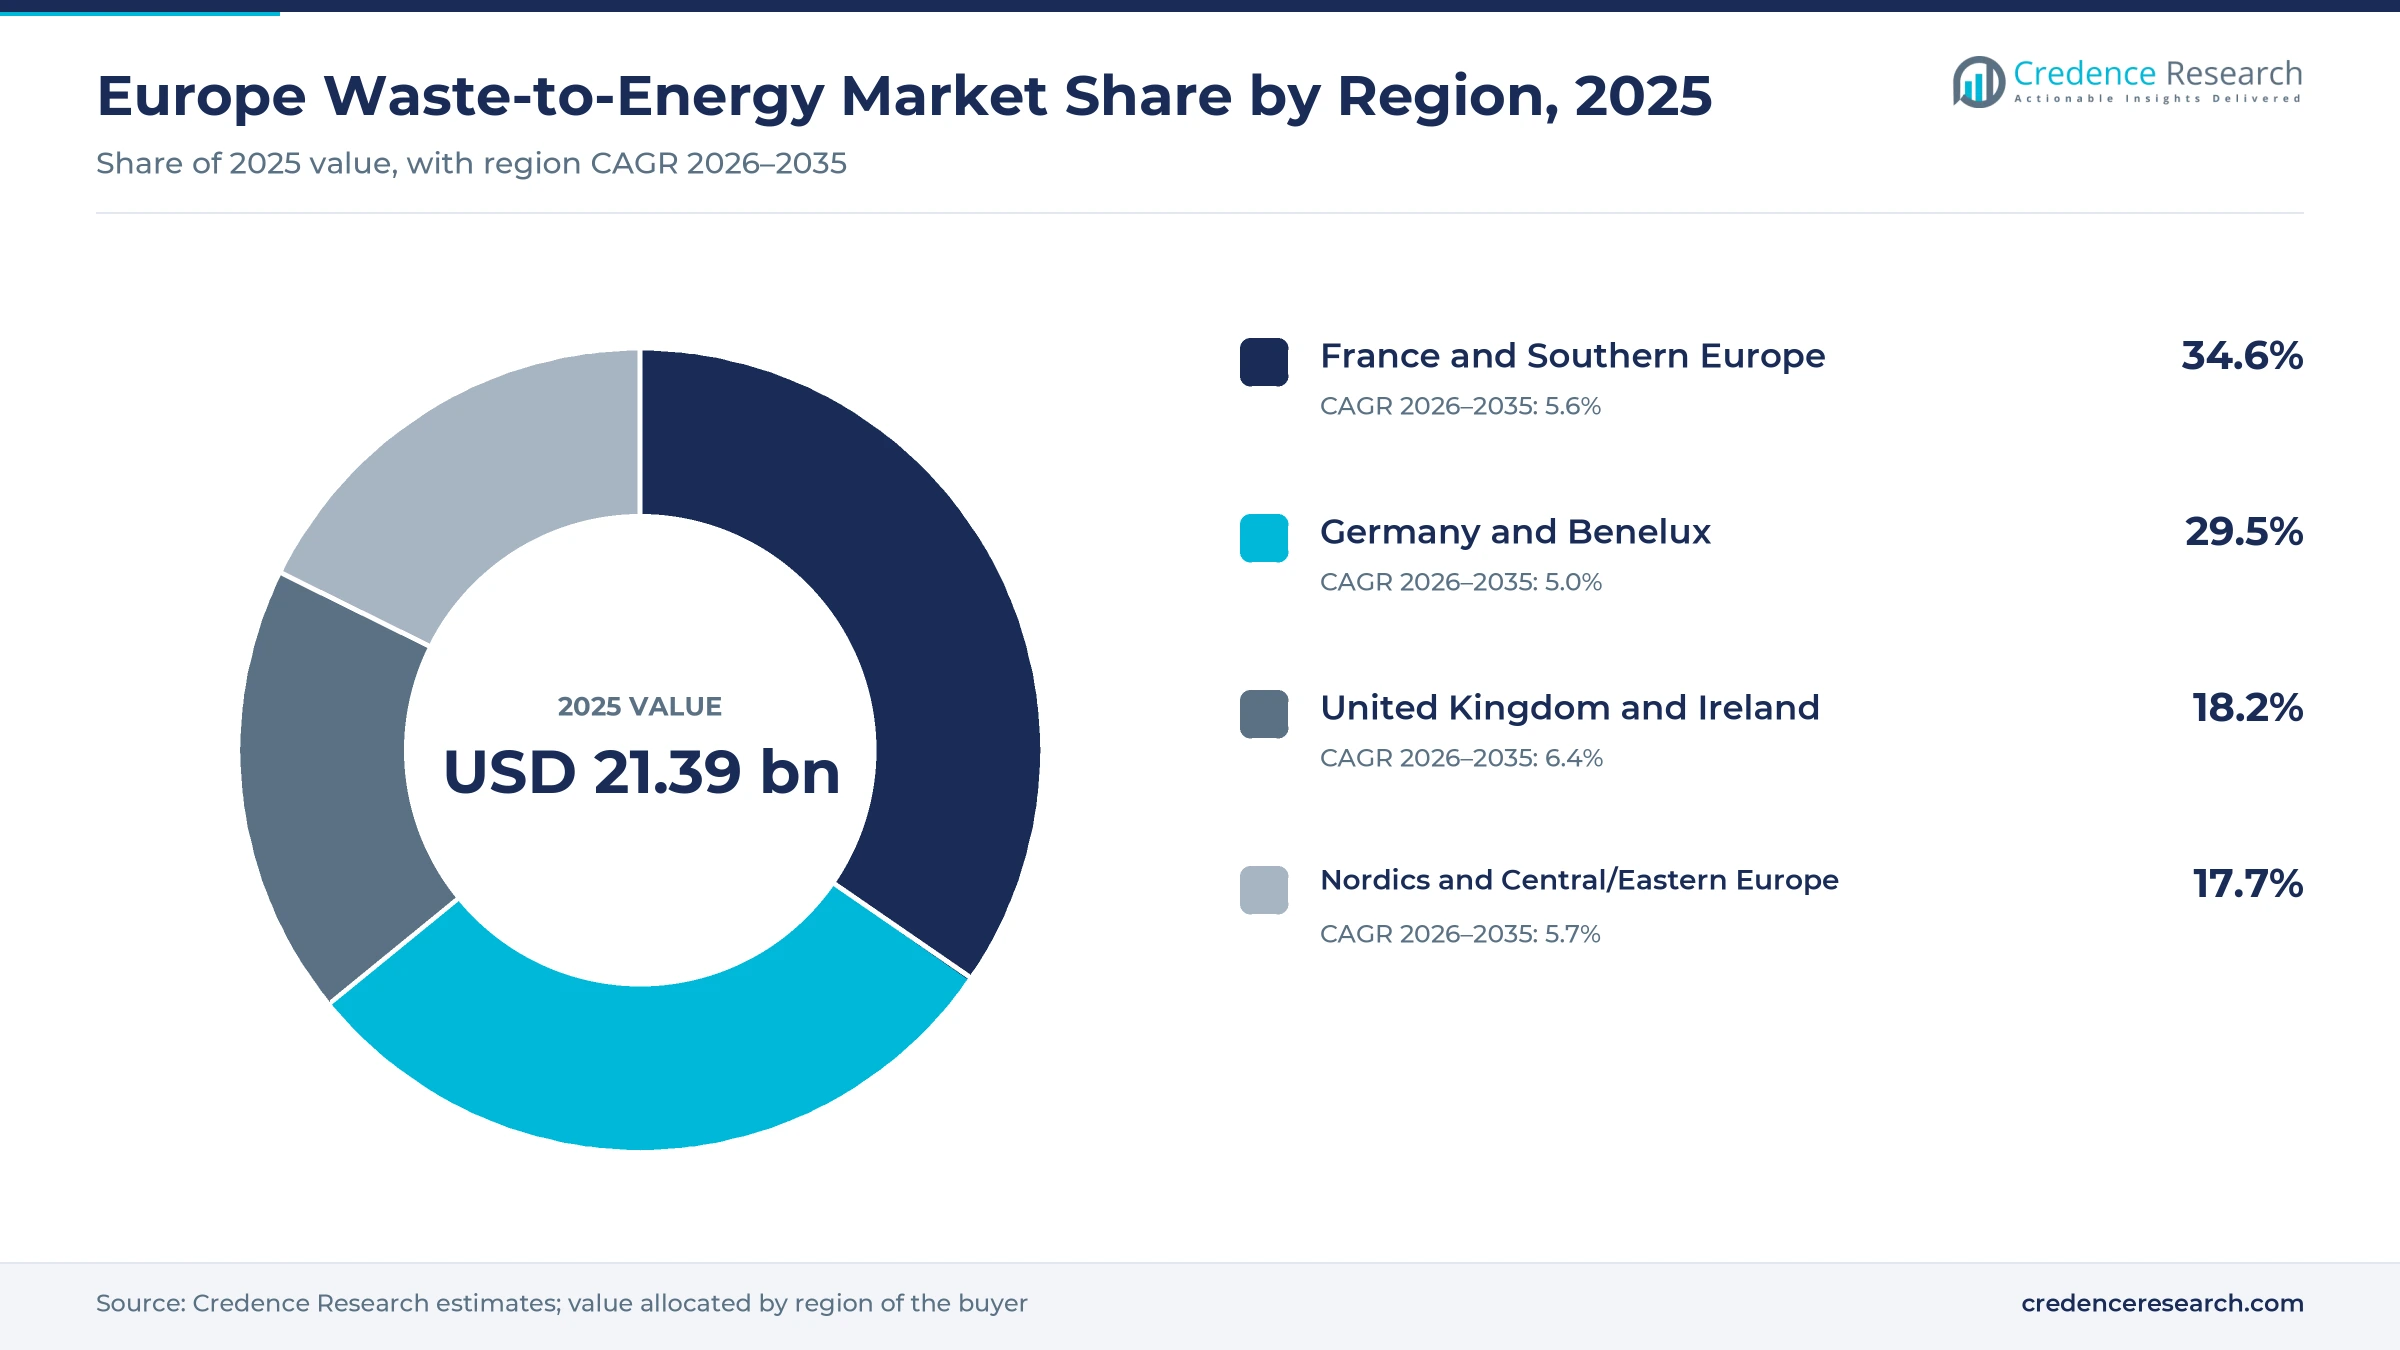
The Europe waste-to-energy market was valued at USD 21.39 billion in 2025 and is projected to increase from USD 22.64 billion in 2026 to USD 36.79 billion by 2035, registering a CAGR of 5.54% during 2026–2035. Revenue comes from two sources, the gate fees that councils and businesses pay to hand over residual waste and the electricity, heat, steam and biomethane that plants sell. France and Southern Europe held the largest regional share, 34.6% in 2025, because France runs the largest plant fleet by number and leads Europe in biomethane injection, while Italy is adding large urban plants. United Kingdom and Ireland is the fastest-growing region at 6.3% a year as several large energy recovery facilities enter service or reach financial close. The main commercial change is carbon pricing, since operators must now plan for emissions allowances on the fossil share of the waste they burn and price that cost into long-term gate fee contracts.
Which plants, feedstocks and energy sales make up the market?
The market counts the revenue of plants in Europe that recover energy from residual municipal waste, commercial and industrial residual waste, refuse-derived and solid recovered fuel, and source-separated biowaste. It covers mass-burn grate plants, fuel-based combustion lines, gasification and pyrolysis units and anaerobic digestion plants, together with the gate fees they charge and the power, heat, steam and gas they sell.
Waste collection, recycling plants, landfill operation and hazardous waste incineration sit outside the figure, as do agricultural biogas plants that do not take waste. Cement kilns that burn solid recovered fuel are counted only through the fuel supplied to them, not through cement sales.
Europe Waste-to-Energy Market Insights
- Plant revenue rises from USD 21.39 billion in 2025 to USD 36.79 billion by 2035, a 5.54% pace, as carbon costs feed into gate fees and heat sales grow.
- France and Southern Europe led with 34.6% of 2025 value, while United Kingdom and Ireland grows fastest at 6.3% a year on new large plants.
- Mass-Burn Incineration held 62.0% of 2025 value because grate furnaces treat most of the residual waste that Europe still cannot recycle.
- The European Commission proposed in July 2026 to phase municipal waste incineration into the EU Emissions Trading System from 2031 to 2034.
- Ownership is consolidating among infrastructure-backed operators, as Encyclis took full control of the 600,000-ton Rookery South plant in the U.K. in September 2026.
Mass-burn plants and municipal residual waste lead value
Why do mass-burn grate plants carry most of the value?
Based on technology, the market is categorized into mass-burn incineration, refuse-derived fuel combustion, gasification and pyrolysis, and anaerobic digestion. Mass-Burn Incineration led with 62.0% of 2025 value because grate plants handle mixed residual waste without pre-treatment, and CEWEP counted 92 plants in Germany and 116 in France in 2023. Gasification and Pyrolysis grows fastest at 8.2% a year from a small base, as operators test gasification lines that turn sorted residues into syngas for heat or chemicals. Buyers should expect grate technology to stay dominant for new municipal contracts through 2035.
How much value comes from household residual waste?
Based on waste type, the market is categorized into municipal residual waste, commercial and industrial residual waste, refuse-derived and solid recovered fuel, and source-separated biowaste. Municipal Residual Waste led with 58.0% of 2025 value because councils sign long contracts that tie household waste to one plant, such as the 29-year Tees Valley deal that seven north-east English councils closed in April 2026. Source-Separated Biowaste grows fastest at 7.1% a year, as France made source sorting of biowaste mandatory for every producer from Jan. 1, 2024, and other member states are following.
Which energy products earn the most for plant owners?
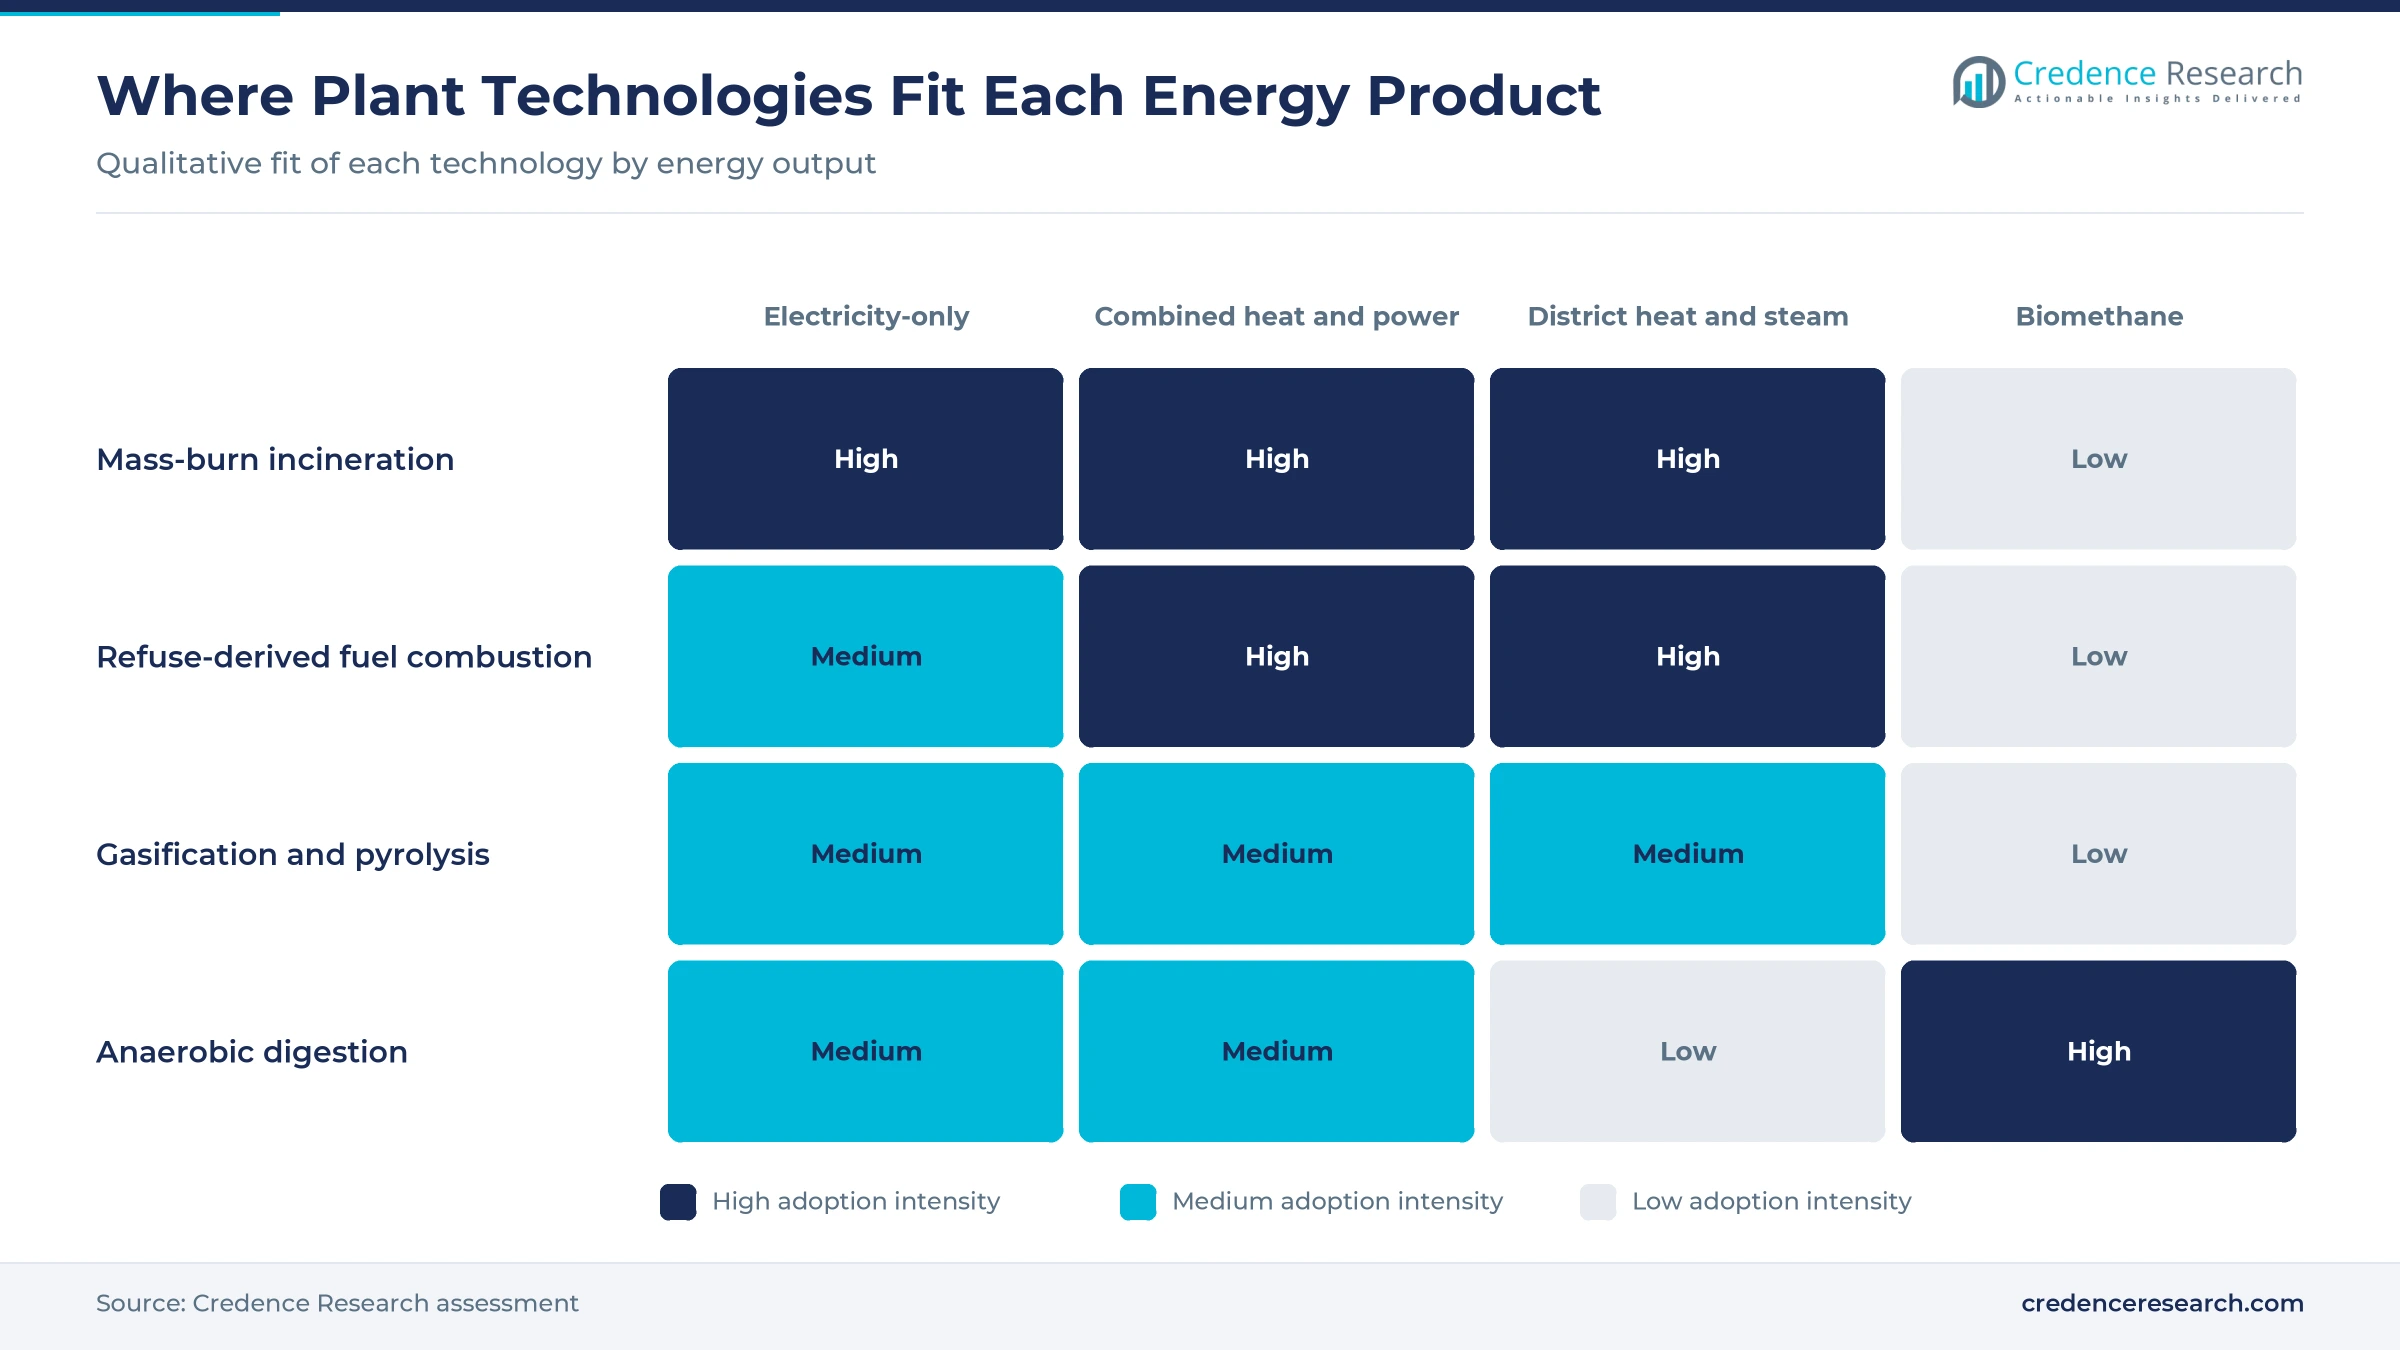
Based on energy output, the market is categorized into electricity-only, combined heat and power, district heat and industrial steam, and biomethane and renewable gas. Combined Heat and Power led with 48.0% of 2025 value because plants that sell heat as well as power raise income per ton, and the Gdańsk plant opened in 2025 to supply both 114,000 MWh of electricity and 509,000 GJ of heat a year. Biomethane and Renewable Gas grows fastest at 7.8% a year, as France injected 13.6 TWh of biomethane in 2025 from 803 grid-connected sites, according to Natran.
Who buys the energy and the treatment service?
Based on end user, the market is categorized into municipal utilities, district heating operators, industrial offtakers and electricity and gas networks. Municipal Utilities led with 38.0% of 2025 value because councils and their waste syndicates buy most treatment capacity, as the Sydetom66 syndicate did when it awarded SUEZ a 12-year contract worth nearly €420 million for the Calce plant in January 2026. Industrial Offtakers grows fastest at 6.1% a year, because Indaver’s Rivenhall site has planning consent for a 40-hectare greenhouse that could take about 90% of its heat and all of its captured CO2.
| Segment Group | Leading Sub-segment | Share, 2025 | Fastest-growing Sub-segment | CAGR, 2026–2035 |
|---|---|---|---|---|
| By Technology | Mass-Burn Incineration | 62.0% | Gasification and Pyrolysis | 8.2% |
| By Waste Type | Municipal Residual Waste | 58.0% | Source-Separated Biowaste | 7.1% |
| By Energy Output | Combined Heat and Power | 48.0% | Biomethane and Renewable Gas | 7.8% |
| By End User | Municipal Utilities | 38.0% | Industrial Offtakers | 6.1% |
Gate fees, landfill tax and carbon costs set plant pricing
Pricing works per metric ton of waste delivered, set in council contracts of 12 to 30 years with indexation and shorter spot deals for commercial waste. The ceiling is the landfill alternative, which in the U.K. costs the £126.15 per metric ton tax plus a modest landfill gate fee, so energy recovery can price close to that level. Carbon charges are the newest element, and operators now write pass-through clauses so that allowance costs move to the waste producer. Energy sales then decide margin, since a plant that sells heat earns more per metric ton than one that only exports power.
| Price element | Typical price or fee | Basis |
|---|---|---|
| U.K. energy from waste gate fee, bulky waste only, median | £182 per metric ton | WRAP gate fees survey via letsrecycle, July 2026 |
| U.K. landfill tax, standard rate | £126.15 per metric ton from April 1, 2025 | WRAP Gate Fees Report 2024/25 |
| U.K. food waste anaerobic digestion gate fee, median | £24 per metric ton in 2024/25, £13 in 2025/26 | WRAP gate fees survey via letsrecycle, July 2026 |
| German national CO2 price on waste fuels | €55 per metric ton CO2 in 2025, €55 to €65 corridor in 2026 | German Emissions Trading Authority data via ICAP |
| Netherlands proposed waste tax on incineration and landfill | €64 per metric ton from 2028, €81 from 2030 | Netherlands Enterprise Agency, business.gov.nl |
| Long-term operation and maintenance fee, LIPOR plant, Porto | About €46 per metric ton | Credence Research estimate from a €270 million, 15-year Veolia contract for about 390,000 tons a year |
Request a Free Sample
Fill in your details and we'll send you a free sample report.
- Sample data tables & charts
- Research methodology
Landfill limits, heat demand and carbon rules lift plants
Landfill limits keep residual waste flowing to plants
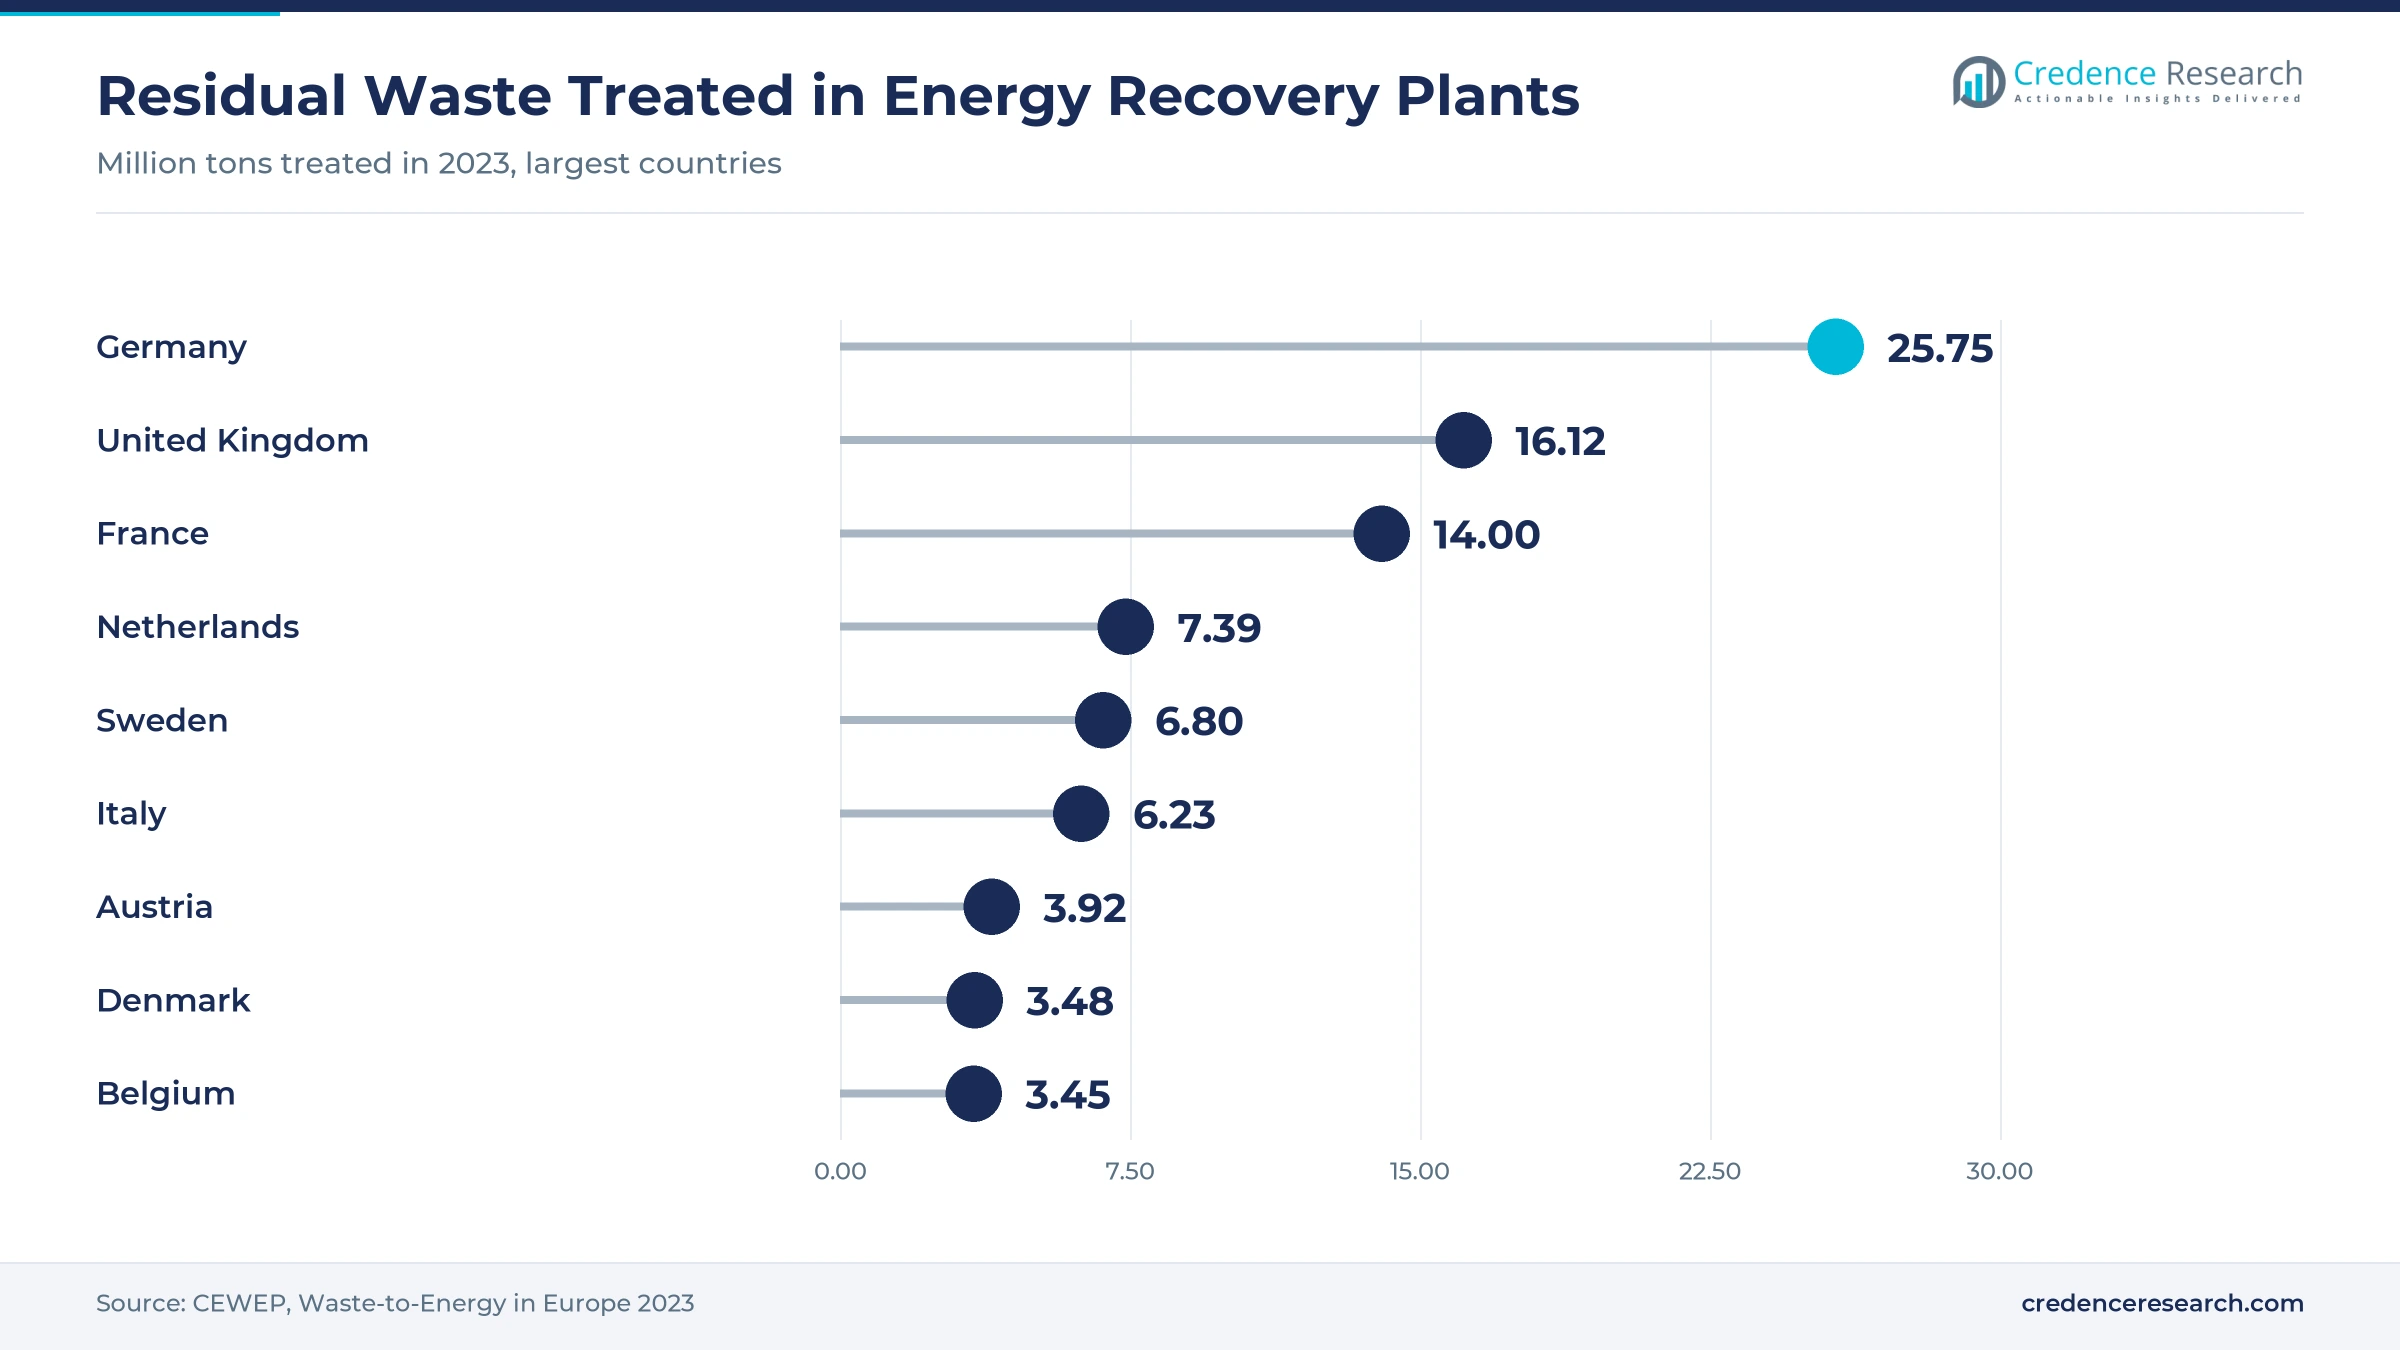
Landfill limits are the main reason residual waste keeps flowing to energy recovery plants, because the EU Landfill Directive caps municipal landfilling at 10% by 2035. CEWEP’s map shows that 499 plants treated about 101 million tons of residual waste in 2023, with Germany alone burning 25.75 million tons. Eurostat data reported by Eunews show that about 50 million tons still went to EU landfills in 2024, or 24% of municipal waste, so the gap to the 2035 cap remains large. Ten member states still landfilled more than half of their municipal waste, according to the CEWEP 2024 barometer. This means councils in southern and eastern Europe will keep tendering new capacity, while plants in the north stay full.
Heat networks pay more per ton than power exports
Local heat sales lift income per ton above what electricity exports alone can earn, and that favors plants built next to district heating networks and industrial sites. The Gdańsk plant delivers heat to the city network alongside power, and A2A has placed district heating and waste in one circular economy unit under its 2035 plan. Cory generated 542 GWh of electricity from London’s waste in 2025, meeting baseload demand with a supply that weather-dependent renewables cannot match. CEWEP’s 2025 barometer found 46% of operators rating their utilization as comparatively high. As a result, owners with secure heat offtake can sign longer contracts and accept lower gate fees than rivals.
Carbon rules move the cost of fossil waste to producers
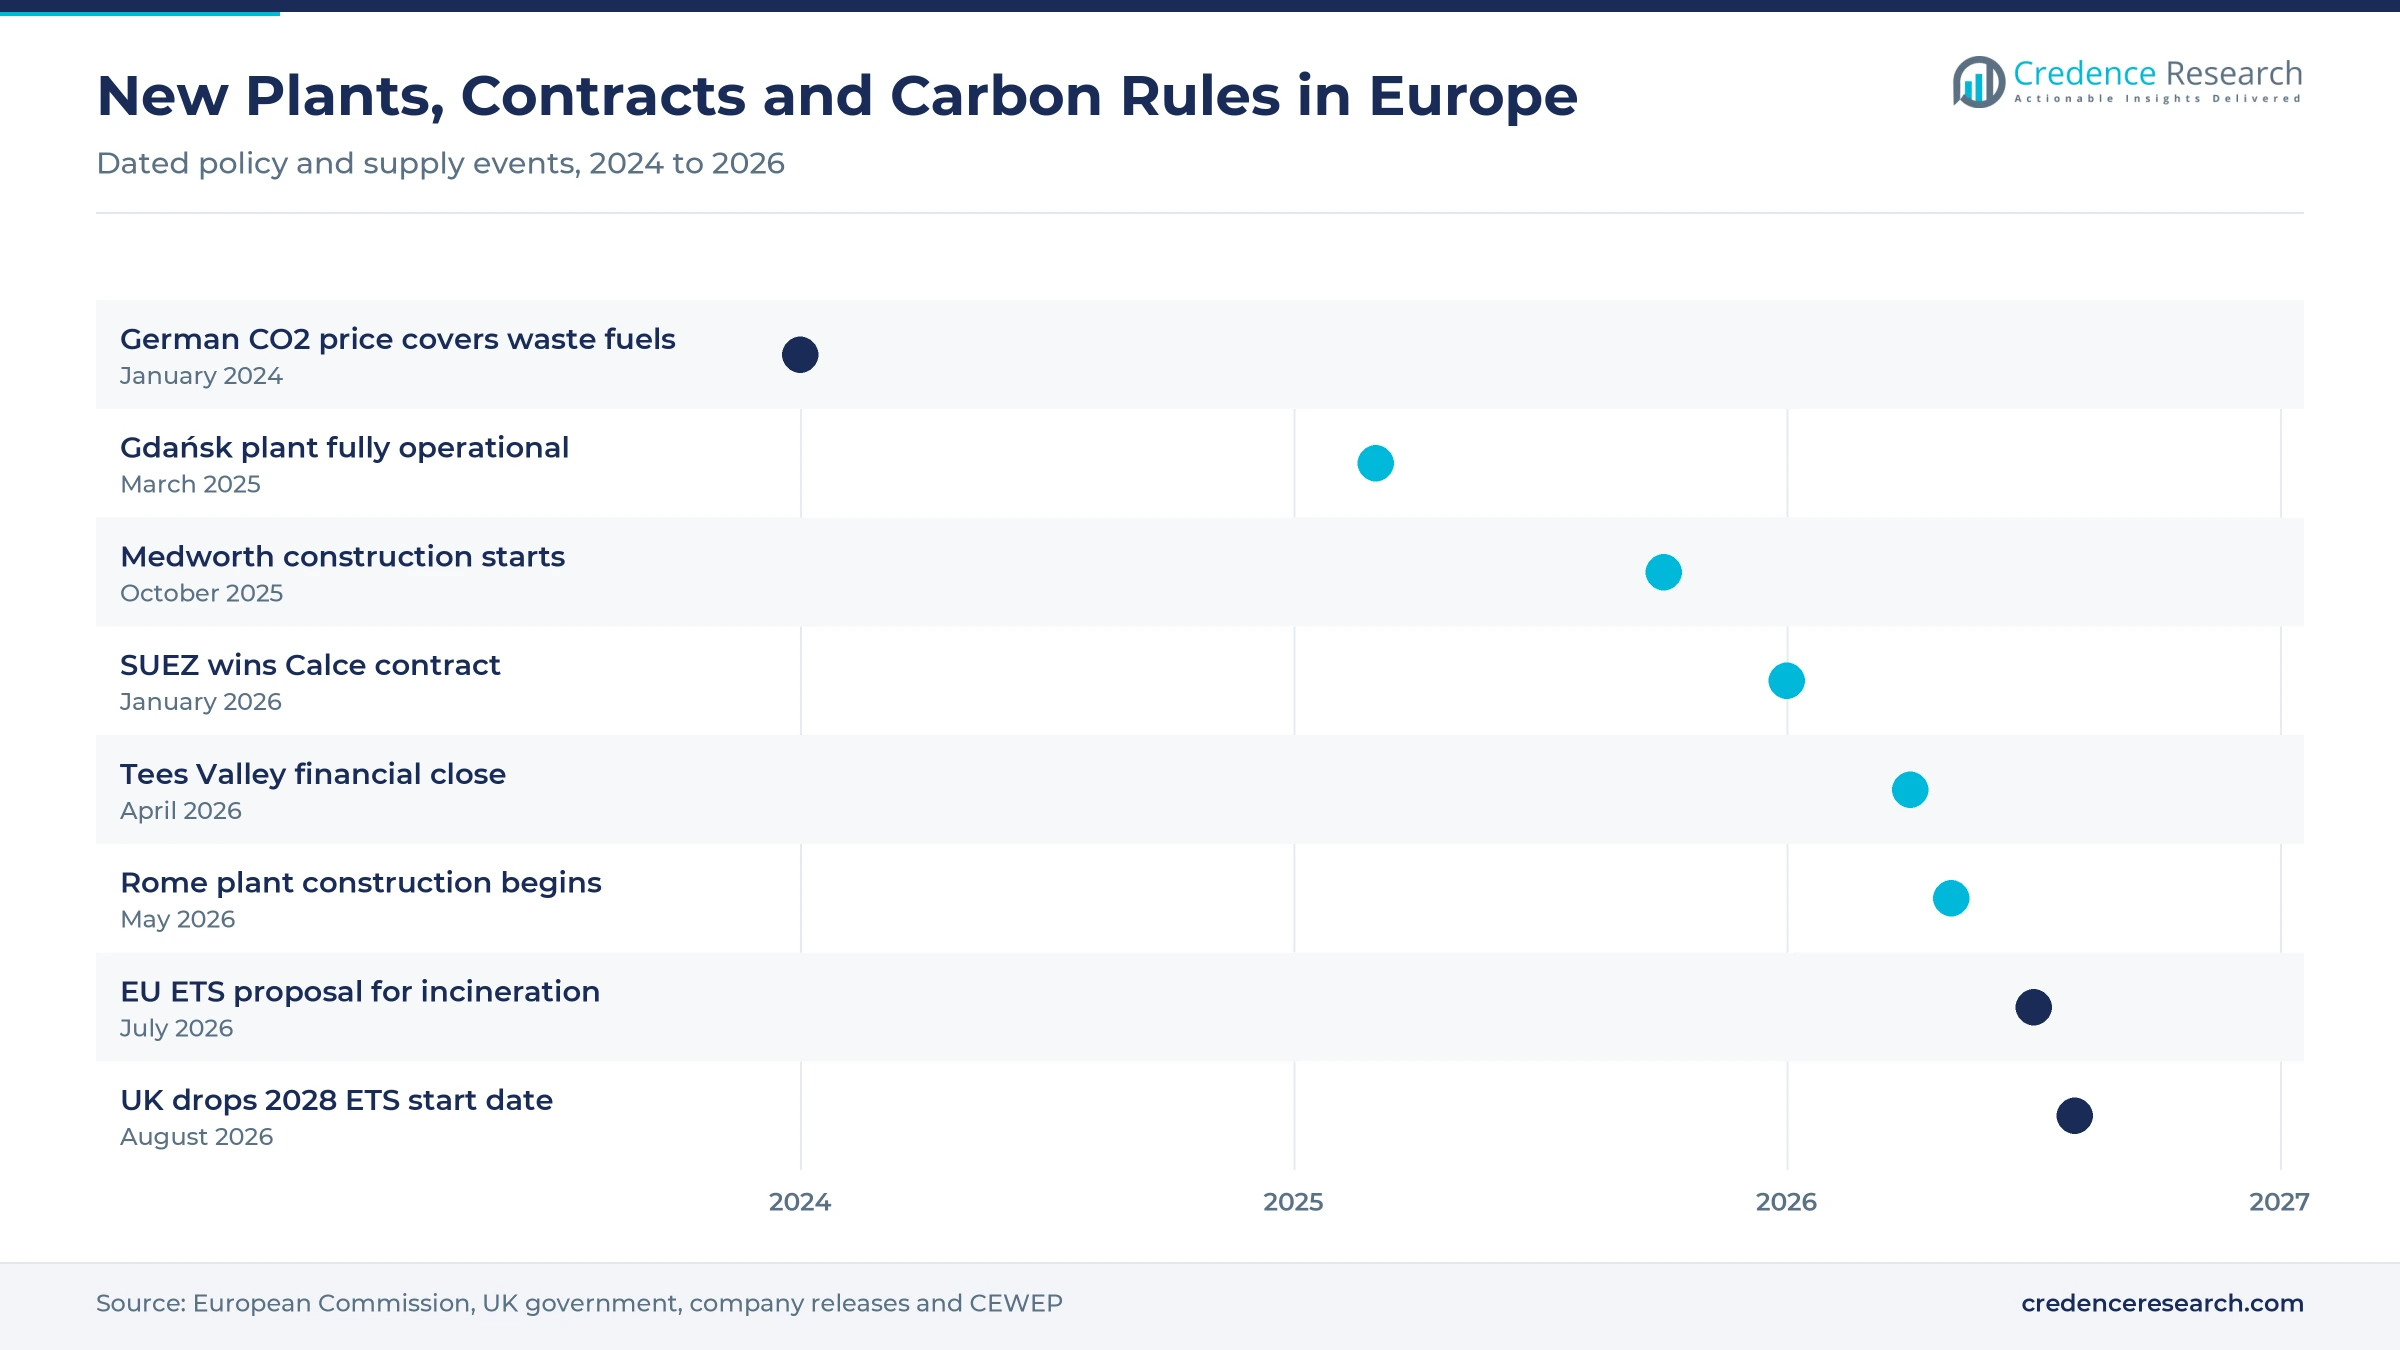
Carbon regulation is turning the fossil share of residual waste into a priced cost, which pushes operators toward capture and pass-through contracts. The European Commission proposed on July 17, 2026, to bring non-hazardous municipal waste incineration into the EU Emissions Trading System from 2031, with permits for 25% of emissions in 2031 rising to full coverage by 2034. Germany already added waste fuels to its national emissions trading scheme in January 2024, and the Netherlands plans a CO2 levy on incinerators that reaches €304 per metric ton of CO2 in 2035, according to the Netherlands Enterprise Agency. Plants that supply district heating can still receive free EU permits under the proposal. The net effect is higher gate fees and a stronger case for capture at large plants.
Separate biowaste collection feeds digestion plants
Mandatory separate biowaste collection is creating a feedstock stream for anaerobic digestion plants that produce biomethane. France required every waste producer and local authority to sort biowaste at source from Jan. 1, 2024, under its anti-waste law that follows the EU Waste Framework Directive. The European Biogas Association reported 5.2 bcm of biomethane output in 2024 from 1,620 producing plants, 111 more than a year earlier. Buyers of biomethane and biogas gain because waste-based gas qualifies for green certificates and grid injection. This shift gives digestion operators steadier volumes, although it also removes wet organic material that once lowered the calorific value at grate plants.
Carbon capture and long concessions reshape operators
Rise of carbon capture at large plants
Carbon capture is moving from studies to construction at the largest plants, because captured biogenic CO2 can be sold as carbon removal. Veolia was appointed on Oct. 27, 2026, to supply CO2 purification units for the Protos capture plant at Encyclis’s Cheshire site, which is designed to capture about 370,000 tons a year. Cory received development consent in 2025 for a London capture project of about 1.4 million tons a year by 2030. In Oslo, the Hafslund Celsio project targets about 350,000 tons a year from the third quarter of 2029 at a cost of NOK 8.3 billion. These projects show that capture will first suit plants with water access to storage.
Shift toward long concessions and consolidated ownership
Ownership is shifting toward long concessions and fewer, larger shareholders, which suits infrastructure investors that want stable cash flows. Encyclis bought Veolia U.K.’s 20% stake in Rookery South on Sept. 30, 2026, taking full control of a plant that treats about 600,000 tons a year. Veolia won back the operation of the LIPOR plant near Porto in July 2025 under a 15-year contract worth €270 million. EEW, owned by Beijing Enterprises Holdings, treated about 5.18 million tons in 2025 across 17 plants, according to EUWID. For councils, this means fewer bidders per tender but more capital for refurbishment.
Opening for new capacity in southern and eastern Europe
Southern and eastern Europe offer the clearest opening for new plants, because landfilling there remains high while EU funds and city budgets now back incineration. Construction of Rome’s €1 billion plant at Santa Palomba began on May 15, 2026, for 600,000 tons a year and 65 MW of output, with first waste due in November 2029, AGI reported. Gdańsk opened its 160,000-ton plant on March 24, 2025, after the EU put more than €62 million from the Cohesion Fund toward a total cost of about €144 million. A2A plans to manage about 6.6 million tons of waste by 2035. Contractors and operators with references in grate plants should expect a steady tender flow from these cities.
Opening for heat and CO2 sales to industry and growers
Industrial and agricultural heat users offer a second opening, because they pay for steady steam and CO2 that a plant produces anyway. Indaver opened its Rivenhall plant in June 2026, an €680 million site that processes up to 595,000 tons a year and can power about 125,700 homes. The greenhouse plan noted in the end-user segment above would turn that heat and CO2 into crop inputs rather than waste streams. CEWEP’s 2024 barometer found that 14% of operators had decided to build carbon management systems and 61% were discussing them. Operators that pair capture with a local buyer for CO2 can earn more than those relying on storage alone.
Carbon costs, shrinking feedstock and capex test operators
Will delayed carbon rules leave pricing uncertain?
Shifting carbon timetables make it hard for operators to price new contracts. The U.K. government dropped its plan to bring incineration into the U.K. Emissions Trading Scheme by 2028 on Aug. 26, 2026, without setting a new date, saying unclear plans had made budgeting hard for councils and industry. The EU proposal also moved the start from 2028 to 2031 and lets member states opt out until 2035. Operators therefore carry the risk of writing carbon clauses for a cost that may arrive years later, or not at all.
Is rising recycling shrinking the feedstock base?
Higher recycling rates slowly reduce the residual waste that plants depend on for gate fee income. The EU recycled 48.1% of municipal waste in 2024, up from 43.0% in 2014, according to Eurostat data reported by Eunews. CEWEP’s 2024 barometer found that 28% of operators expected thermal treatment quantities to decline. Plants sized for past volumes face lower utilization and must compete harder for commercial waste and imported fuel.
How much capital risk do new plants carry?
New plants and capture retrofits now need very large sums, which raises financing risk for councils and investors. Viridor’s Tees Valley plant carries a £2 billion contract value for 450,000 tons a year, and MVV called its roughly €500 million Medworth plant the largest single investment in its history. The Oslo capture project entered a cost-cutting phase in April 2023 before state support was revised. Delays of this kind can push new capacity back by several years.
Are digestion gate fees too low to fund new plants?
Falling gate fees for food waste weaken the business case for new digestion plants, even as separate collection grows. WRAP found that the U.K. median gate fee for food waste digestion fell to £13 per ton in 2025/26 from £24 a year earlier, as councils sent more separated food waste to existing sites. Developers that relied on gate fees must now depend more on gas sales and certificates. Smaller plants without a grid injection point face the greatest pressure.
France and Southern Europe lead while the U.K. grows fastest
| Region | Value, 2025 (USD billion) | Share, 2025 | CAGR, 2026–2035 |
|---|---|---|---|
| France and Southern Europe | 7.40 | 34.6% | 5.5% |
| Germany and Benelux | 6.31 | 29.5% | 5.0% |
| United Kingdom and Ireland | 3.89 | 18.2% | 6.3% |
| Nordics and Central/Eastern Europe | 3.79 | 17.7% | 5.7% |
France and Southern Europe lead on plant numbers and biomethane
France and Southern Europe held a 34.6% share of 2025 value and grows at 5.5% a year. France runs 116 energy recovery plants, the most of any country, and SUEZ alone operates 34 of them. Italy treated 6.23 million tons in 36 plants in 2023, and Rome’s new plant will add one of Europe’s largest single units. Spain treated only 2.90 million tons in 13 plants and Portugal 0.98 million tons in four, small fleets for their population that leave room for new capacity.
Germany and Benelux hold the densest fleet of grate plants
Germany and Benelux held a 29.5% share of 2025 value and grows at 5.0% a year, the slowest pace because plants already handle nearly all residual waste. Germany treated 25.75 million tons in 92 plants in 2023, and the Netherlands treated 7.39 million tons in only 12 large plants. Carbon charges in both countries push gate fees higher but leave little room for new capacity, so growth comes mainly from heat sales and capture projects.
United Kingdom and Ireland grow fastest on new capacity
The United Kingdom and Ireland held an 18.2% share of 2025 value and grows fastest at 6.3% a year. The U.K. treated 16.12 million tons in 60 plants in 2023, yet landfill tax still makes new plants viable. Rivenhall opened in 2026, MVV began building its 625,000-ton Medworth plant in October 2025 for start-up in 2029, and Tees Valley follows in 2030. This pipeline lifts both gate fee and power revenue through 2030.
Nordics and Central/Eastern Europe pair heat networks with new plants
Nordics and Central/Eastern Europe held a 17.7% share of 2025 value and grows at 5.7% a year. Sweden treated 6.80 million tons in 37 plants in 2023, and Denmark treated 3.48 million tons in 23 plants in the same year. Poland, by contrast, had only eight plants treating 1.16 million tons, so new units such as Gdańsk, built with EU cohesion funding, add capacity where landfilling is still common. Nordic growth comes mostly from capture projects such as Oslo.
New plants, concessions and carbon rules mark 2025 and 2026
| Development | Status and market relevance |
|---|---|
| In March 2025, the Gdańsk energy recovery plant in Poland started full operation. | 160,000 tons a year, operated by Paprec Energies, EUWID reported |
| In October 2025, MVV started construction of the Medworth plant in eastern England. | 625,000 tons a year, start-up planned for 2029 |
| In January 2026, SUEZ won the operating contract for the Calce plant near Perpignan. | 12-year contract for a 240,000-ton plant |
| In April 2026, Viridor and seven councils reached financial close on the Tees Valley plant. | 450,000 tons a year, operation from 2030 |
| In July 2026, the European Commission proposed adding waste incineration to the EU ETS. | Phased coverage from 2031, full by 2034 |
Grate furnaces, flue gas cleaning and capture set costs
- Moving grate furnaces burn mixed residual waste with little pre-treatment and run around the clock as baseload units, so availability drives income.
- Flue gas cleaning systems remove acid gases, dust and dioxins to meet EU emission limits, and they make up a large share of plant capital cost.
- Combined heat and power cycles raise total energy efficiency by selling steam or hot water alongside power, which lifts income per ton.
- Post-combustion carbon capture uses amine solvents to separate CO2 from flue gas, which turns the biogenic share into potential carbon removal credits.
Need a Custom Version of This Report?
Tailor the scope, geography, or segments to your exact requirements.
- Custom geography or segment scope
- Direct access to our analyst team
Utility groups and infrastructure-backed operators compete
Competition in Europe’s plant market splits between utility groups, specialist operators and infrastructure-backed owners. Veolia and SUEZ compete for long municipal concessions in France, the U.K. and southern Europe, and SUEZ won the Calce contract in January 2026. EEW leads in Germany, while AVR and Indaver hold strong positions in the Netherlands and Belgium. In the U.K., Viridor, Encyclis, Cory and MVV compete for council contracts and merchant waste, while A2A leads Italy. Operators compete on gate fee, plant availability, heat offtake and their ability to finance carbon capture, and buyers increasingly ask for carbon pass-through terms. Large tenders in the Europe waste-to-energy market usually draw only a handful of credible bidders, because few groups can finance a plant of 400,000 tons a year or more. Municipal companies still own many plants in Germany, Scandinavia and Switzerland, so private operators compete there mainly for refurbishment work and merchant volumes.
How is plant supply organized, and where do margins sit?
Supply is split between municipal companies and a group of private operators that build, own or run plants under long contracts. Large groups such as Veolia, SUEZ, EEW and A2A each run many sites across one or more countries, while infrastructure funds back Viridor, Encyclis, Cory and AVR. Entry barriers are high, since permits take years and a large plant now costs from €500 million to €1 billion. Margins sit with owners that hold secure waste contracts and heat offtake, while engineering contractors earn a fixed construction margin and carry less long-term risk.
Which companies run energy recovery plants in Europe?
| Company | Type | Role in the market |
|---|---|---|
| Veolia | Integrated environmental services group | Builds and operates energy recovery plants and heat networks across Europe |
| SUEZ | Waste and water services group | Operates 34 energy recovery plants in France and joins Italian projects |
| EEW Energy from Waste | Specialist plant operator | Runs 17 energy recovery plants in Germany and neighboring countries |
| Viridor | Infrastructure-backed operator | Operates U.K. energy recovery facilities and is developing Tees Valley |
| Indaver | Specialist waste treatment operator | Runs energy recovery plants in Belgium, the Netherlands, Ireland and the U.K. |
| MVV Energie | Municipal utility group | Operates plants in Germany and the U.K. and is building Medworth |
| AVR | Specialist plant operator | Runs the Rozenburg and Duiven energy recovery sites in the Netherlands |
| Encyclis | Infrastructure-backed operator | Owns and runs U.K. plants including Rookery South and Protos |
| A2A | Multi-utility group | Operates Italian energy recovery plants linked to district heating networks |
| Cory Group | Infrastructure-backed operator | Runs Riverside plants in London and is developing carbon capture |
Plants with heat offtake and capture plans will gain
Credence Research’s view is that heat offtake and a credible capture plan, rather than gate fees alone, will decide which plant owners gain value to 2035. Carbon pricing will raise the cost of burning fossil plastics, and operators that cannot pass that cost on will see margins fall. Plants next to heat networks, industrial sites or CO2 users can spread fixed costs across more products. Investors should favor owners with long council contracts, indexation and carbon clauses, and treat merchant capacity in mature northern markets with more caution.
Plant throughput and gate fees anchor the estimate
The report uses 2025 as the base year and forecasts values to 2035. Market values come from the Credence Research model, and segment and regional splits are Credence Research estimates. The Europe waste-to-energy estimate was cross-checked against plant throughput published by CEWEP, gate fee surveys by WRAP, national carbon and waste tax schedules, biomethane output reported by the European Biogas Association and energy yields disclosed by plant operators. Company releases and official statistics supplied the dated events, and no interviews or surveys were conducted for this report.
Carbon pricing and heat networks carry value to 2035
Europe waste-to-energy revenue should rise from USD 22.64 billion in 2026 to USD 36.79 billion by 2035, with growth coming from carbon pass-through, heat sales and new capacity in the south and east rather than from more waste. Biomethane and Renewable Gas should grow at 7.8% a year as digestion plants inject more gas. The base case assumes that the EU phases in carbon coverage from 2031, that most U.K. and Italian projects open on schedule and that capture reaches the first large plants before 2030.
What separates the downside, base and upside paths to 2035?
The range of outcomes depends mainly on how carbon costs are shared and whether new plants in the south and east are built on time. A downside path follows if carbon charges cannot be passed on and councils switch volumes to recycling faster than expected. The base case assumes phased EU carbon pricing, steady heat sales and gradual delivery of the current pipeline. An upside path needs public support for capture and a faster build-out of heat networks.
| Scenario | CAGR, 2026–2035 | Value, 2035 | What has to hold |
|---|---|---|---|
| Downside | 3.9% | USD 32.06 billion | Carbon charges cannot be passed on and councils divert residual volumes to recycling faster |
| Base | 5.54% | USD 36.79 billion | EU carbon coverage phases in from 2031 and current U.K. and Italian projects open |
| Upside | 6.7% | USD 40.72 billion | Public support funds capture at large plants and heat networks expand quickly |
Frequently Asked Questions
How big is the Europe waste-to-energy market?
Which region leads the market?
Which region grows fastest?
Which technology holds the largest share?
How will EU carbon pricing affect plants?
What role does biomethane play in the market?
What is the biggest risk for plant operators?
Which companies are active in the market?
Table of Content
Chapter 1 Market Segmentation
- 1.1 Segmentation Framework
- 1.1.1 Product and Service Classification
- 1.1.2 Application and End-Use Classification
- 1.1.3 Technology and Solution Classification
- 1.1.4 Customer and Distribution Channel Classification
- 1.1.5 Geographic Segmentation
- 1.1.6 Market Segment Definitions and Boundaries
- 1.2 By Technology
- 1.2.1 Mass-Burn Incineration
- 1.2.2 Refuse-Derived Fuel Combustion
- 1.2.3 Gasification and Pyrolysis
- 1.2.4 Anaerobic Digestion
- 1.3 By Waste Type
- 1.3.1 Municipal Residual Waste
- 1.3.2 Commercial and Industrial Residual Waste
- 1.3.3 Refuse-Derived and Solid Recovered Fuel
- 1.3.4 Source-Separated Biowaste
- 1.4 By Energy Output
- 1.4.1 Electricity-Only
- 1.4.2 Combined Heat and Power
- 1.4.3 District Heat and Industrial Steam
- 1.4.4 Biomethane and Renewable Gas
- 1.5 By End User
- 1.5.1 Municipal Utilities
- 1.5.2 District Heating Operators
- 1.5.3 Industrial Offtakers
- 1.5.4 Electricity and Gas Networks
Chapter 2 Introduction
- 2.1 Report Objectives and Scope
- 2.2 Product Definition and Industry Terminology
- 2.3 Market Inclusions and Exclusions
- 2.4 Research Process
- 2.4.1 Primary Research and Expert Interviews
- 2.4.2 Secondary Research and Source Review
- 2.4.3 Top-Down and Bottom-Up Estimation
- 2.4.4 Data Triangulation and Verification
- 2.5 Market Size Measurement Basis
- 2.5.1 2025: USD 21.39 billion → 2035: USD 36.79 billion
- 2.6 Historical and Forecast Reference Periods
- 2.6.1 Historical Period: 2018-2025
- 2.6.2 Base Year: 2025
- 2.6.3 Forecast Period: 2025-2035
- 2.7 Research Assumptions and Limitations
Chapter 3 Executive Summary
- 3.1 Market Snapshot and Key Findings
- 3.2 Base-Year Market Size, 2025
- 3.3 Forecast Market Size, 2035
- 3.4 Revenue and Volume Growth Outlook
- 3.5 Key Demand and Supply Indicators
- 3.6 Leading Market Segments
- 3.7 Fastest-Growing Market Opportunities
- 3.8 Regional Performance Highlights
- 3.9 Technology and Industry Transformation
- 3.10 Competitive Landscape Summary
- 3.11 Analyst View and Strategic Implications
Chapter 4 Europe Waste-to-Energy Market Trends and Developments
- 4.1 Historical Industry Development, 2018-2025
- 4.2 Recent Market Trends and Developments
- 4.3 Demand and Customer Behavior Trends
- 4.4 Technology and Product Innovation
- 4.5 Artificial Intelligence, Automation and Digitalization
- 4.6 Local Manufacturing and Supply Chain Realignment
- 4.7 Industry Partnerships, Mergers and Acquisitions
- 4.8 Sustainability and Circular Economy Developments
- 4.9 Government and Private Sector Investment Trends
- 4.10 Emerging Business Models and Commercialization
- 4.11 Industry Developments and Announcements
Chapter 5 Europe Waste-to-Energy Market Production, Supply and Demand Analysis
- 5.1 Demand Trend and Consumption Analysis, 2018-2025
- 5.2 Demand Forecast, 2025-2035
- 5.3 Production and Output Trend, 2018-2025
- 5.4 Production and Output Forecast, 2025-2035
- 5.5 Installed Capacity and Capacity Utilization
- 5.6 Company-Wise Production Plants and Statistics
- 5.6.1 Installed Production Capacity
- 5.6.2 Actual Production
- 5.6.3 Planned Capacity and Expansion Targets
- 5.7 Supply Chain Structure and Procurement Trends
- 5.8 Supply-Demand Gap and Bottlenecks
- 5.9 Import Dependence and Sourcing Structure
- 5.10 Contract Manufacturing and Outsourcing
- 5.11 Regional Supply and Demand Concentration
Chapter 6 Europe Waste-to-Energy Market Pricing Analysis
- 6.1 Pricing Structure and Measurement
- 6.2 Historical Pricing Trends, 2018-2025
- 6.3 Pricing Outlook, 2025-2035
- 6.4 Average Selling Price and Unit Economics
- 6.5 Pricing by Product and Market Segment
- 6.6 Geographic Pricing Differences
- 6.7 Key Input, Energy, Labor and Logistics Costs
- 6.8 Contract Pricing and Purchasing Models
- 6.9 Pricing Sensitivity and Competitive Positioning
- 6.10 Price, Margin and Profitability Implications
Chapter 7 Europe Waste-to-Energy Market Dynamics
- 7.1 Market Growth Drivers
- 7.1.1 Demand-Side Drivers
- 7.1.2 Technology and Innovation Drivers
- 7.1.3 Infrastructure and Investment Drivers
- 7.1.4 Regulatory and Policy Drivers
- 7.2 Market Restraints
- 7.2.1 Cost and Affordability Constraints
- 7.2.2 Technology and Adoption Barriers
- 7.2.3 Supply Chain and Operational Constraints
- 7.3 Market Challenges
- 7.3.1 Competitive Pressure and Margin Erosion
- 7.3.2 Skills, Infrastructure and Implementation Gaps
- 7.4 Emerging Market Opportunities
- 7.5 Market Dynamics Impact and Time-Horizon Assessment
Chapter 8 Europe Waste-to-Energy Value Chain Analysis
- 8.1 Industry Value Chain Overview
- 8.2 Upstream Suppliers and Critical Inputs
- 8.3 Technology and Component Providers
- 8.4 Manufacturing or Service Delivery
- 8.5 Distribution, Channel Partners and Integrators
- 8.6 Downstream Applications and End Users
- 8.7 Value Addition and Profit Pools
- 8.8 Vertical Integration and Outsourcing
- 8.9 Supplier Concentration and Risk
- 8.10 Supply Chain Localization and Resilience
Chapter 9 Europe Waste-to-Energy Market Regulations and Policies
- 9.1 Relevant Laws, Standards and Compliance Frameworks
- 9.2 Product, Service, Safety and Quality Requirements
- 9.3 Government Policies, Incentives and Subsidies
- 9.4 Imports, Exports and Trade Barriers
- 9.5 Public Procurement and Local Content Requirements
- 9.6 Environmental and Sustainability Compliance
- 9.7 Upcoming Policy Changes and Market Implications
Chapter 10 Europe Waste-to-Energy Market Hotspots and Opportunities
- 10.1 Market Opportunity Mapping and Growth Hotspots
- 10.2 High-Growth Applications and Customer Groups
- 10.3 Underserved Markets and White-Space Opportunities
- 10.4 Emerging Technology and Product Opportunities
- 10.5 New Capacity and Investment Hotspots
- 10.6 Market Entry and Expansion Opportunities
- 10.7 Distribution and Partnership Opportunities
- 10.8 Near-Term and Long-Term Commercial Potential
- 10.9 Opportunity Attractiveness and Execution Risks
Chapter 11 Europe Waste-to-Energy Market Outlook, 2025-2035
- 11.1 Market Size and Analysis
- 11.1.1 Revenue (Market Measurement: 2025: USD 21.39 billion → 2035: USD 36.79 billion)
- 11.1.2 Market Volume and Quantity Sold
- 11.1.3 Historical Market Size, 2018-2025
- 11.1.4 Base-Year Market Size, 2025
- 11.2 Market Forecast, 2025-2035
- 11.2.1 Revenue Forecast to 2035
- 11.2.2 Volume Forecast to 2035
- 11.2.3 CAGR and Year-on-Year Growth
- 11.2.4 Incremental Revenue Opportunity
- 11.3 Forecast Assumptions and Scenario Analysis
- 11.3.1 Base-Case Forecast
- 11.3.2 Optimistic and Conservative Scenarios
- 11.3.3 Technology, Pricing and Policy Sensitivities
- 11.4 Market Attractiveness and Growth Outlook
Chapter 12 Europe Waste-to-Energy Market Segmentation and Outlook
- 12.1 Segmentation Summary and Market Shares, 2025
- 12.2 Largest and Fastest-Growing Segments
- 12.3 By Technology - Market Size and Forecast, 2025-2035
- 12.3.1 Segment Definition and Scope
- 12.3.2 Historical Market Size, 2018-2025
- 12.3.3 Revenue Forecast, 2025-2035
- 12.3.4 Volume Forecast, 2025-2035
- 12.3.5 Base-Year Market Share, 2025
- 12.3.6 Segment CAGR and Growth Drivers
- 12.3.7 Subsegment Market Size and Forecast
- 12.3.7.1 Mass-Burn Incineration
- 12.3.7.2 Refuse-Derived Fuel Combustion
- 12.3.7.3 Gasification and Pyrolysis
- 12.3.7.4 Anaerobic Digestion
- 12.3.8 Subsegment Pricing and Adoption Trends
- 12.3.9 Leading Suppliers and Competition
- 12.3.10 Regional Demand and Opportunities
- 12.4 By Waste Type - Market Size and Forecast, 2025-2035
- 12.4.1 Segment Definition and Scope
- 12.4.2 Historical Market Size, 2018-2025
- 12.4.3 Revenue Forecast, 2025-2035
- 12.4.4 Volume Forecast, 2025-2035
- 12.4.5 Base-Year Market Share, 2025
- 12.4.6 Segment CAGR and Growth Drivers
- 12.4.7 Subsegment Market Size and Forecast
- 12.4.7.1 Municipal Residual Waste
- 12.4.7.2 Commercial and Industrial Residual Waste
- 12.4.7.3 Refuse-Derived and Solid Recovered Fuel
- 12.4.7.4 Source-Separated Biowaste
- 12.4.8 Subsegment Pricing and Adoption Trends
- 12.4.9 Leading Suppliers and Competition
- 12.4.10 Regional Demand and Opportunities
- 12.5 By Energy Output - Market Size and Forecast, 2025-2035
- 12.5.1 Segment Definition and Scope
- 12.5.2 Historical Market Size, 2018-2025
- 12.5.3 Revenue Forecast, 2025-2035
- 12.5.4 Volume Forecast, 2025-2035
- 12.5.5 Base-Year Market Share, 2025
- 12.5.6 Segment CAGR and Growth Drivers
- 12.5.7 Subsegment Market Size and Forecast
- 12.5.7.1 Electricity-Only
- 12.5.7.2 Combined Heat and Power
- 12.5.7.3 District Heat and Industrial Steam
- 12.5.7.4 Biomethane and Renewable Gas
- 12.5.8 Subsegment Pricing and Adoption Trends
- 12.5.9 Leading Suppliers and Competition
- 12.5.10 Regional Demand and Opportunities
- 12.6 By End User - Market Size and Forecast, 2025-2035
- 12.6.1 Segment Definition and Scope
- 12.6.2 Historical Market Size, 2018-2025
- 12.6.3 Revenue Forecast, 2025-2035
- 12.6.4 Volume Forecast, 2025-2035
- 12.6.5 Base-Year Market Share, 2025
- 12.6.6 Segment CAGR and Growth Drivers
- 12.6.7 Subsegment Market Size and Forecast
- 12.6.7.1 Municipal Utilities
- 12.6.7.2 District Heating Operators
- 12.6.7.3 Industrial Offtakers
- 12.6.7.4 Electricity and Gas Networks
- 12.6.8 Subsegment Pricing and Adoption Trends
- 12.6.9 Leading Suppliers and Competition
- 12.6.10 Regional Demand and Opportunities
- 12.7 Segment Growth Comparison
- 12.8 Segment Attractiveness and Priority Matrix
Chapter 13 Europe Waste-to-Energy End-Use and Application Market Outlook
- 13.1 End-Use Industry and Customer Demand Structure
- 13.2 Leading Applications and Customer Groups
- 13.3 End-Use Market Size, Share and Forecast
- 13.4 Major End-Use Industry Deep Dives
- 13.4.1 Customer Requirements and Use Cases
- 13.4.2 Demand and Replacement Cycles
- 13.4.3 Technical and Regulatory Considerations
- 13.4.4 Purchasing and Procurement Models
- 13.4.5 Leading Vendors and Distribution Channels
- 13.4.6 Forecast and Commercial Opportunities
- 13.5 Emerging Applications and Cross-Segment Demand
- 13.6 End-Use Industry Investment Priorities
Chapter 14 Europe Waste-to-Energy Geographic Market Outlook, 2025-2035
- 14.1 Regional Market Size and Country-Level Shares, 2025
- 14.2 Country Market Size Comparison, 2025
- 14.3 Country Market Forecasts, 2025-2035
- 14.4 Subregional Industrial and Demand Clusters
- 14.5 Intra-Regional Pricing and Cost Differences
- 14.6 Cross-Border Trade and Supply Networks
- 14.7 Regional Supply and Demand Balances
- 14.8 Country Opportunity Comparison and Prioritization
Note: Every listed country is covered on the structure shown under the first country.
Chapter 15 Europe Waste-to-Energy Technology, Innovation and Sustainability Outlook
- 15.1 Technology Landscape and Maturity
- 15.2 Product, Process and Service Innovation
- 15.3 AI, Automation and Digital Tools in the Industry
- 15.4 Technology Adoption and Performance Benchmarking
- 15.5 Innovation Pipeline and R&D Investment
- 15.6 Patent and Intellectual Property Trends
- 15.7 Energy Efficiency and Resource Management
- 15.8 Sustainability, Recycling and Circularity
- 15.9 Technology Roadmap, 2025-2035
- 15.10 Risks of Obsolescence and Technology Substitution
Chapter 16 Europe Waste-to-Energy Market Key Strategic Imperatives
- 16.1 Growth and Market Entry Priorities
- 16.2 High-Return Products and Segments
- 16.3 Pricing, Profitability and Cost Optimization
- 16.4 Technology Investment and Product Differentiation
- 16.5 Supply Chain Localization and Resilience
- 16.6 Distribution and Customer Acquisition
- 16.7 Partnership, Acquisition and Capacity Strategy
- 16.8 Regional Expansion Priorities
- 16.9 Short-, Medium- and Long-Term Actions
Chapter 17 Competition Outlook
- 17.1 Industry Competition Characteristics
- 17.2 Market Structure and Concentration
- 17.3 Market Share and Competitive Positioning, 2025
- 17.4 Company-Wise Revenue and Product Benchmarking
- 17.5 Production and Service Capacity Benchmarking
- 17.6 Technology, Pricing and Differentiation
- 17.7 Regional Footprint and Distribution Strength
- 17.8 Mergers, Acquisitions and Strategic Alliances
- 17.9 New Entrants and Competitive Threats
- 17.10 Porter's Five Forces and Industry Attractiveness
- 17.11 Competitive Outlook, 2025-2035
Chapter 18 Company Profiles
- 18.1 Company Coverage and Selection Criteria
- 18.2 Veolia
- 18.2.1 Business Description
- 18.2.2 Company Ownership and Geographic Presence
- 18.2.3 Product and Service Portfolio
- 18.2.4 Manufacturing and Operating Footprint
- 18.2.5 Production Capacity and Expansion Plans
- 18.2.6 Financial Performance and Investment
- 18.2.7 Market Share and Competitive Position
- 18.2.8 Technology and Innovation Capabilities
- 18.2.9 Strategic Alliances or Partnerships
- 18.2.10 Recent Developments
- 18.2.11 Growth Strategy and Outlook
- 18.3 SUEZ
- 18.4 EEW Energy from Waste
- 18.5 Viridor
- 18.6 Indaver
- 18.7 MVV Energie
- 18.8 AVR
- 18.9 Encyclis
- 18.10 A2A
- 18.11 Cory Group
- 18.12 Other Relevant Market Participants
Note: Every listed company is profiled on the structure shown under the first company. The company list is preliminary and may change based on research findings, market developments, data availability and client requirements.
Chapter 19 Disclaimer
- 19.1 Research and Forecast Disclaimer
- 19.2 Data Source and Estimation Limitations
Note: The depth of individual sections depends on data availability for this market. Volume, capacity, trade and other unit-based metrics are included where applicable.