Palm effluent drives Indonesia biogas toward gas sales
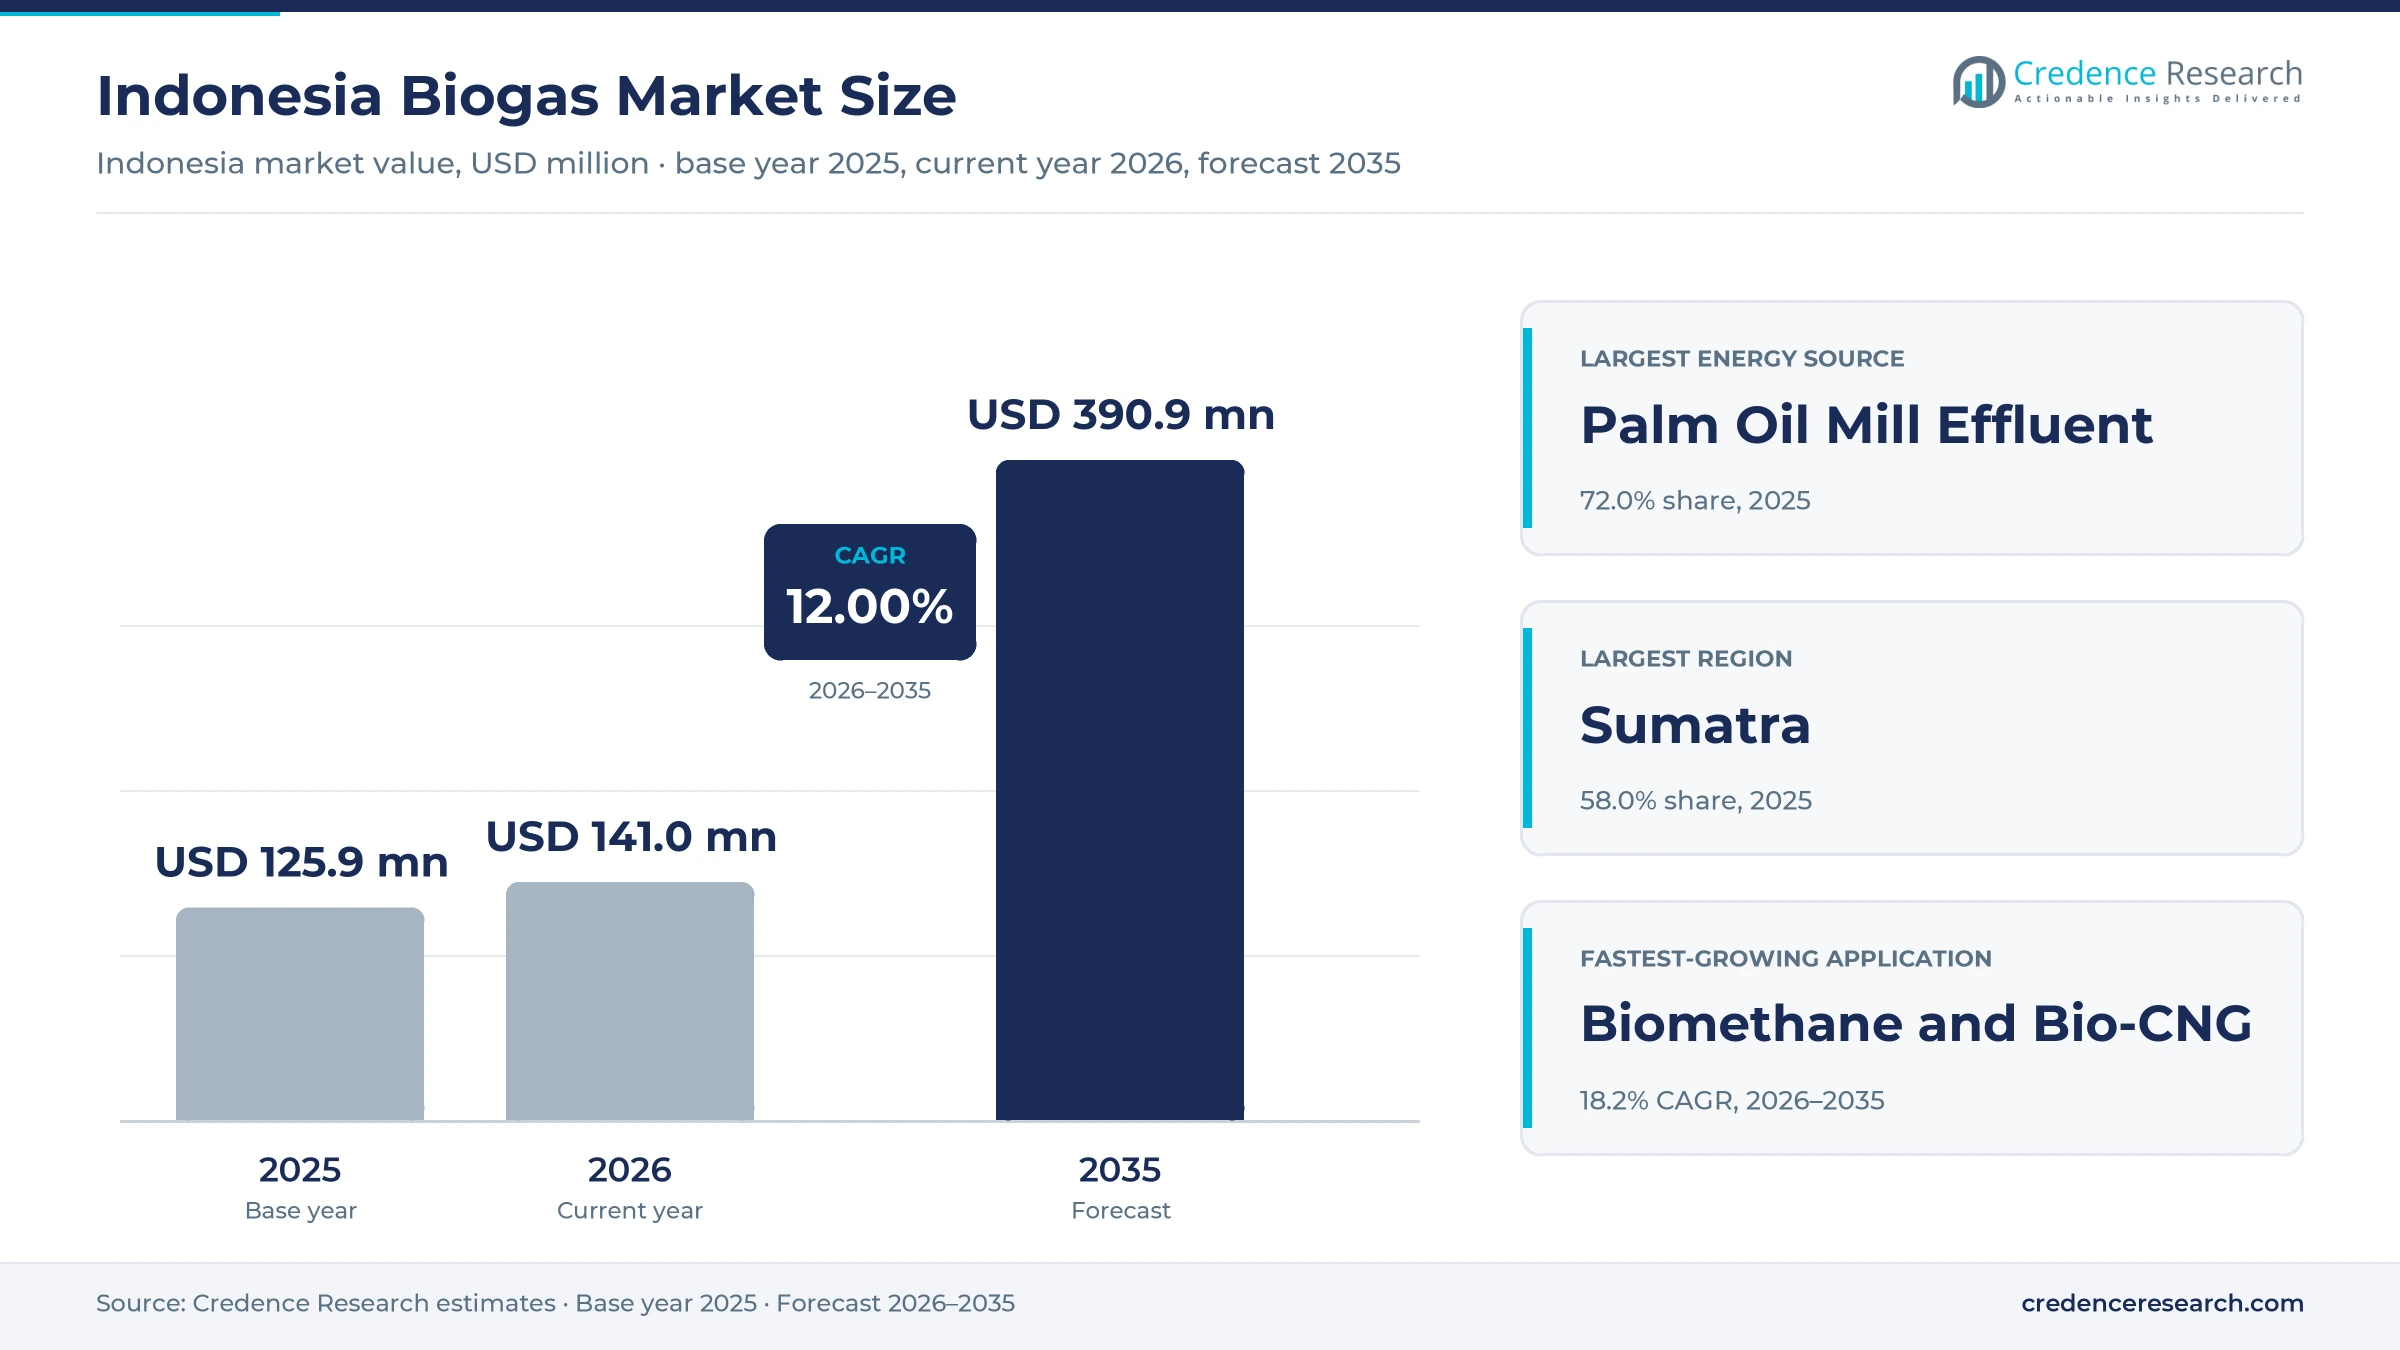
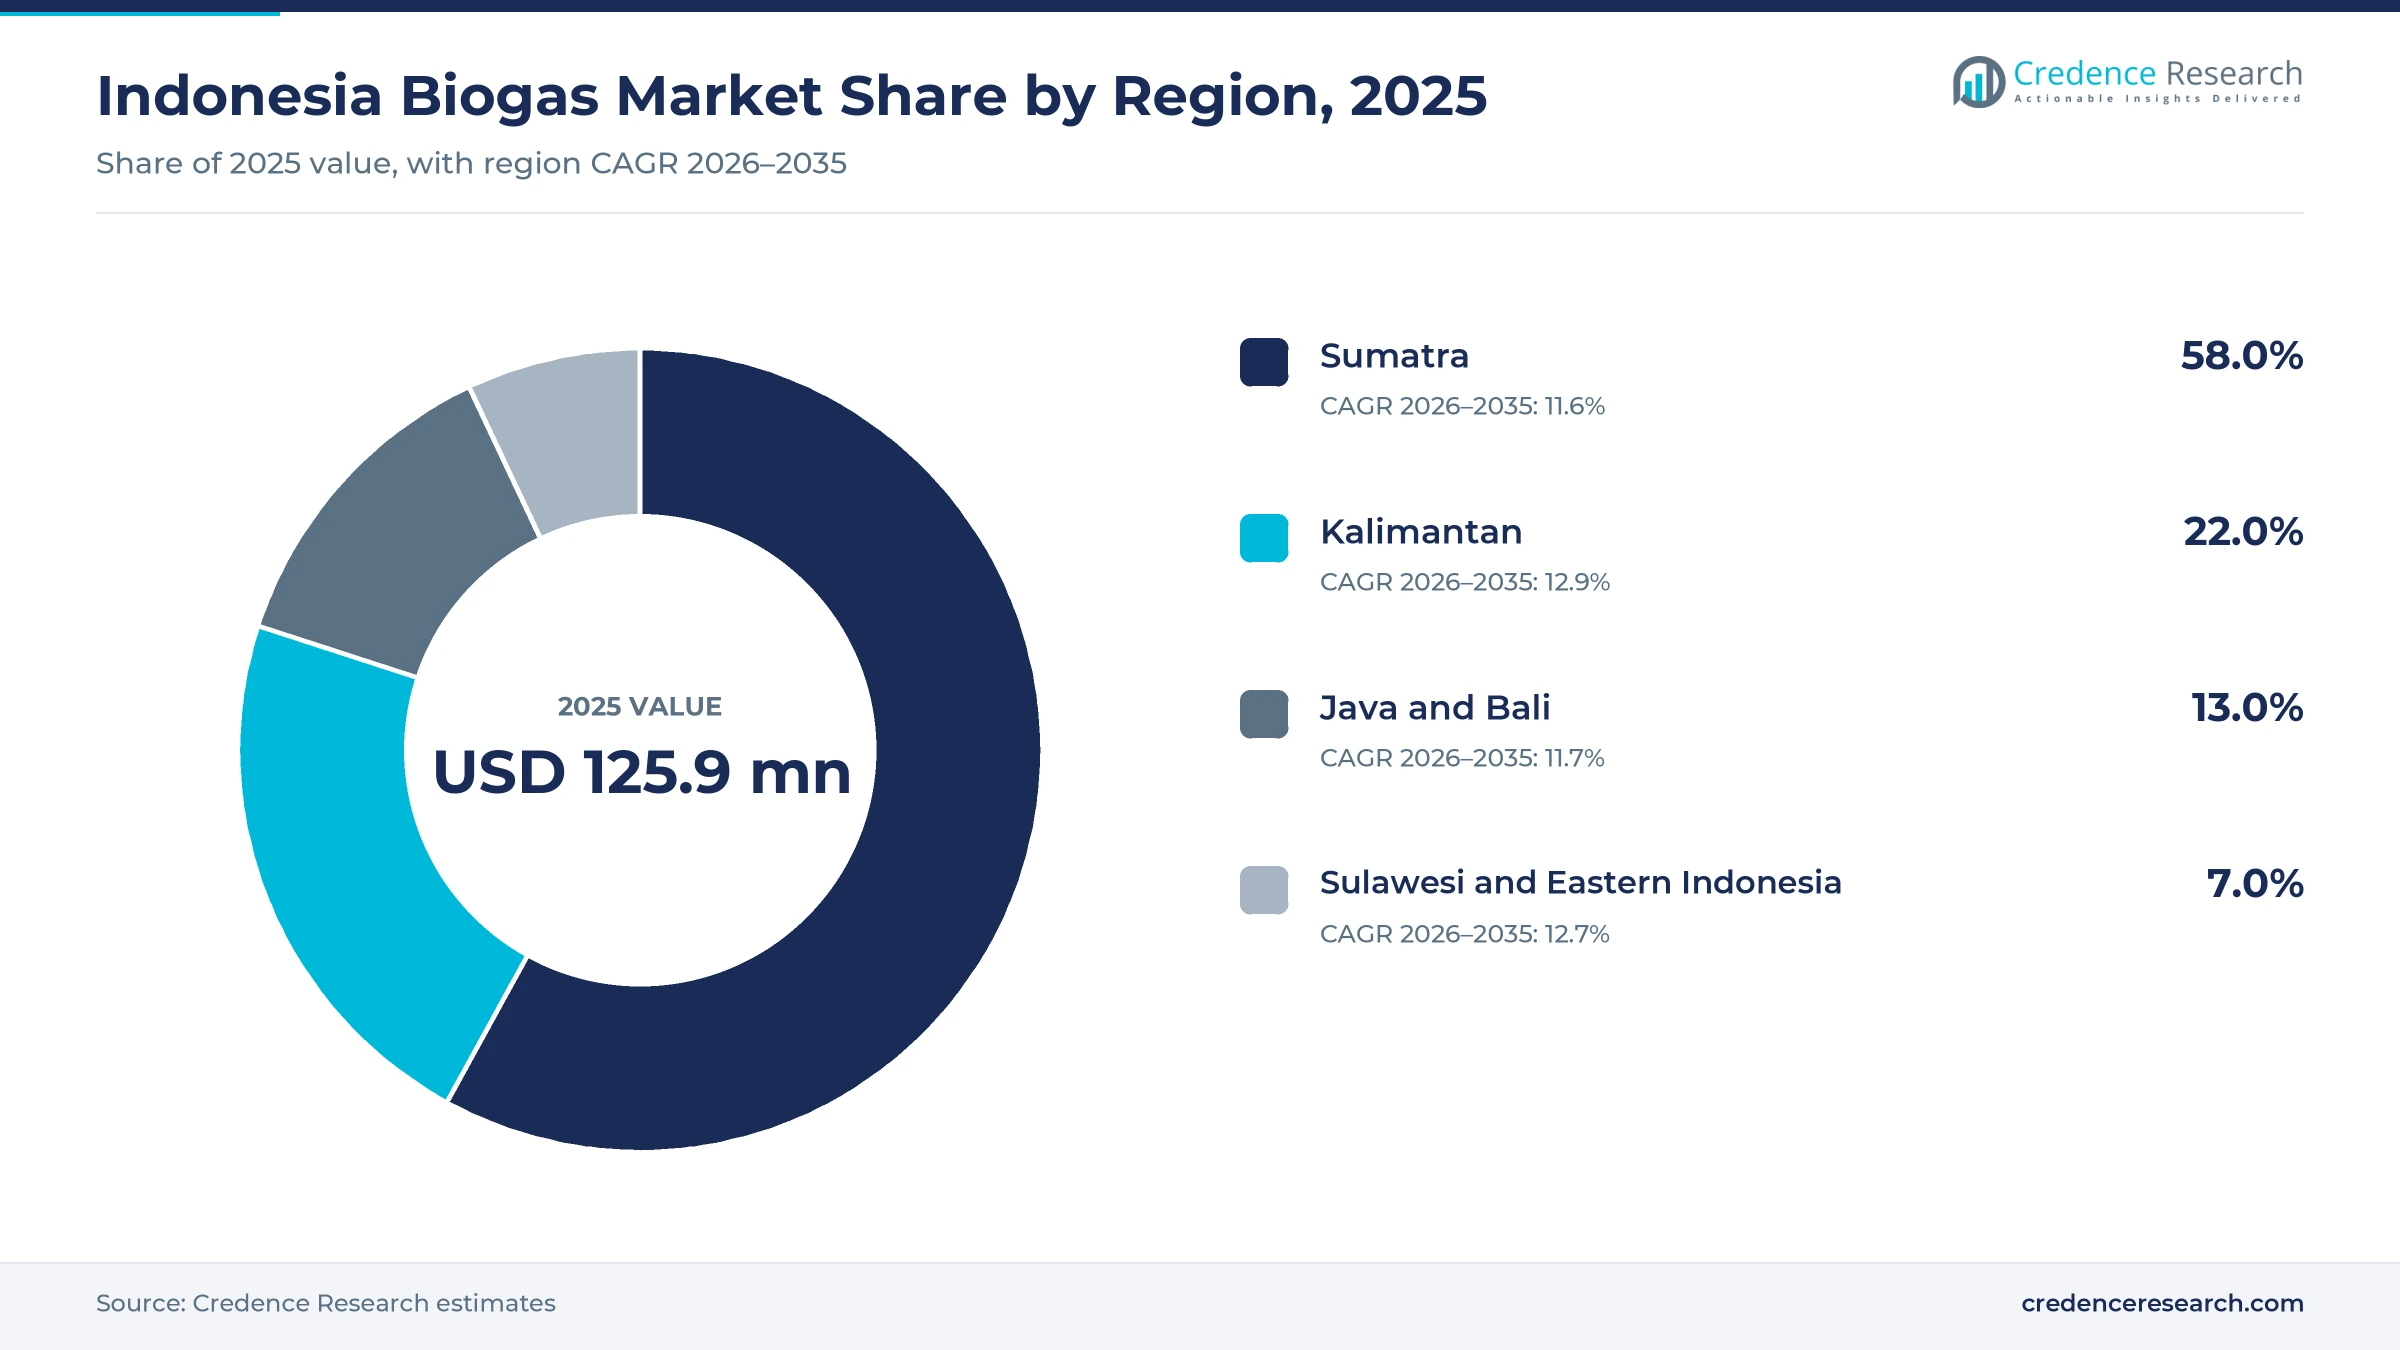
The Indonesia biogas market was valued at USD 125.9 million in 2025 and is projected to increase from USD 141.0 million in 2026 to USD 390.9 million by 2035, registering a CAGR of 12.00% during 2026–2035. Demand rests on palm oil mill effluent, which mills treat in covered lagoons and increasingly turn into electricity or compressed biomethane for their own use and for outside gas buyers. Sumatra held the largest regional share, 58.0% in 2025, because most mills, grid-connected biogas plants and the first bio-CNG plants sit in North Sumatra and Riau. Kalimantan is the fastest-growing region at 12.9% a year, as large estates there add methane capture later than Sumatran groups did. Electricity generation remains the main use, while biomethane and bio-CNG grow fastest from a small base. The main commercial change is the move to gas offtake, with state gas distributors and consumer-goods makers signing multiyear contracts for compressed biomethane since 2025.
From mill lagoon to gas engine and compressed cylinder
The market counts the value of biogas and biomethane produced in Indonesia, measured as electricity and gas sold or used on site at grid or fuel-equivalent prices, plus spending on new digesters, gas cleaning, engines and compression installed in the year. It covers palm oil mill effluent, tapioca and starch wastewater, livestock manure and food and municipal organic waste, whether the gas feeds a mill boiler, a gas engine, a household stove or a compressed gas trailer.
Landfill gas flared without energy recovery, solid biomass such as empty fruit bunches and palm kernel shells, and liquid biofuels such as biodiesel are outside the scope. The value chain runs from feedstock owners and digester builders through gas cleaning and upgrading, power conversion and compression, to buyers that include PLN, gas distributors, industrial users and rural households.
Indonesia Biogas Market Insights
- The Indonesia biogas market grows from USD 125.9 million in 2025 to USD 390.9 million by 2035 at a 12.00% CAGR, as mills move captured methane into power and compressed gas sales.
- Sumatra held the largest regional share at 58.0% in 2025, while Kalimantan grows fastest at 12.9% a year as large estates add methane capture.
- Palm oil mill effluent led energy sources with 72.0% of 2025 value, while biomethane and bio-CNG grow fastest among applications at 18.2% a year.
- On Aug. 20, 2026, reNIKOLA Holdings and Pertagas Niaga signed a long-term deal for compressed biomethane gathered from eight palm oil mills.
- PLN had only 27 MW of its 313 MW bioenergy quota in commercial operation in September 2024, so developers that secure gas offtake gain an edge.
Mill effluent leads value as bio-CNG grows fastest
Palm oil mill effluent supplied 72.0% of Indonesian biogas value in 2025, the largest share of any feedstock by a wide margin. Energy source, application, end user and project scale show where value sits today and which parts gain share to 2035.
Palm effluent leads as food and municipal waste grows fastest
Based on energy source, the market is categorized into palm oil mill effluent, tapioca and starch wastewater, livestock manure and food and municipal organic waste. Palm Oil Mill Effluent led with 72.0% of 2025 value because mill effluent is the steadiest high-strength wastewater, and the Energy and Mineral Resources Ministry counted 136.8 MW of biogas power from this feedstock in July 2023. Food and Municipal Organic Waste grows fastest at 13.8% a year as cities look for outlets for organic waste, and national waste data (SIPSN) put food leftovers at 39.36% of the 33.79 million tons recorded in 2024. Manure gains less because its digesters remain small and scattered across farms.
Power generation leads while bio-CNG grows fastest
Based on application, the market is categorized into electricity generation, industrial boiler fuel, biomethane and bio-CNG, and cooking and community energy. Electricity Generation led with 62.0% of 2025 value because most mills burn captured methane in engines for their own operations, and Musim Mas says it has exported surplus electricity to the national grid since 2014. Biomethane and Bio-CNG grows fastest at 18.2% a year as gas buyers sign offtake deals, and in February 2026 PGN subsidiary Gagas Energi agreed to take about 142,450 MMBtu a year from a KIS Group plant in Kampar, Riau. Boiler use grows more slowly because it adds no new revenue stream for the mill.
Palm mills lead as food and beverage processors grow fastest
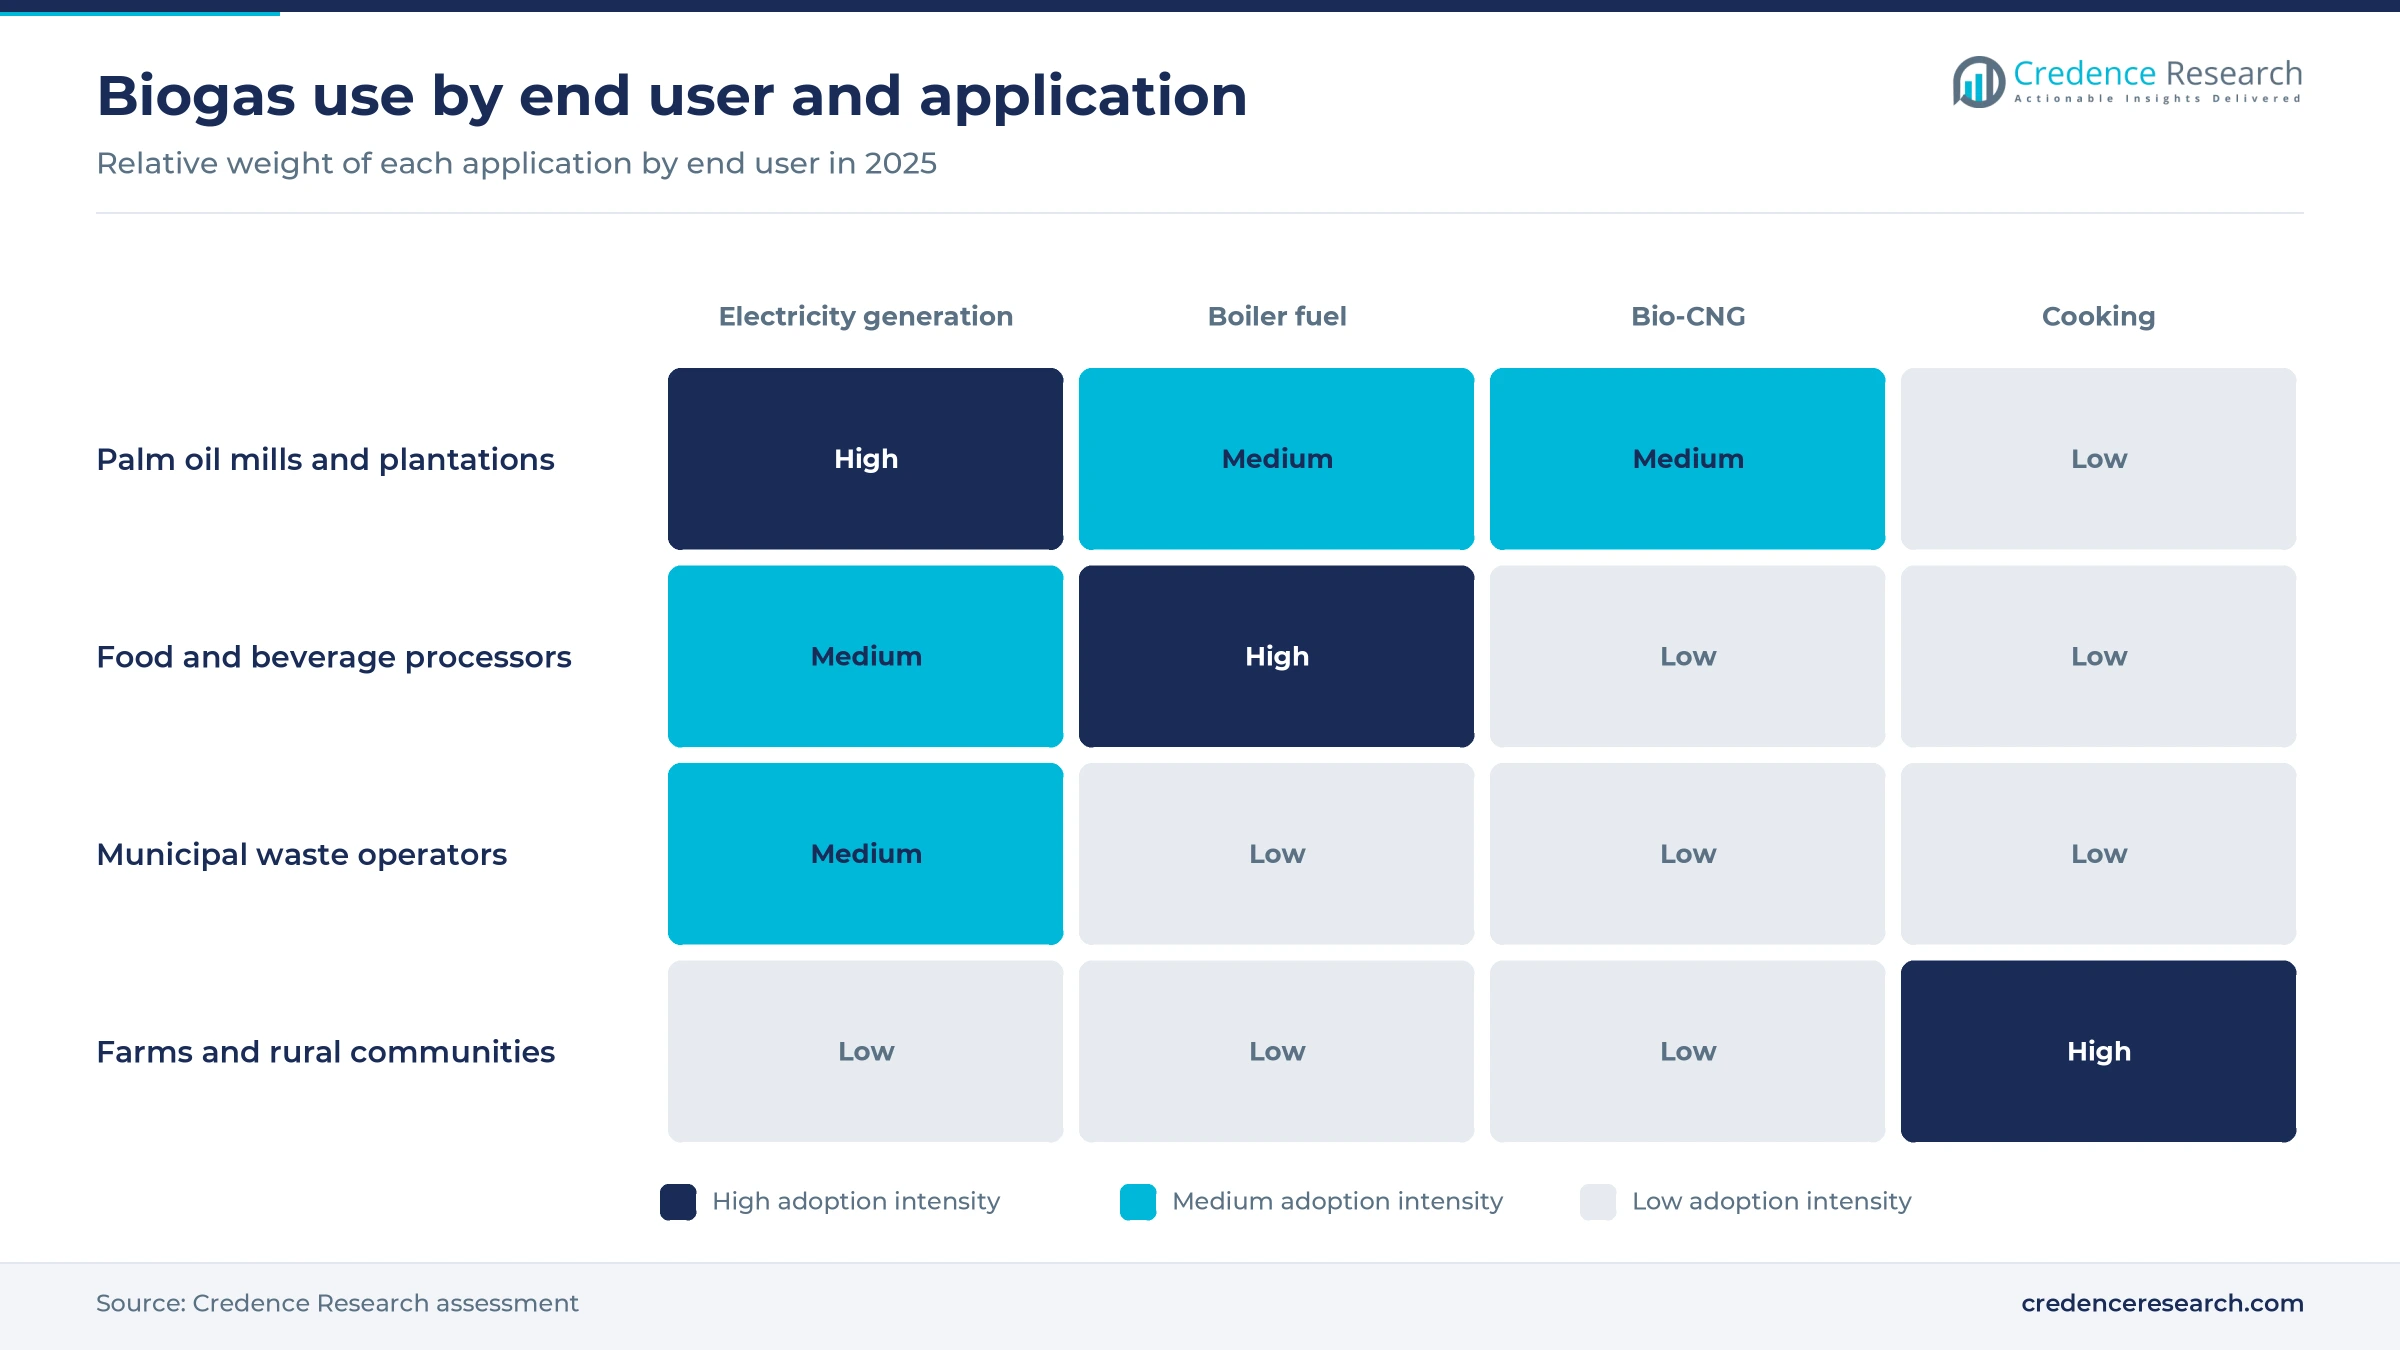
Based on end user, the market is categorized into palm oil mills and plantations, food and beverage processors, municipal waste operators and farms and rural communities. Palm Oil Mills and Plantations led with 70.0% of 2025 value because large groups have equipped mill after mill, and First Resources reported 15 methane capture facilities in 2025. Food and Beverage Processors grow fastest at 13.4% a year as starch and food plants treat wastewater for energy, and the Energy Ministry put the annual biogas potential of tapioca waste at 266 million cubic meters, Katadata reported in 2023. Farms gain least because household digesters depend on grants and carbon finance.
On-site mill systems lead as clustered plants grow fastest
Based on project scale, the market is categorized into small decentralized digesters, village and cooperative systems, industrial on-site systems and large clustered biomethane plants. Industrial On-site Systems led with 79.0% of 2025 value because each mill runs its own lagoon and engine, and Asian Agri said in April 2025 that it had built 11 biogas plants at its mills. Large Clustered Biomethane Plants grow fastest at 20.9% a year as developers pool effluent from several mills, and reNIKOLA has set a goal of 50 compressed biogas projects in Indonesia with more than USD 300 million over five years, starting with four PTPN IV mills under a June 2023 agreement.
| Segment Group | Leading Sub-segment | Share, 2025 | Fastest-growing Sub-segment | CAGR, 2026–2035 |
|---|---|---|---|---|
| By Energy Source | Palm Oil Mill Effluent | 72.0% | Food and Municipal Organic Waste | 13.8% |
| By Application | Electricity Generation | 62.0% | Biomethane and Bio-CNG | 18.2% |
| By End User | Palm Oil Mills and Plantations | 70.0% | Food and Beverage Processors | 13.4% |
| By Project Scale | Industrial On-site Systems | 79.0% | Large Clustered Biomethane Plants | 20.9% |
Feed-in ceilings and gas benchmarks set what biogas earns
Biogas earns its value in two ways, as electricity sold to PLN under a capped tariff or as gas priced against the fuel it replaces. For power, Presidential Regulation 112 of 2022 sets ceiling prices that fall as plant size rises and are multiplied by a location factor, so small plants on remote grids earn the most per kilowatt-hour. For gas, compressed biomethane competes with pipeline gas and diesel, and the Indonesian CNG Companies Association put the delivered cost of compressed gas at about USD 10 to 13 per MMBtu in July 2021. Developers therefore favor gas sales where pipeline gas is absent and diesel sets the reference price.
| Item or tier | Typical price or fee | Basis |
|---|---|---|
| Biogas power up to 1 MW, years 1 to 10 | 10.18 U.S. cents per kWh times location factor | Presidential Regulation 112 of 2022 |
| Biogas power above 10 MW, years 1 to 10 | 7.44 U.S. cents per kWh times location factor | Presidential Regulation 112 of 2022 |
| PLN purchase from the 2 MW Pasir Mandoge plant | Rp1,018 per kWh, 2021 | IDX Channel, August 2021 |
| Industrial pipeline gas under HGBT, fuel use | USD 7 per MMBtu, 2025 | Energy and Mineral Resources Ministry, February 2025 |
| Compressed gas, delivered cost | USD 10 to 13 per MMBtu | Indonesian CNG Companies Association, July 2021 |
| Portable household digester, 0.5 cubic meters | Rp1.8 million per unit, 2023 | Kontan, December 2023 |
| Community digester serving 15 households, Jakarta | Rp25 million per unit, 2023 | Kontan, December 2023 |
Request a Free Sample
Fill in your details and we'll send you a free sample report.
- Sample data tables & charts
- Research methodology
Mill economics, bio-CNG deals and power plans lift demand
POME volumes and captive energy savings anchor demand
Palm oil mills produce more effluent than any other organic waste stream in the country, and treating it for energy cuts both methane and fuel bills. Mills generate about 125 million tons of effluent a year, InvestorTrust estimates, and the Palm Oil Agribusiness Strategic Policy Institute's yield of about 28.8 cubic meters per ton puts the biogas potential near 3.6 billion cubic meters, of which only about 15% is used for energy. Dharma Satya Nusantara said in September 2024 that its bio-CNG program replaced about 5.2 million liters of fossil fuel between 2021 and 2023 and that it plans to double capacity. Because a mill owns both the feedstock and the energy demand, each new digester pays back through avoided diesel, which keeps captive projects moving even when grid contracts stall.
Biomethane and bio-CNG move from pilots to contracts
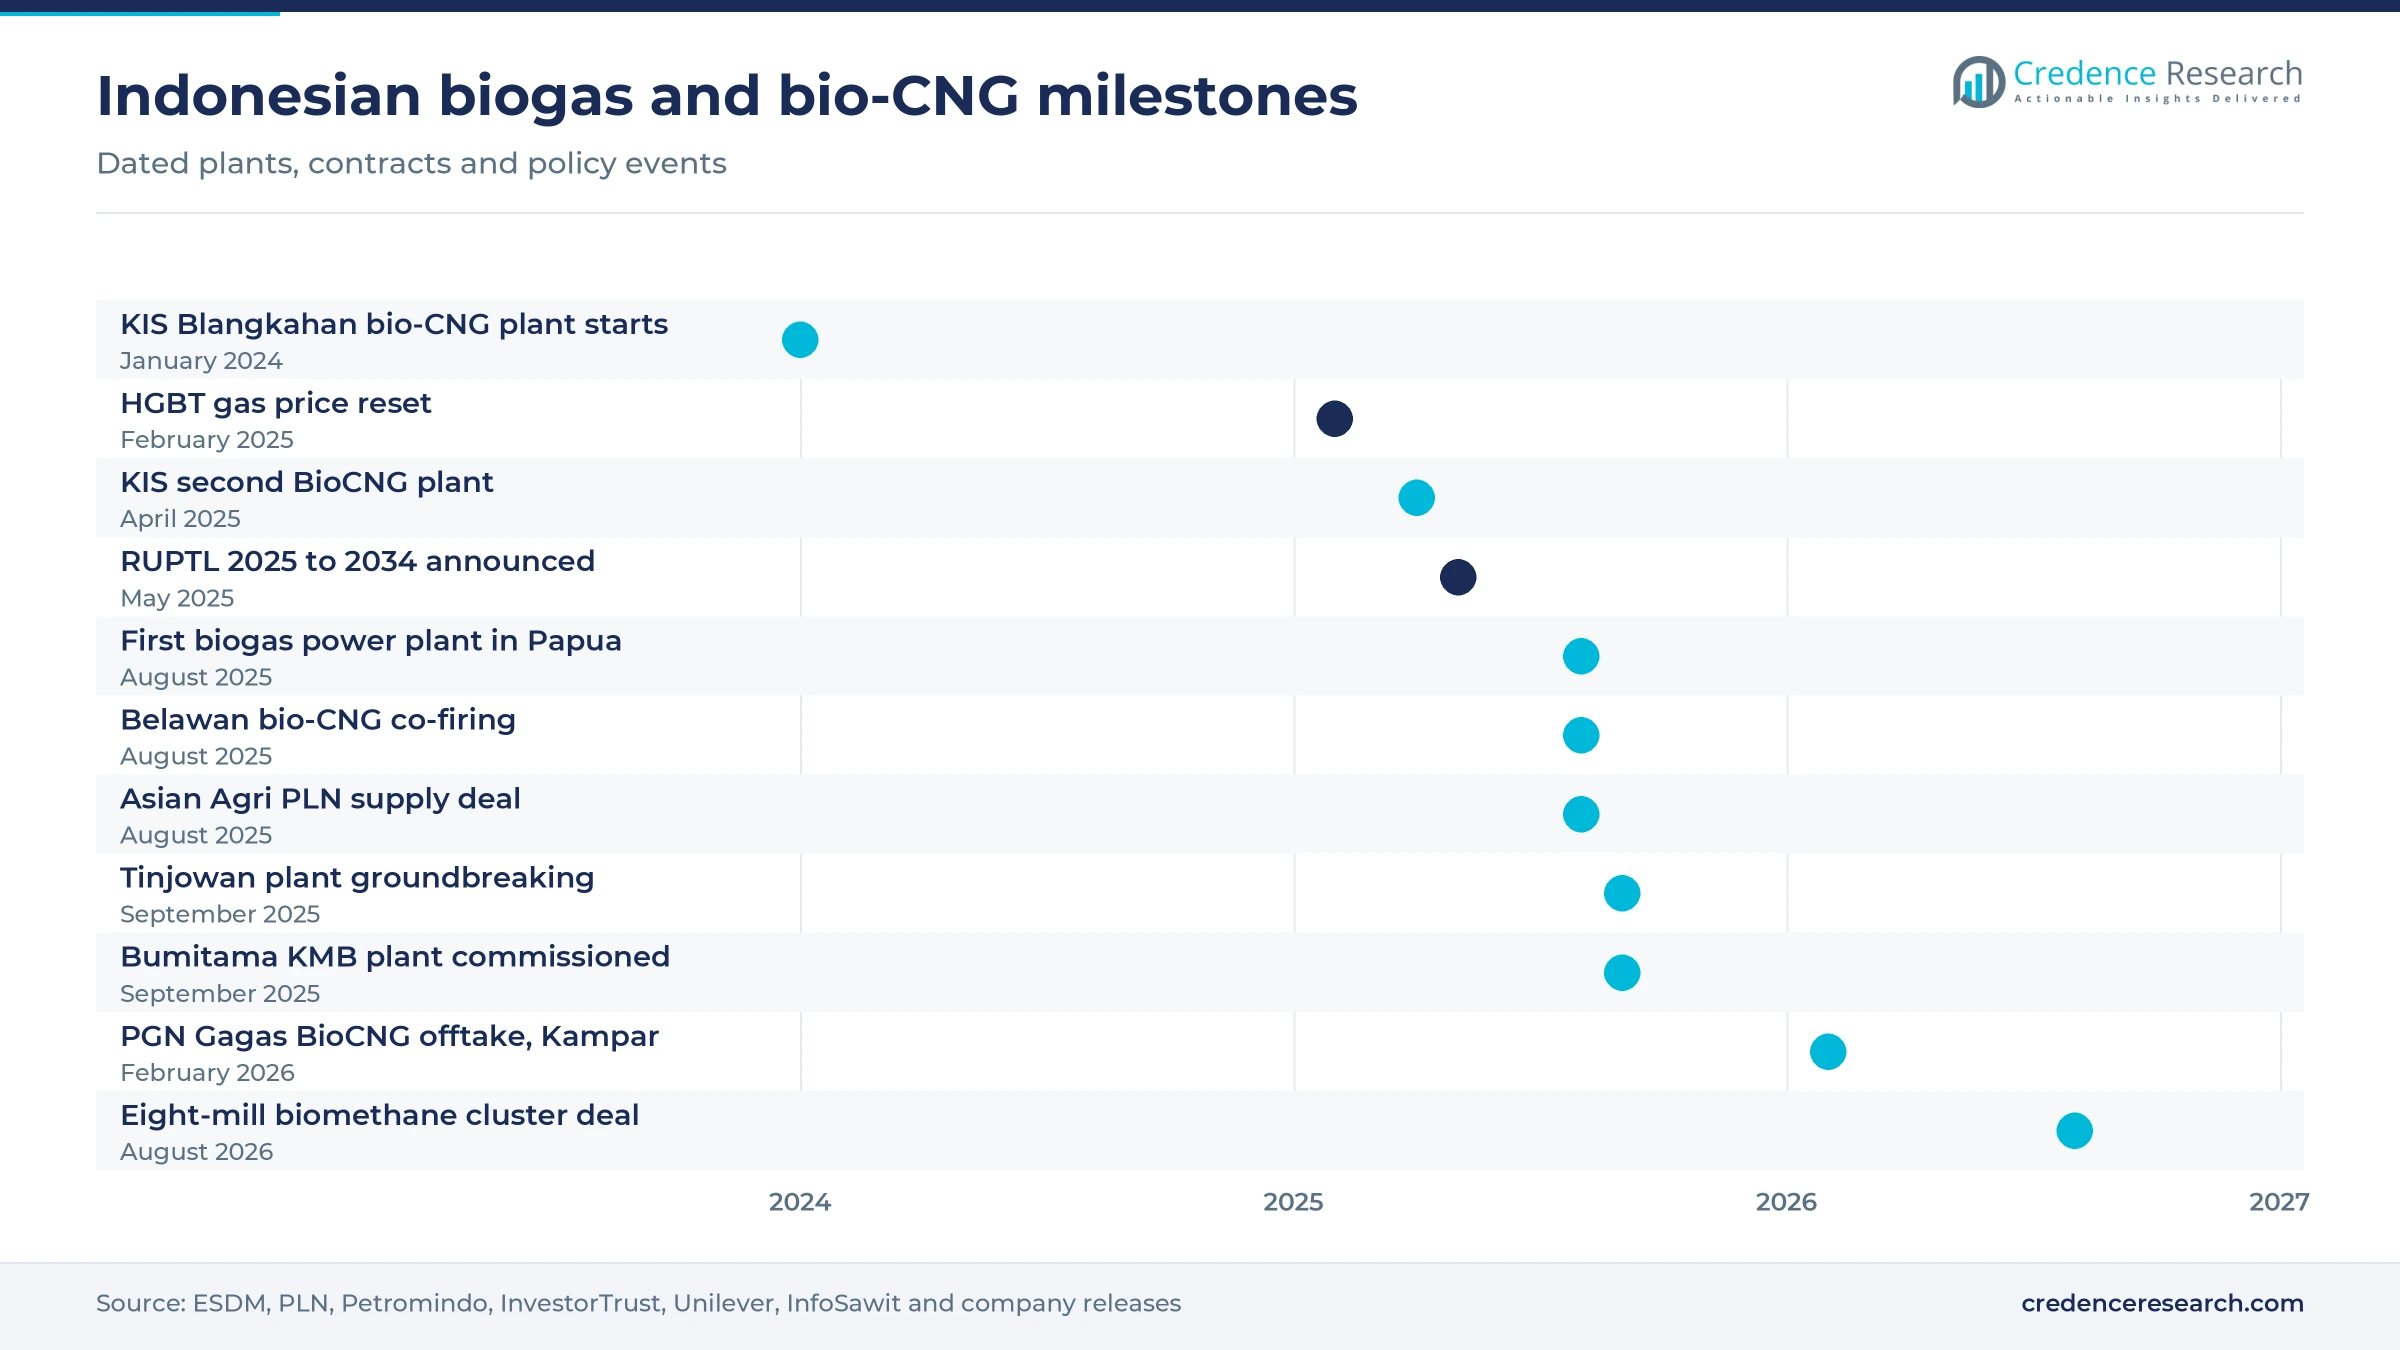
Compressed biomethane gives mills a product they can sell beyond their fence, which turns waste treatment into a gas business. KIS Group started its first commercial bio-CNG plant at the Blangkahan mill in Langkat, North Sumatra, on Jan. 22, 2024. Its second plant in Labuhanbatu Selatan, commissioned in April 2025 with an AEP Group unit, can produce up to 182,000 MMBtu a year. Unilever expects its Sei Mangkei oleochemical site to source more than 800,000 MMBtu of biomethane a year by 2030, almost a quarter of the energy the site needs. Long-term buyers of this kind give lenders the revenue certainty that bio-CNG plants need, and they explain why biomethane and bio-CNG is the fastest-growing application in this market.
Power planning and decarbonization goals widen offtake
National power planning now gives bioenergy a defined place in new capacity, which supports grid sales from larger biogas plants. The 2025 to 2034 electricity supply plan (RUPTL), announced on May 26, 2025, allots 0.9 GW to bioenergy within 42.6 GW of new renewable capacity. IRENA data show bioenergy generated 22,475 GWh in Indonesia in 2023, about 6% of total generation, so the sector already has an established place in the power mix. Asian Agri signed a three-year agreement in August 2025 to supply about 1 MW of biogas power to the PLN grid in the Rantau Prapat area of North Sumatra. These steps favor developers that can meet PLN interconnection rules and qualify for the regulated tariff.
Gas co-firing at PLN power plants opens a new outlet
The gas-fired fleet of PLN is emerging as a large potential buyer of biomethane, because blending small volumes cuts emissions without new turbines. PLN Nusantara Power launched bio-CNG co-firing at the Belawan combined-cycle plant in North Sumatra on Aug. 15, 2025, using gas made from palm oil mill effluent. PLN Energi Primer Indonesia said in June 2026 that a small blend across its 18.4 GW of gas-fired capacity would need about 60,000 MMBtu a day, supplied by roughly 200 mills. That volume is many times the output of the bio-CNG plants now running, so even a partial program would absorb new supply for years. A utility buyer at this scale would give upgrading plants the anchor demand they now lack.
Clustered hubs and carbon finance reshape project models
Shift from single-mill power to clustered biomethane hubs
Developers are shifting from one engine per mill to hubs that collect gas from several mills and sell it into gas networks. On Aug. 20, 2026, reNIKOLA Holdings and Pertagas Niaga signed a long-term agreement for compressed biomethane from eight palm oil mills, with expected output above 830,000 MMBtu a year and investment of about USD 40 million, according to The Star. PTPN IV PalmCo broke ground in September 2025 on a 162,000 MMBtu a year plant at its Tinjowan mill in Simalungun under a 10-year contract with Pertagas Niaga, Petromindo reported. Clusters spread upgrading and transport costs over more gas, which lowers the cost per MMBtu for each participating mill.
Rise of carbon finance in household and community digesters
Household and community digesters increasingly rely on carbon credits rather than grants, which changes who pays for rural biogas. Yayasan Rumah Energi, which runs the BIRU program, counted 29,915 biogas installations in 21 provinces as of October 2025, Warta Ekonomi reported, still far from the Energy Ministry target of one million units. Hivos says each digester cuts about 2.6 tons of carbon a year, and the program registered its credits with the Gold Standard on Dec. 3, 2013. In November 2025, Petromindo reported that BKN was offering Gold Standard credits from the Indonesia Domestic Biogas Program to global buyers. Carbon revenue lowers the share of cost that farmers carry, which keeps rural installation going without large public budgets.
Kalimantan estates offer the next wave of mill projects
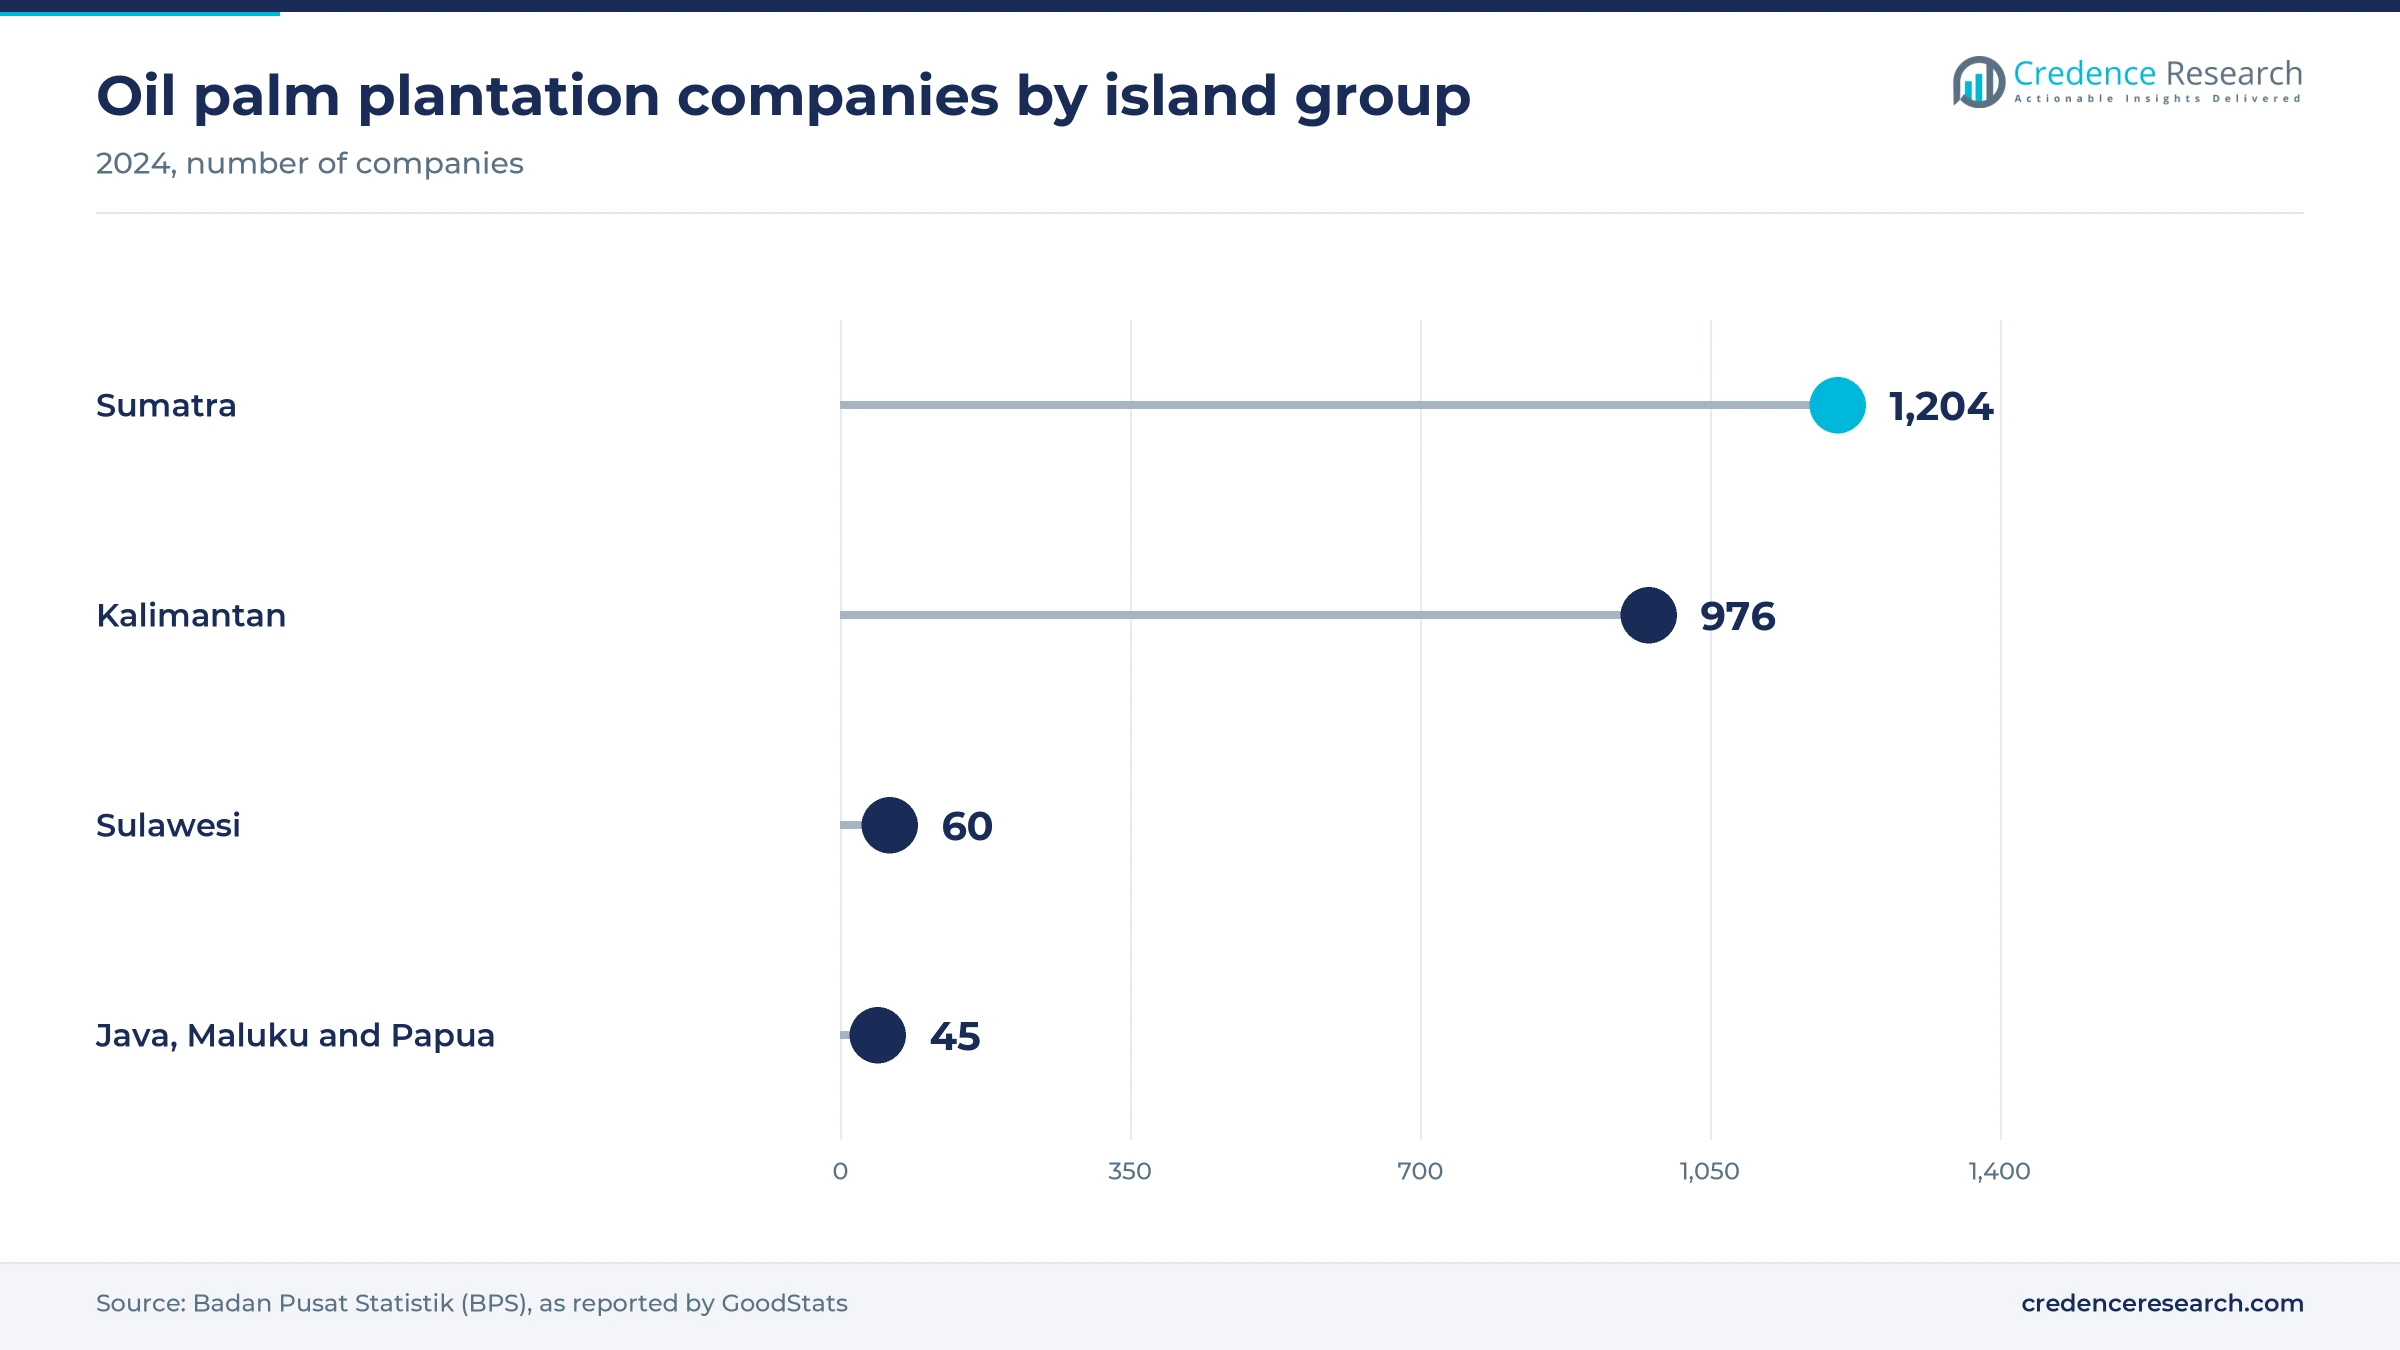
Kalimantan holds the largest plantation base outside Sumatra while its share of biogas value trails that base, which makes it the next target for developers. BPS data for 2024 count 976 oil palm plantation companies on the island, 42.71% of the national total and close to the 1,204 in Sumatra. Bumitama Gunajaya Agro completed commissioning of a biogas plant at its Karya Makmur Bahagia mill in Central Kalimantan in September 2025, producing 30,558 normal cubic meters of biogas a day, according to InfoSawit. The Energy Ministry and GGGI also completed a bio-CNG market study for Central and East Kalimantan, the ministry said in July 2021. Developers that bring standard digester designs to these estates can win multisite contracts.
Tapioca and food wastewater open an industrial niche
Starch and food processors outside the palm sector offer a smaller but growing opening for on-site biogas plants. The same ministry estimate puts the annual biogas potential of municipal waste at 2.7 billion cubic meters, a resource that food plants and cities have barely started to tap. GREE Energy, which builds on-site biogas plants for food processors, raised USD 3.2 million in December 2022, and its Hamparan project in Lampung produces almost 10 GWh of energy a year for 19 villages. Gas from these plants can replace LPG and diesel in boilers, which matters to processors facing high fuel costs. Developers that pair wastewater treatment with carbon revenue can make small plants pay.
Grid delays, tariff cuts and cheap gas slow new plants
Grid connection lags far behind the bioenergy quota
Grid sales remain small because few biogas plants have reached commercial operation with PLN. A PLN director said in September 2024 that only 27 MW of the 313 MW bioenergy quota of the utility had reached commercial operation, InvestorTrust reported. Thomas Wagner of EnviTec Biogas estimated in June 2026 that only three or four of about 200 biogas installations were connected to the grid as independent power producers. Developers that depend on power sales face long waits, so many keep plants for mill use.
Tariffs fall after year ten while capital costs stay high
The tariff structure squeezes long-term returns, because ceiling prices drop sharply after the first decade of a contract. Under Presidential Regulation 112 of 2022, a 1 MW biogas plant earns at most 6.11 U.S. cents per kWh from year 11, against the higher first-decade ceiling noted above. Capital costs stay high, as PT Karya Mandoge Energi spent Rp42 billion on its 2 MW Pasir Mandoge plant in North Sumatra, according to IDX Channel in August 2021. Lenders therefore look for gas offtake or captive savings before they fund power-only plants.
Subsidized pipeline gas undercuts biomethane prices
Cheap fossil gas for favored industries narrows the margin for biomethane sold to factories. The Energy and Mineral Resources Ministry set the HGBT gas price for fuel use at USD 7 per MMBtu in February 2025 for 253 users in seven industries, including oleochemicals. Compressed biomethane must cover upgrading, compression and trucking, which pushes its delivered cost above that level. As a result, suppliers target buyers without pipeline access or with emission targets, such as the oleochemical offtake noted above.
Direct gas use stays tiny next to the resource
Direct use of biogas outside power plants remains tiny compared with the resource, which shows how thin the gas market still is. The Energy Ministry recorded 28.5 million cubic meters of direct biogas use as of July 30, 2023, about 40% of it from palm oil effluent. The same ministry estimated the palm oil potential at 5.2 billion cubic meters a year, equal to about a third of national LPG needs. Without pipelines, trucks and high-pressure cylinders, most of that potential stays in open lagoons.
Sumatra leads on mill density as Kalimantan catches up
Sumatra holds more biogas value than the other three zones combined, because 52.69% of oil palm plantation companies operate there. Zone shares are Credence Research estimates weighted by oil palm area, plantation company counts, operating biogas plants, livestock numbers and waste data across four zones.
| Region | Value, 2025 (USD million) | Share, 2025 | CAGR, 2026–2035 |
|---|---|---|---|
| Sumatra | 73.0 | 58.0% | 11.6% |
| Kalimantan | 27.7 | 22.0% | 12.9% |
| Java and Bali | 16.4 | 13.0% | 11.7% |
| Sulawesi and Eastern Indonesia | 8.8 | 7.0% | 12.7% |
Sumatra leads on mill density and the first bio-CNG plants
Sumatra held 58.0% of 2025 value and grows at 11.6% a year. BPS data for 2025 put the oil palm area of the island at about 8.78 million hectares, led by Riau at 3.41 million and North Sumatra at 1.36 million, according to Kontan. Most grid-connected plants sit here, including the 3 MW Pasadena Biofuels Mandiri plant in Rokan Hulu, Riau, which began commercial operation on May 3, 2023. North Sumatra also hosts the first bio-CNG plants and the Belawan co-firing pilot noted above.
Kalimantan grows fastest as estates add methane capture
Kalimantan held 22.0% of 2025 value and grows at 12.9% a year, the fastest of the four zones. East Kalimantan alone had about 1.49 million hectares of oil palm, BPS data reported by JawaPos show, more than North Sumatra. The share of the zone trails its plantation base because grid links are weaker and fewer groups have built capture plants so far. New projects such as the Central Kalimantan plant noted above show that gap starting to close.
Java and Bali rely on manure, food waste and small digesters
Java and Bali held 13.0% of 2025 value and grow at 11.7% a year. The islands host almost no palm oil mills, so their biogas comes from dairy farms, tapioca and food plants and urban waste. BPS data reported by GoodStats show that East, West and Central Java held about 97% of the 507,075 dairy cattle in the country in 2022, which concentrates manure digesters there. Plants in this zone are small, so they add many units but modest value.
Sulawesi and eastern Indonesia start from a small base
Sulawesi and Eastern Indonesia held 7.0% of 2025 value and grow at 12.7% a year. Sulawesi had 60 oil palm plantation companies in 2024, 2.63% of the national count, according to BPS data. PT Berkat Cipta Abadi of the Tunas Sawa Erma group inaugurated the first biogas power plant in Papua on Aug. 1, 2025, with 2 MW from palm oil effluent and plans for 5 MW. Isolated grids that burn diesel make such plants attractive across the zone.
Bio-CNG plants and offtake deals mark 2025 and 2026
| Development | Status and market relevance |
|---|---|
| In April 2025, KIS Group and an AEP Group unit commissioned a second BioCNG plant in Labuhanbatu Selatan, North Sumatra. | Commissioned; up to 182,000 MMBtu a year |
| In August 2025, PT Berkat Cipta Abadi inaugurated the first biogas power plant in Papua. | Operating; 2 MW with 5 MW planned |
| In September 2025, PTPN IV PalmCo broke ground on a compressed biogas plant at its Tinjowan mill in North Sumatra. | Under construction; full operation targeted for late 2026 |
| In February 2026, PGN Gagas agreed to buy BioCNG from a KIS Group plant in Kampar, Riau. | Under construction; commercial operation targeted for early 2027 |
| In August 2026, reNIKOLA Holdings and Pertagas Niaga signed a long-term compressed biomethane agreement. | Signed; gas gathered from eight palm oil mills |
Lagoons, engines and upgrading set the value per mill
- Covered lagoon digesters turn existing effluent ponds into gas collectors at low cost, which is why most palm oil mills start with them.
- Gas engines and CHP units convert cleaned biogas into electricity and heat for mills, estates and housing, with surplus power sold to PLN where contracts exist.
- Upgrading and compression raise methane content above 95% to meet the SNI 9164 biomethane standard issued in 2023, so the gas can travel in cylinders or pipelines.
- Precast digester tanks cut build times, and EnviTec Biogas says tanks developed with Waskita Beton Precast in Cilegon can be finished in three days.
Need a Custom Version of This Report?
Tailor the scope, geography, or segments to your exact requirements.
- Custom geography or segment scope
- Direct access to our analyst team
Plantation groups and gas developers compete for effluent
Competition runs on access to effluent and on the ability to sign gas or power buyers. Plantation groups, including Asian Agri, Musim Mas, First Resources, Dharma Satya Nusantara and Austindo Nusantara Jaya, control most of the feedstock and run captive plants with gas engines at their mills. PT SMART Tbk announced plans to enter biogas production in May 2025, adding another large group to the field. Specialist developers compete for the remaining mills, with KIS Group leading bio-CNG through build-own-operate contracts and offtake from PGN Gagas and Unilever. GREE Energy targets food processors and carbon revenue, while independent power producers such as PT Karya Mandoge Energi sell electricity to PLN from small plants. State-owned PTPN IV and the gas distributors of the Pertamina group now shape the next phase by pairing their mills and networks with private developers.
Plantation groups own the gas while specialists build plants
The supply side splits between plantation groups that own the effluent and specialist developers that design, finance and run the plants. Large groups such as Musim Mas, which equipped its 17th mill with methane capture in 2022, build captive systems mainly for their own mills, often to meet buyer demand for certified sustainable palm oil. Developers such as KIS Group, reNIKOLA and GREE Energy use build-own-operate contracts, taking on capital cost in return for gas or carbon revenue. Entry barriers sit in feedstock access, offtake contracts and permits, and margins are highest where gas replaces diesel.
Companies profiled and their roles in this market
| Company | Type | Role in the market |
|---|---|---|
| PT KIS Biofuels Indonesia | Bio-CNG developer | Plants at Blangkahan (2024) and Labuhanbatu Selatan (2025); Kampar plant for PGN Gagas |
| GREE Energy | Biogas developer | On-site biogas for food processors; Hamparan project in Lampung |
| PT Dharma Satya Nusantara Tbk | Plantation group | Bio-CNG program since 2020; plans to double capacity |
| Asian Agri | Plantation group | Biogas plants at its mills; PLN supply deal in North Sumatra in August 2025 |
| Musim Mas | Plantation group | Methane capture at its mills; grid exports since 2014 |
| PT SMART Tbk | Plantation group | Announced plans to enter biogas production in May 2025 |
| First Resources Limited | Plantation group | Expanded methane capture facilities in 2025 |
| PT Austindo Nusantara Jaya Tbk | Plantation group | 1.8 MW biogas plant in Belitung since December 2013 |
| PT Karya Mandoge Energi | Independent power producer | 2 MW Pasir Mandoge plant selling to PLN in North Sumatra |
Gas offtake, not power alone, decides the winners
Credence Research's view is that the Indonesia biogas market will grow through gas sales rather than through power alone. Mills already capture methane for their own engines, but the next layer of value comes from compressed biomethane sold to gas distributors, oleochemical plants and PLN gas turbines. The winners will be developers that gather effluent from several mills and lock in long-term buyers. Plantation groups that wait risk selling their effluent to these developers on weaker terms. Demand from PLN gas plants alone could reach about 60,000 MMBtu a day if co-firing spreads across the fleet. Kalimantan, whose biogas share trails its plantation base, is where the next contracts are most likely to be won.
Plant capacity, tariffs and gas prices anchor the model
The report uses 2025 as the base year and 2026 to 2035 as the forecast period. Market values come from the Credence Research model, which values biogas electricity and gas output from Energy Ministry, PLN and company capacity data at regulated tariffs and fuel-equivalent prices, and adds annual spending on new digesters, upgrading and engines. Segment and zone splits are Credence Research estimates built from BPS plantation, livestock and waste statistics, PLN and ministry releases, company filings and trade press. No interviews or primary surveys were conducted for this edition.
Compressed biomethane takes a larger share by 2035
The Indonesia biogas market is expected to grow from USD 141.0 million in 2026 to USD 390.9 million by 2035 at a 12.00% CAGR. Biomethane and bio-CNG grow fastest at 18.2% a year as clustered hubs and gas distributors build a supply chain for compressed gas. Electricity generation keeps the largest share, 62.0% of 2025 value, supported by mill demand and the bioenergy allocation in national power planning. Sumatra stays the largest zone, while Kalimantan adds share as its estates install capture plants. By 2035, a growing part of mill effluent should leave the gate as sold gas rather than as methane released from open ponds.
Offtake contracts and gas prices set the 2035 range
The range of outcomes depends on how fast gas buyers sign contracts and how much PLN buys from biogas plants. A downside case assumes grid contracts stay slow, subsidized gas keeps biomethane uncompetitive and clustered hubs face delays. The base case assumes bio-CNG offtake keeps expanding in Sumatra and Kalimantan and PLN adds biogas capacity within its bioenergy allocation. An upside case needs co-firing at PLN gas plants and a working carbon market that rewards methane capture at most mills.
| Scenario | CAGR, 2026–2035 | Value, 2035 | What has to hold |
|---|---|---|---|
| Downside | 10.0% | USD 332.5 million | Grid contracts stay slow, cheap pipeline gas holds and cluster projects slip |
| Base | 12.00% | USD 390.9 million | Bio-CNG offtake keeps expanding and PLN adds biogas within its bioenergy allocation |
| Upside | 13.8% | USD 451.3 million | PLN co-firing scales up and carbon revenue rewards capture at most mills |
Frequently Asked Questions
How big is the Indonesia biogas market?
Which feedstock leads biogas output in Indonesia?
Which zone leads the Indonesian biogas market?
Why is the share of Java and Bali small?
What is bio-CNG and who produces it in Indonesia?
What tariff does PLN pay for biogas power?
What slows biogas growth in Indonesia?
Who are the key companies in the Indonesia biogas market?
Table of Content
Chapter 1 Market Segmentation
- 1.1 Segmentation Framework
- 1.1.1 Product and Service Classification
- 1.1.2 Application and End-Use Classification
- 1.1.3 Technology and Solution Classification
- 1.1.4 Customer and Distribution Channel Classification
- 1.1.5 Geographic Segmentation
- 1.1.6 Market Segment Definitions and Boundaries
- 1.2 By Energy Source
- 1.2.1 Palm Oil Mill Effluent
- 1.2.2 Tapioca and Starch Wastewater
- 1.2.3 Livestock Manure
- 1.2.4 Food and Municipal Organic Waste
- 1.3 By Application
- 1.3.1 Electricity Generation
- 1.3.2 Industrial Boiler Fuel
- 1.3.3 Biomethane and Bio-CNG
- 1.3.4 Cooking and Community Energy
- 1.4 By End User
- 1.4.1 Palm Oil Mills and Plantations
- 1.4.2 Food and Beverage Processors
- 1.4.3 Municipal Waste Operators
- 1.4.4 Farms and Rural Communities
- 1.5 By Project Scale
- 1.5.1 Small Decentralized Digesters
- 1.5.2 Village and Cooperative Systems
- 1.5.3 Industrial On-site Systems
- 1.5.4 Large Clustered Biomethane Plants
Chapter 2 Introduction
- 2.1 Report Objectives and Scope
- 2.2 Product Definition and Industry Terminology
- 2.3 Market Inclusions and Exclusions
- 2.4 Research Process
- 2.4.1 Primary Research and Expert Interviews
- 2.4.2 Secondary Research and Source Review
- 2.4.3 Top-Down and Bottom-Up Estimation
- 2.4.4 Data Triangulation and Verification
- 2.5 Market Size Measurement Basis
- 2.5.1 2025: USD 125.9 million → 2035: USD 390.9 million
- 2.6 Historical and Forecast Reference Periods
- 2.6.1 Historical Period: 2018-2025
- 2.6.2 Base Year: 2025
- 2.6.3 Forecast Period: 2025-2035
- 2.7 Research Assumptions and Limitations
Chapter 3 Executive Summary
- 3.1 Market Snapshot and Key Findings
- 3.2 Base-Year Market Size, 2025
- 3.3 Forecast Market Size, 2035
- 3.4 Revenue and Volume Growth Outlook
- 3.5 Key Demand and Supply Indicators
- 3.6 Leading Market Segments
- 3.7 Fastest-Growing Market Opportunities
- 3.8 Regional Performance Highlights
- 3.9 Technology and Industry Transformation
- 3.10 Competitive Landscape Summary
- 3.11 Analyst View and Strategic Implications
Chapter 4 Indonesia Biogas Market Trends and Developments
- 4.1 Historical Industry Development, 2018-2025
- 4.2 Recent Market Trends and Developments
- 4.3 Demand and Customer Behavior Trends
- 4.4 Technology and Product Innovation
- 4.5 Artificial Intelligence, Automation and Digitalization
- 4.6 Local Manufacturing and Supply Chain Realignment
- 4.7 Industry Partnerships, Mergers and Acquisitions
- 4.8 Sustainability and Circular Economy Developments
- 4.9 Government and Private Sector Investment Trends
- 4.10 Emerging Business Models and Commercialization
- 4.11 Industry Developments and Announcements
Chapter 5 Indonesia Biogas Market Production, Supply and Demand Analysis
- 5.1 Demand Trend and Consumption Analysis, 2018-2025
- 5.2 Demand Forecast, 2025-2035
- 5.3 Production and Output Trend, 2018-2025
- 5.4 Production and Output Forecast, 2025-2035
- 5.5 Installed Capacity and Capacity Utilization
- 5.6 Company-Wise Production Plants and Statistics
- 5.6.1 Installed Production Capacity
- 5.6.2 Actual Production
- 5.6.3 Planned Capacity and Expansion Targets
- 5.7 Supply Chain Structure and Procurement Trends
- 5.8 Supply-Demand Gap and Bottlenecks
- 5.9 Import Dependence and Sourcing Structure
- 5.10 Contract Manufacturing and Outsourcing
- 5.11 Regional Supply and Demand Concentration
Chapter 6 Indonesia Biogas Market Pricing Analysis
- 6.1 Pricing Structure and Measurement
- 6.2 Historical Pricing Trends, 2018-2025
- 6.3 Pricing Outlook, 2025-2035
- 6.4 Average Selling Price and Unit Economics
- 6.5 Pricing by Product and Market Segment
- 6.6 Geographic Pricing Differences
- 6.7 Key Input, Energy, Labor and Logistics Costs
- 6.8 Contract Pricing and Purchasing Models
- 6.9 Pricing Sensitivity and Competitive Positioning
- 6.10 Price, Margin and Profitability Implications
Chapter 7 Indonesia Biogas Market Dynamics
- 7.1 Market Growth Drivers
- 7.1.1 Demand-Side Drivers
- 7.1.2 Technology and Innovation Drivers
- 7.1.3 Infrastructure and Investment Drivers
- 7.1.4 Regulatory and Policy Drivers
- 7.2 Market Restraints
- 7.2.1 Cost and Affordability Constraints
- 7.2.2 Technology and Adoption Barriers
- 7.2.3 Supply Chain and Operational Constraints
- 7.3 Market Challenges
- 7.3.1 Competitive Pressure and Margin Erosion
- 7.3.2 Skills, Infrastructure and Implementation Gaps
- 7.4 Emerging Market Opportunities
- 7.5 Market Dynamics Impact and Time-Horizon Assessment
Chapter 8 Indonesia Biogas Value Chain Analysis
- 8.1 Industry Value Chain Overview
- 8.2 Upstream Suppliers and Critical Inputs
- 8.3 Technology and Component Providers
- 8.4 Manufacturing or Service Delivery
- 8.5 Distribution, Channel Partners and Integrators
- 8.6 Downstream Applications and End Users
- 8.7 Value Addition and Profit Pools
- 8.8 Vertical Integration and Outsourcing
- 8.9 Supplier Concentration and Risk
- 8.10 Supply Chain Localization and Resilience
Chapter 9 Indonesia Biogas Market Regulations and Policies
- 9.1 Relevant Laws, Standards and Compliance Frameworks
- 9.2 Product, Service, Safety and Quality Requirements
- 9.3 Government Policies, Incentives and Subsidies
- 9.4 Imports, Exports and Trade Barriers
- 9.5 Public Procurement and Local Content Requirements
- 9.6 Environmental and Sustainability Compliance
- 9.7 Upcoming Policy Changes and Market Implications
Chapter 10 Indonesia Biogas Market Hotspots and Opportunities
- 10.1 Market Opportunity Mapping and Growth Hotspots
- 10.2 High-Growth Applications and Customer Groups
- 10.3 Underserved Markets and White-Space Opportunities
- 10.4 Emerging Technology and Product Opportunities
- 10.5 New Capacity and Investment Hotspots
- 10.6 Market Entry and Expansion Opportunities
- 10.7 Distribution and Partnership Opportunities
- 10.8 Near-Term and Long-Term Commercial Potential
- 10.9 Opportunity Attractiveness and Execution Risks
Chapter 11 Indonesia Biogas Market Outlook, 2025-2035
- 11.1 Market Size and Analysis
- 11.1.1 Revenue (Market Measurement: 2025: USD 125.9 million → 2035: USD 390.9 million)
- 11.1.2 Market Volume and Quantity Sold
- 11.1.3 Historical Market Size, 2018-2025
- 11.1.4 Base-Year Market Size, 2025
- 11.2 Market Forecast, 2025-2035
- 11.2.1 Revenue Forecast to 2035
- 11.2.2 Volume Forecast to 2035
- 11.2.3 CAGR and Year-on-Year Growth
- 11.2.4 Incremental Revenue Opportunity
- 11.3 Forecast Assumptions and Scenario Analysis
- 11.3.1 Base-Case Forecast
- 11.3.2 Optimistic and Conservative Scenarios
- 11.3.3 Technology, Pricing and Policy Sensitivities
- 11.4 Market Attractiveness and Growth Outlook
Chapter 12 Indonesia Biogas Market Segmentation and Outlook
- 12.1 Segmentation Summary and Market Shares, 2025
- 12.2 Largest and Fastest-Growing Segments
- 12.3 By Energy Source - Market Size and Forecast, 2025-2035
- 12.3.1 Segment Definition and Scope
- 12.3.2 Historical Market Size, 2018-2025
- 12.3.3 Revenue Forecast, 2025-2035
- 12.3.4 Volume Forecast, 2025-2035
- 12.3.5 Base-Year Market Share, 2025
- 12.3.6 Segment CAGR and Growth Drivers
- 12.3.7 Subsegment Market Size and Forecast
- 12.3.7.1 Palm Oil Mill Effluent
- 12.3.7.2 Tapioca and Starch Wastewater
- 12.3.7.3 Livestock Manure
- 12.3.7.4 Food and Municipal Organic Waste
- 12.3.8 Subsegment Pricing and Adoption Trends
- 12.3.9 Leading Suppliers and Competition
- 12.3.10 Regional Demand and Opportunities
- 12.4 By Application - Market Size and Forecast, 2025-2035
- 12.4.1 Segment Definition and Scope
- 12.4.2 Historical Market Size, 2018-2025
- 12.4.3 Revenue Forecast, 2025-2035
- 12.4.4 Volume Forecast, 2025-2035
- 12.4.5 Base-Year Market Share, 2025
- 12.4.6 Segment CAGR and Growth Drivers
- 12.4.7 Subsegment Market Size and Forecast
- 12.4.7.1 Electricity Generation
- 12.4.7.2 Industrial Boiler Fuel
- 12.4.7.3 Biomethane and Bio-CNG
- 12.4.7.4 Cooking and Community Energy
- 12.4.8 Subsegment Pricing and Adoption Trends
- 12.4.9 Leading Suppliers and Competition
- 12.4.10 Regional Demand and Opportunities
- 12.5 By End User - Market Size and Forecast, 2025-2035
- 12.5.1 Segment Definition and Scope
- 12.5.2 Historical Market Size, 2018-2025
- 12.5.3 Revenue Forecast, 2025-2035
- 12.5.4 Volume Forecast, 2025-2035
- 12.5.5 Base-Year Market Share, 2025
- 12.5.6 Segment CAGR and Growth Drivers
- 12.5.7 Subsegment Market Size and Forecast
- 12.5.7.1 Palm Oil Mills and Plantations
- 12.5.7.2 Food and Beverage Processors
- 12.5.7.3 Municipal Waste Operators
- 12.5.7.4 Farms and Rural Communities
- 12.5.8 Subsegment Pricing and Adoption Trends
- 12.5.9 Leading Suppliers and Competition
- 12.5.10 Regional Demand and Opportunities
- 12.6 By Project Scale - Market Size and Forecast, 2025-2035
- 12.6.1 Segment Definition and Scope
- 12.6.2 Historical Market Size, 2018-2025
- 12.6.3 Revenue Forecast, 2025-2035
- 12.6.4 Volume Forecast, 2025-2035
- 12.6.5 Base-Year Market Share, 2025
- 12.6.6 Segment CAGR and Growth Drivers
- 12.6.7 Subsegment Market Size and Forecast
- 12.6.7.1 Small Decentralized Digesters
- 12.6.7.2 Village and Cooperative Systems
- 12.6.7.3 Industrial On-site Systems
- 12.6.7.4 Large Clustered Biomethane Plants
- 12.6.8 Subsegment Pricing and Adoption Trends
- 12.6.9 Leading Suppliers and Competition
- 12.6.10 Regional Demand and Opportunities
- 12.7 Segment Growth Comparison
- 12.8 Segment Attractiveness and Priority Matrix
Chapter 13 Indonesia Biogas End-Use and Application Market Outlook
- 13.1 End-Use Industry and Customer Demand Structure
- 13.2 Leading Applications and Customer Groups
- 13.3 End-Use Market Size, Share and Forecast
- 13.4 Major End-Use Industry Deep Dives
- 13.4.1 Customer Requirements and Use Cases
- 13.4.2 Demand and Replacement Cycles
- 13.4.3 Technical and Regulatory Considerations
- 13.4.4 Purchasing and Procurement Models
- 13.4.5 Leading Vendors and Distribution Channels
- 13.4.6 Forecast and Commercial Opportunities
- 13.5 Emerging Applications and Cross-Segment Demand
- 13.6 End-Use Industry Investment Priorities
Chapter 14 Indonesia Biogas Geographic Market Outlook, 2025-2035
- 14.1 Domestic Market Distribution and Demand Clusters
- 14.2 State- or Province-Wise Market Size and Forecast, 2025-2035
- 14.3 City and Metropolitan Market Outlook
- 14.4 Industrial, Manufacturing and Commercial Clusters
- 14.5 Geographic Concentration of Key End Users
- 14.6 Local Pricing and Purchasing Differences
- 14.7 Domestic Production Facilities and Capacity Map
- 14.8 Local Infrastructure and Project Pipeline
- 14.9 State-Level Policy and Incentive Differences
- 14.10 Subnational Investment Hotspots and Opportunities
- 14.11 Distribution and Logistics Networks
- 14.12 Domestic Competitive Footprint
Chapter 15 Indonesia Biogas Technology, Innovation and Sustainability Outlook
- 15.1 Technology Landscape and Maturity
- 15.2 Product, Process and Service Innovation
- 15.3 AI, Automation and Digital Tools in the Industry
- 15.4 Technology Adoption and Performance Benchmarking
- 15.5 Innovation Pipeline and R&D Investment
- 15.6 Patent and Intellectual Property Trends
- 15.7 Energy Efficiency and Resource Management
- 15.8 Sustainability, Recycling and Circularity
- 15.9 Technology Roadmap, 2025-2035
- 15.10 Risks of Obsolescence and Technology Substitution
Chapter 16 Indonesia Biogas Market Key Strategic Imperatives
- 16.1 Growth and Market Entry Priorities
- 16.2 High-Return Products and Segments
- 16.3 Pricing, Profitability and Cost Optimization
- 16.4 Technology Investment and Product Differentiation
- 16.5 Supply Chain Localization and Resilience
- 16.6 Distribution and Customer Acquisition
- 16.7 Partnership, Acquisition and Capacity Strategy
- 16.8 Regional Expansion Priorities
- 16.9 Short-, Medium- and Long-Term Actions
Chapter 17 Competition Outlook
- 17.1 Industry Competition Characteristics
- 17.2 Market Structure and Concentration
- 17.3 Market Share and Competitive Positioning, 2025
- 17.4 Company-Wise Revenue and Product Benchmarking
- 17.5 Production and Service Capacity Benchmarking
- 17.6 Technology, Pricing and Differentiation
- 17.7 Regional Footprint and Distribution Strength
- 17.8 Mergers, Acquisitions and Strategic Alliances
- 17.9 New Entrants and Competitive Threats
- 17.10 Porter's Five Forces and Industry Attractiveness
- 17.11 Competitive Outlook, 2025-2035
Chapter 18 Company Profiles
- 18.1 Company Coverage and Selection Criteria
- 18.2 PT KIS Biofuels Indonesia
- 18.2.1 Business Description
- 18.2.2 Company Ownership and Geographic Presence
- 18.2.3 Product and Service Portfolio
- 18.2.4 Manufacturing and Operating Footprint
- 18.2.5 Production Capacity and Expansion Plans
- 18.2.6 Financial Performance and Investment
- 18.2.7 Market Share and Competitive Position
- 18.2.8 Technology and Innovation Capabilities
- 18.2.9 Strategic Alliances or Partnerships
- 18.2.10 Recent Developments
- 18.2.11 Growth Strategy and Outlook
- 18.3 GREE Energy
- 18.4 PT Dharma Satya Nusantara Tbk
- 18.5 Asian Agri
- 18.6 Musim Mas
- 18.7 PT SMART Tbk
- 18.8 First Resources Limited
- 18.9 PT Austindo Nusantara Jaya Tbk
- 18.10 SIPEF Group
- 18.11 PT Karya Mandoge Energi
- 18.12 Other Relevant Market Participants
Note: Every listed company is profiled on the structure shown under the first company. The company list is preliminary and may change based on research findings, market developments, data availability and client requirements.
Chapter 19 Disclaimer
- 19.1 Research and Forecast Disclaimer
- 19.2 Data Source and Estimation Limitations
Note: The depth of individual sections depends on data availability for this market. Volume, capacity, trade and other unit-based metrics are included where applicable.