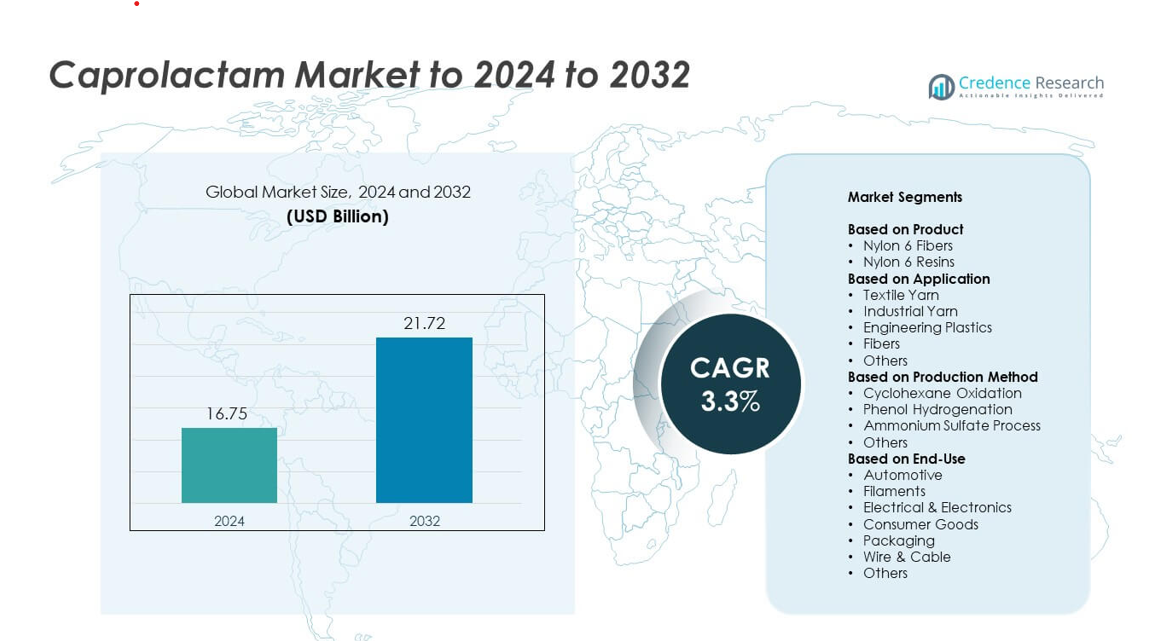
Home » Chemicals » Caprolactam Market

Caprolactam Market By Raw Material (Benzene, Hydroxylamine sulfate, Cyclohexane, Phenol) By Application (Nylon 6 filaments, Textile Yarn, Nylon 6 fibers, Engineering plastics) By End-Use (Textile industry, Automobile industry, Electrical and Electronics Industry, Others) – Growth, Future Prospects & Competitive Analysis, 2016 – 2028

Price: $4999

Published: | Report ID: 2120 | Report Format : PDF

About this report

The study on the worldwide caprolactam market thoroughly examines the sector using important criteria. The research covers investing tactics, the demand for capital in the caprolactam market, and the many advantages for investors. This significant report outlines modifications to the technical standards that apply to the caprolactam industry as well as how barriers that are both economic and non-economic are promoting the expansion of the caprolactam market. Additionally, the paper examines historical and projected market sizes at the regional, global, and national levels. In-depth analyses of key investment propositions, the demand and supply gaps, SRC analysis, competitor positioning, STAR analysis, and Tornado analysis are all included in the report. Technological advancements and other analyses include Porter’s Five Forces, Value Chain, PESTEL, etc.

REPORT ATTRIBUTE DETAILS
Caprolactam Market by Volume Yes
Market by Value Yes
Market, Tornado Analysis Yes
Market, STAR Analysis Yes
Market, SRC Analysis Yes
Market, Import-Export Data Yes (On Demand)
Market Pricing Analysis Yes (On Demand)
 Market Segment Analysis By raw material (Benzene, Hydroxylamine Sulfate, Cyclohexane, phenol and Ammonia)

By application (Nylon 6 Filaments, Textile Yarn, Nylon 6 Fibers, Engineering Plastics, Printer Inks and Others)

By end use (Textile Industry, Automobile Industry, Electrical and Electronics Industry and Others)

Market, Regional Analysis North America (US and Canada)

Europe (Germany, UK, France, Italy, Spain, and Rest of Europe)

Asia Pacific (China, India, Japan, South Korea, South East Asia, and Rest of Asia Pacific)

Latin America (Brazil, Mexico, and Rest of Latin America)

Middle East and Africa (GCC Countries, South Africa, and Rest of Middle East and Africa)

Market Key Companies BASF SE, Merck KGaA., Fertiliser and Chemicals Travancore (FACT) Ltd., UBE Corporation, Domo Chemicals, LANXESS AG, AdvanSix Inc., Reullei Pharmaceutical Technology Co., Ltd., Fibrant, and Luxi Chemical Group Co., Ltd.
Market Competitive Landscape Market Share Analysis

Competitive Benchmarking

Key Players Market Positioning

Geographical Presence Analysis

Major Strategies Adopted

Key Highlights of the Report

How are the major segments performing in the caprolactam market?

  • In 2021, the cyclohexane segment dominated the largest share of the market owing to an easily available and low-cost product.
  • In 2021, the nylon-6 filaments leading the global caprolactam market segment due to the filaments’ offering of mechanical strength and elasticity modules.
  • In 2021, the textile industry segment’s end-use outlook led the market due to the increasing adoption of nylon-6 fabrics.
Design Element 2

Access crucial information at unmatched prices!

Request your free sample report today & start making informed decisions powered by Credence Research!

Download Free Sample
CTA Design Element 3

Which region dominated the caprolactam market?

North America dominated in 2021 with the highest market share of the global caprolactam market. In North America, the global caprolactam market is growing due to the increasing use of molded plastic components, and easy availability is a factor in increasing the caprolactam market’s growth. These factors are increasing the growth of the caprolactam market in the North American region.

How is the US market performing in the caprolactam market?

The US caprolactam market dominated the global caprolactam market in 2021 with the highest market share. The US market has seen growth and is expected to provide the global caprolactam market with suppliers and opportunities. The US is the largest market for global caprolactam in North America due to the technology there, which provides a growth opportunity for this industry.

What is the competitive environment of the caprolactam market?

The global caprolactam market is expected to increase significantly in value over the next few years as its use expands across multiple industries. Manufacturers’ attempts to supply high-quality caprolactam with more health advantages are expected to contribute to market growth considerably. Aside from this, the growing number of fitness enthusiasts, sports activities, and fitness clubs, as well as the growth of infectious diseases, have contributed to the global caprolactam market’s competitive environment.

Executive Summary

How does the automotive industry support the growth of the global caprolactam market?

The International Organization of Motor Vehicle Manufacturers (OICA) estimates that in 2021, vehicle sales will have climbed globally by 5%. Due to its advantageous physical characteristics, nylon 6 is also employed in the automotive sector to produce parts for automobile engines, including intake manifolds, hoods, chassis, bearings, and gears. Polyamide also improves fuel efficiency by lightening the scaffold of an automobile and reducing fuel pollutants. This is anticipated to promote caprolactam adoption and significantly fuel market revenue growth.

Which are the key investments by the caprolactam market players?

The increasing utilization of caprolactam in various industries supports investments by market players. Moreover, market players are investing heavily in rising production and expanding their footprints in the global market. For instance, in 2022, Hengyi Petrochemical announced that it plans to invest in constructing a “caprolactam polyamide industrial integration and supporting the project with an annual production of 1.2 million tons”, and the total investment of the project is expected to be USD 2.77 billion.

Some of the key market players are BASF SE, Merck KGaA., Fertilizer and Chemicals Travancore (FACT) Ltd., UBE Corporation, Domo Chemicals, LANXESS AG, AdvanSix Inc., Reullei Pharmaceutical Technology Co., Ltd., Fibrant, and Luxi Chemical Group Co., Ltd.

What are the major driving factors for the caprolactam market?

The increasing adoption of nylon fabrics is driving the growth of the caprolactam market. The need for fabrics has also increased with the increasing population and urbanization. Nylon is used for making clothes such as track pants, jackets, swimwear, and other hosiery clothes. The rising demand for nylon clothes, mostly in the sports industry, is expected to increase the caprolactam market’s growth. Additionally, the increasing production is expected to grow the market. Furthermore, the increasing use of caprolactam in the textile industry to make nylon fabrics for carpets and industrial yarn is driving market growth. Moreover, the financial support by the government is also the driver of the global Caprolactam market.


What are the major risks for the caprolactam market?

The high cost associated with raw materials such as cyclohexane, benzene, phenol, and oleum hampers the caprolactam market’s growth. Moreover, caprolactam is harmful and causes burning of the eyes, irritation of the nose irritation and contact with the body, limiting production and hampering the caprolactam market’s growth. Furthermore, strict government regulations are expected to hamper the market’s growth.

Which are the key end-use segments in the caprolactam market?

The end-use segment is categorized into the textile, automobile, electrical, and electronics industries. The textile industry segment in the end-use outlook led the market due to the increasing adoption of nylon-6 fabrics. Nylon is a lightweight fabric that is made from caprolactam. Furthermore, the automobile industry segment dominated the market due to increased awareness of thermal and mechanical properties.

How is the caprolactam market performing in different regions?

North America saw substantial growth in 2021 due to many market players. In North America, the global caprolactam market is growing due to the increasing use of molded plastic components, and easy availability is a factor in increasing the caprolactam market’s growth. Furthermore, the United States is the largest market for global caprolactam in North America thanks to technology, which provides a growth opportunity for this industry. These factors are increasing the growth of the caprolactam market in the North American region.

The Asia Pacific region dominates the caprolactam market share due to the increasing adoption of caprolactam, which drives market growth in the Asia Pacific region. This region has the leading market for the global caprolactam industry. Furthermore, the falling crude oil prices are increasing caprolactam production, and the developments in emerging countries such as India, Japan, and China are expected to increase the caprolactam market in the Asia Pacific region. These factors are driving the growth of the global caprolactam market in the Asia Pacific region.

What is the regulatory landscape for the caprolactam market?

The governments are exploring a stricter regulatory approach across regions regarding the production and utilization of caprolactam. The governments are applying strict regulations on carbon emissions and the use of toxic chemicals, which cause harmful events in production facilities. Besides, the government supports caprolactam production due to its efficiency and reduced carbon emissions.

What is the market size of caprolactam in terms of value?

The global caprolactam market is anticipated to grow at a substantial CAGR of 3.70% in the upcoming years. The global caprolactam market industry was estimated to be worth USD 14.8 Billion in 2021 and was expected to be worth USD 18.40 Billion by 2028.

Shape Your Report to Specific Countries or Regions & Enjoy 30% Off!

What are the major players’ plans for the future of the caprolactam market?

The leading market players in the global caprolactam market are applying various important strategies, including product launches, partnerships, mergers, and acquisitions, which support the market expansion of caprolactam. For instance, in 2018, Project EFFECTIVE, a multi-company partnership to create more environmentally friendly fibers and plastics for commercial usage using renewable feedstocks and biobased technologies, was launched by Aquafil and Genomatica. Project EFFECTIVE, which has 12 firms as participants and includes well-known names like H&M, Carvico, Vaude, and Balsan, is one of the largest industrially-driven initiatives to change entire product value chains and promote economic growth.

Segmentation of Global Caprolactam Market-

Global Caprolactam Market – By Raw Material

  • Benzene
  • Hydroxylamine sulfate
  • Cyclohexane
  • Phenol
  • Ammonia

Global Caprolactam Market – By Application

  • Nylon 6 filaments
  • Textile Yarn
  • Nylon 6 fibers
  • Engineering plastics
  • Printer inks
  • Others

Global Caprolactam Market – By End-Use

  • Textile industry
  • Automobile industry
  • Electrical and Electronics Industry
  • Others

Global Caprolactam Market – By Region

  • North America
    • US
    • Canada
  • Europe
    • Germany
    • France
    • UK.
    • Italy
    • Spain
    • Rest of Europe
  • Asia Pacific
    • China
    • Japan
    • India
    • South Korea
    • South-east Asia
    • Rest of Asia Pacific
  • Latin America
    • Brazil
    • Mexico
    • Rest of Latin America
  • Middle East & Africa
    • GCC Countries
    • South Africa
    • Rest of Middle East and Africa

1. Preface
1.1. Report Description
1.1.1. Purpose of the Report
1.1.2. Target Audience
1.1.3. USP and Key Offerings
1.2. Research Scope
1.3. Research Methodology
1.3.1. Phase I – Secondary Research
1.3.2. Phase II – Primary Research
1.3.3. Phase III – Expert Panel Review
1.3.4. Approach Adopted
1.3.4.1. Top-Down Approach
1.3.4.2. Bottom-Up Approach
1.3.5. Assumptions
1.4. Market Segmentation

2. Executive Summary
2.1. Market Snapshot: Global Caprolactam Market
2.2. Global Caprolactam Market, By Raw Material Outlook
2.3. Global Caprolactam Market, By Application Outlook
2.4. Global Caprolactam Market, By End-Use Outlook
2.5. Global Caprolactam Market, By Region

3. Market Dynamics & Factors Analysis
3.1. Introduction
3.1.1. Global Caprolactam Market Value, 2016-2028, (US$ Bn)
3.2. Market Dynamics
3.2.1. Key Growth Trends
3.2.2. Market Drivers
3.2.3. Market Restraints
3.2.4. Market Opportunities
3.2.5. Major Industry Challenges
3.3. Attractive Investment Proposition,2021
3.3.1. Raw Material Outlook
3.3.2. Application Outlook
3.3.3. End-Use Outlook
3.3.4. Geography

4. Premium Insights
4.1. STAR (Situation, Task, Action, Results) Analysis
4.2. Porter’s Five Forces Analysis
4.2.1. Threat of New Entrants
4.2.2. Bargaining Power of Buyers/Consumers
4.2.3. Bargaining Power of Suppliers
4.2.4. Threat of Substitute Raw Material Outlooks
4.2.5. Intensity of Competitive Rivalry
4.3. Value Chain Analysis
4.4. Technology Analysis
4.5. Marketing Strategy Analysis
4.5.1. Direct Marketing
4.5.2. Indirect Marketing
4.5.3. Marketing Channel Development Trend

5. Market Positioning of Key Players, 2021
5.1. Company market share of key players, 2021
5.2. Competitive Benchmarking
5.3. Market Positioning of Key Vendors
5.4. Geographical Presence Analysis
5.5. Major Strategies Adopted By Key Players
5.5.1. Key Strategies Analysis
5.5.2. Mergers and Acquisitions
5.5.3. Partnerships
5.5.4. Product Launch
5.5.5. Geographical Expansion
5.5.6. Others

6. COVID 19 Impact Analysis
6.1. Global Caprolactam Market Pre Vs Post COVID 19, 2019 – 2028
6.2. Impact on Import & Export
6.3. Impact on Demand & Supply

7. Global Caprolactam Market
7.1. Global Caprolactam Market, By Raw Material Outlook, 2016-2028(US$ Bn)
7.1.1. Overview
7.1.2. Global Caprolactam Market, By Raw Material Outlook, 2021 vs 2028 (in%)
7.1.3. Global Caprolactam Market, By Benzene, 2016-2028 (US$ Bn)
7.1.4. Global Caprolactam Market, By Hydroxylamine sulfate, 2016-2028 (US$ Bn)
7.1.5. Global Caprolactam Market, By Cyclohexane, 2016-2028 (US$ Bn)
7.1.6. Global Caprolactam Market, By Phenol, 2016-2028 (US$ Bn)
7.1.7. Global Caprolactam Market, By Ammonia, 2016-2028 (US$ Bn)
7.2. Global Caprolactam Market, By Application Outlook, 2016-2028(US$ Bn)
7.2.1. Overview
7.2.2. Global Caprolactam Market, By Application Outlook, 2021 vs 2028 (in%)
7.2.3. Global Caprolactam Market, By Nylon 6 Filaments, 2016-2028 (US$ Bn)
7.2.4. Global Caprolactam Market, By Textile Yarn, 2016-2028 (US$ Bn)
7.2.5. Global Caprolactam Market, By Nylon 6 Fibres, 2016-2028 (US$ Bn)
7.2.6. Global Caprolactam Market, By Engineering plastics, 2016-2028 (US$ Bn)
7.2.7. Global Caprolactam Market, By Printer Inks, 2016-2028 (US$ Bn)
7.2.8. Global Caprolactam Market, By Others, 2016-2028 (US$ Bn)
7.3. Global Caprolactam Market, By End-Use Outlook, 2016-2028(US$ Bn)
7.3.1. Overview
7.3.2. Global Caprolactam Market, By End-Use Outlook, 2021 vs 2028 (in%)
7.3.3. Global Caprolactam Market, By Textile Industry, 2016-2028 (US$ Bn)
7.3.4. Global Caprolactam Market, By Automobile Industry, 2016-2028 (US$ Bn)
7.3.5. Global Caprolactam Market, By Electrical and Electronics Industry, 2016-2028 (US$ Bn)
7.4. Global Caprolactam Market, By Others, 2016-2028 (US$ Bn)

8. North America Caprolactam Market Analysis
8.1. North America Caprolactam Market, By Raw Material Outlook, 2016-2028(US$ Bn)
8.1.1. Overview
8.1.2. SRC Analysis
8.2. North America Caprolactam Market, By Application Outlook, 2016-2028(US$ Bn)
8.2.1. Overview
8.2.2. SRC Analysis
8.3. North America Caprolactam Market, By End-Use Outlook, 2016-2028(US$ Bn)
8.3.1. Overview
8.3.2. SRC Analysis
8.4. North America Caprolactam Market, By Country, 2016-2028 (US$ Bn)
8.4.1. U.S.
8.4.1.1. U.S. Caprolactam Market Estimates and Forecast, 2016-2028 (US$ Bn)
8.4.1.2. U.S. Caprolactam, By Raw Material Outlook, 2016-2028 (US$ Bn)
8.4.1.3. U.S. Caprolactam, By Application Outlook, 2016-2028 (US$ Bn)
8.4.1.4. U.S. Caprolactam, By End-Use Outlook, 2016-2028 (US$ Bn)
8.4.2. Canada
8.4.2.1. Canada Caprolactam Market Estimates and Forecast, 2016-2028 (US$ Bn)
8.4.2.2. Canada Caprolactam, By Raw Material Outlook, 2016-2028 (US$ Bn)
8.4.2.3. Canada Caprolactam, By Application Outlook, 2016-2028 (US$ Bn)
8.4.2.4. Canada Caprolactam, By End-Use Outlook, 2016-2028 (US$ Bn)

9. Europe Caprolactam Market Analysis
9.1. Europe Caprolactam Market, By Raw Material Outlook, 2016-2028(US$ Bn)
9.1.1. Overview
9.1.2. SRC Analysis
9.2. Europe Caprolactam Market, By Application Outlook, 2016-2028(US$ Bn)
9.2.1. Overview
9.2.2. SRC Analysis
9.3. Europe Caprolactam Market, By End-Use Outlook, 2016-2028(US$ Bn)
9.3.1. Overview
9.3.2. SRC Analysis
9.4. Europe Caprolactam Market, By Country, 2016-2028 (US$ Bn)
9.4.1. Germany
9.4.1.1. Germany Caprolactam Market Estimates and Forecast, 2016-2028 (US$ Bn)
9.4.1.2. Germany Caprolactam, By Raw Material Outlook, 2016-2028 (US$ Bn)
9.4.1.3. Germany Caprolactam, By Application Outlook, 2016-2028 (US$ Bn)
9.4.2. Germany Caprolactam, By End-Use Outlook, 2016-2028 (US$ Bn)
9.4.3. France
9.4.3.1. France Caprolactam Market Estimates and Forecast, 2016-2028 (US$ Bn)
9.4.3.2. France Caprolactam, By Raw Material Outlook, 2016-2028 (US$ Bn)
9.4.3.3. France Caprolactam, By Application Outlook, 2016-2028 (US$ Bn)
9.4.3.4. France Caprolactam, By End-Use Outlook, 2016-2028 (US$ Bn)
9.4.4. UK
9.4.4.1. UK Caprolactam Market Estimates and Forecast, 2016-2028 (US$ Bn)
9.4.4.2. UK Caprolactam, By Raw Material Outlook, 2016-2028 (US$ Bn)
9.4.4.3. UK Caprolactam, By Application Outlook, 2016-2028 (US$ Bn)
9.4.4.4. UK Caprolactam, By End-Use Outlook, 2016-2028 (US$ Bn)
9.4.5. Italy
9.4.5.1. Italy Caprolactam Market Estimates and Forecast, 2016-2028 (US$ Bn)
9.4.5.2. Italy Caprolactam, By Raw Material Outlook, 2016-2028 (US$ Bn)
9.4.5.3. Italy Caprolactam, By Application Outlook, 2016-2028 (US$ Bn)
9.4.5.4. Italy Caprolactam, By End-Use Outlook, 2016-2028 (US$ Bn)
9.4.6. Spain
9.4.6.1. Spain Caprolactam Market Estimates and Forecast, 2016-2028 (US$ Bn)
9.4.6.2. Spain Caprolactam, By Raw Material Outlook, 2016-2028 (US$ Bn)
9.4.6.3. Spain Caprolactam, By Application Outlook, 2016-2028 (US$ Bn)
9.4.6.4. Spain Caprolactam, By End-Use Outlook, 2016-2028 (US$ Bn)
9.4.7. Rest of Europe
9.4.7.1. Rest of Europe Caprolactam Market Estimates and Forecast, 2016-2028 (US$ Bn)
9.4.7.2. Rest of Europe Caprolactam, By Raw Material Outlook, 2016-2028 (US$ Bn)
9.4.7.3. Rest of Europe Caprolactam, By Application Outlook, 2016-2028 (US$ Bn)
9.4.7.4. Rest of Europe Caprolactam, By End-Use Outlook, 2016-2028 (US$ Bn)

10. Asia Pacific Caprolactam Market Analysis
10.1. Asia Pacific Caprolactam Market, By Raw Material Outlook, 2016-2028(US$ Bn)
10.1.1. Overview
10.1.2. SRC Analysis
10.2. Asia Pacific Caprolactam Market, By Application Outlook, 2016-2028(US$ Bn)
10.2.1. Overview
10.2.2. SRC Analysis
10.3. Asia Pacific Caprolactam Market, By End-Use Outlook, 2016-2028(US$ Bn)
10.3.1. Overview
10.3.2. SRC Analysis
10.4. Asia Pacific Caprolactam Market, By Country, 2016-2028 (US$ Bn)
10.4.1. China
10.4.1.1. China Caprolactam Market Estimates and Forecast, 2016-2028 (US$ Bn)
10.4.1.2. China Caprolactam, By Raw Material Outlook, 2016-2028 (US$ Bn)
10.4.1.3. China Caprolactam, By Application Outlook, 2016-2028 (US$ Bn)
10.4.1.4. China Caprolactam, By End-Use Outlook, 2016-2028 (US$ Bn)
10.4.2. Japan
10.4.2.1. Japan Caprolactam Market Estimates and Forecast, 2016-2028 (US$ Bn)
10.4.2.2. Japan Caprolactam, By Raw Material Outlook, 2016-2028 (US$ Bn)
10.4.2.3. Japan Caprolactam, By Application Outlook, 2016-2028 (US$ Bn)
10.4.2.4. Japan Caprolactam, By End-Use Outlook, 2016-2028 (US$ Bn)
10.4.3. India
10.4.3.1. India Caprolactam Market Estimates and Forecast, 2016-2028 (US$ Bn)
10.4.3.2. India Caprolactam, By Raw Material Outlook, 2016-2028 (US$ Bn)
10.4.3.3. India Caprolactam, By Application Outlook, 2016-2028 (US$ Bn)
10.4.3.4. India Caprolactam, By End-Use Outlook, 2016-2028 (US$ Bn)
10.4.4. South Korea
10.4.4.1. South Korea Caprolactam Market Estimates and Forecast, 2016-2028 (US$ Bn)
10.4.4.2. South Korea Caprolactam, By Raw Material Outlook, 2016-2028 (US$ Bn)
10.4.4.3. South Korea Caprolactam, By Application Outlook, 2016-2028 (US$ Bn)
10.4.4.4. South Korea Caprolactam, By End-Use Outlook, 2016-2028 (US$ Bn)
10.4.5. South-East Asia
10.4.5.1. South-East Asia Caprolactam Market Estimates and Forecast, 2016-2028 (US$ Bn)
10.4.5.2. South-East Asia Caprolactam, By Raw Material Outlook, 2016-2028 (US$ Bn)
10.4.5.3. South-East Asia Caprolactam, By Application Outlook, 2016-2028 (US$ Bn)
10.4.5.4. South-East Asia Caprolactam, By End-Use Outlook, 2016-2028 (US$ Bn)
10.4.6. Rest of Asia Pacific
10.4.6.1. Rest of Asia Pacific Caprolactam Market Estimates and Forecast, 2016-2028 (US$ Bn)
10.4.6.2. Rest of Asia Pacific Caprolactam, By Raw Material Outlook, 2016-2028 (US$ Bn)
10.4.6.3. Rest of Asia Pacific Caprolactam, By Application Outlook, 2016-2028 (US$ Bn)
10.4.6.4. Rest of Asia Pacific Caprolactam, By End-Use Outlook, 2016-2028 (US$ Bn)

11. Latin America Caprolactam Market Analysis
11.1. Latin America Caprolactam Market, By Raw Material Outlook, 2016-2028(US$ Bn)
11.1.1. Overview
11.1.2. SRC Analysis
11.2. Latin America Caprolactam Market, By Application Outlook, 2016-2028(US$ Bn)
11.2.1. Overview
11.2.2. SRC Analysis
11.3. Latin America Caprolactam Market, By End-Use Outlook, 2016-2028(US$ Bn)
11.3.1. Overview
11.3.2. SRC Analysis
11.4. Latin America Caprolactam Market, By Country, 2016-2028 (US$ Bn)
11.4.1. Brazil
11.4.1.1. Brazil Caprolactam Market Estimates and Forecast, 2016-2028 (US$ Bn)
11.4.1.2. Brazil Caprolactam, By Raw Material Outlook, 2016-2028 (US$ Bn)
11.4.1.3. Brazil Caprolactam, By Application Outlook, 2016-2028 (US$ Bn)
11.4.1.4. Brazil Caprolactam, By End-Use Outlook, 2016-2028 (US$ Bn)
11.4.2. Mexico
11.4.2.1. Mexico Caprolactam Market Estimates and Forecast, 2016-2028 (US$ Bn)
11.4.2.2. Mexico Caprolactam, By Raw Material Outlook, 2016-2028 (US$ Bn)
11.4.2.3. Mexico Caprolactam, By Application Outlook, 2016-2028 (US$ Bn)
11.4.2.4. Mexico Caprolactam, By End-Use Outlook, 2016-2028 (US$ Bn)
11.4.3. Rest of Latin America
11.4.3.1. Rest of Latin America Caprolactam Market Estimates and Forecast, 2016-2028 (US$ Bn)
11.4.3.2. Rest of Latin America Caprolactam, By Raw Material Outlook, 2016-2028 (US$ Bn)
11.4.3.3. Rest of Latin America Caprolactam, By Application Outlook, 2016-2028 (US$ Bn)
11.4.3.4. Rest of Latin America Caprolactam, By End-Use Outlook, 2016-2028 (US$ Bn)

12. Middle East and Africa Caprolactam Market Analysis
12.1. Middle East and Africa Caprolactam Market, By Raw Material Outlook, 2016-2028(US$ Bn)
12.1.1. Overview
12.1.2. SRC Analysis
12.2. Middle East and Africa Caprolactam Market, By Application Outlook, 2016-2028(US$ Bn)
12.2.1. Overview
12.2.2. SRC Analysis
12.3. Middle East and Africa Caprolactam Market, By End-Use Outlook, 2016-2028(US$ Bn)
12.3.1. Overview
12.3.2. SRC Analysis
12.4. Middle East and Africa Caprolactam Market, By Country, 2016-2028 (US$ Bn)
12.4.1. GCC Countries
12.4.1.1. GCC Countries Caprolactam Market Estimates and Forecast, 2016-2028 (US$ Bn)
12.4.1.2. GCC Countries Caprolactam, By Raw Material Outlook, 2016-2028 (US$ Bn)
12.4.1.3. GCC Countries Caprolactam, By Application Outlook, 2016-2028 (US$ Bn)
12.4.1.4. GCC Countries Caprolactam, By End-Use Outlook, 2016-2028 (US$ Bn)
12.4.2. South Africa
12.4.2.1. South Africa Caprolactam Market Estimates and Forecast, 2016-2028 (US$ Bn)
12.4.2.2. South Africa Caprolactam, By Raw Material Outlook, 2016-2028 (US$ Bn)
12.4.2.3. South Africa Caprolactam, By Application Outlook, 2016-2028 (US$ Bn)
12.4.2.4. South Africa Caprolactam, By End-Use Outlook, 2016-2028 (US$ Bn)
12.4.3. Rest of Middle East and Africa
12.4.3.1. Rest of Middle East and Africa Caprolactam Market Estimates and Forecast, 2016-2028 (US$ Bn)
12.4.3.2. Rest of Middle East and Africa Caprolactam, By Raw Material Outlook, 2016-2028 (US$ Bn)
12.4.3.3. Rest of Middle East and Africa Caprolactam, By Application Outlook, 2016-2028 (US$ Bn)
12.4.3.4. Rest of Middle East and Africa Caprolactam, By End-Use Outlook, 2016-2028 (US$ Bn)

13. Company Profiles
13.1. Siemens (Germany)
13.1.1. Company Overview
13.1.2. Products/Services Portfolio
13.1.3. Geographical Presence
13.1.4. Financial Summary
13.1.4.1. Market Revenue and Net Profit (2019-2021)
13.1.4.2. Business Segment Revenue Analysis
13.1.4.3. Geographical Revenue Analysis
13.2. BASF SE
13.3. Merck KGAA
13.4. Fertiliser and Chemicals Travancore (FACT)
13.5. LTD.
13.6. UBE Corporation
13.7. Domo Chemicals
13.8. LANXESS AG
13.9. Advansix Inc.
13.10. Reullei Pharmaceutical Technology Co.
13.11. Ltd.
13.12. Fibrant
13.13. Luxi Chemical Group Co
13.14. Ltd

List of Figures

Global Caprolactam Market: Research Methodology
FIG. 2 Market Size Estimation – Top Down & Bottom up Approach
FIG. 3 Global Caprolactam Market Segmentation
FIG. 4 Global Caprolactam Market, By Raw Material Outlook, 2021 (US$ Bn)
FIG. 5 Global Caprolactam Market, By Application Outlook, 2021 (US$ Bn)
FIG. 6 Global Caprolactam Market, By End-Use Outlook, 2021 (US$ Bn)
FIG. 7 Global Caprolactam Market, By Geography, 2021 (US$ Bn)
FIG. 8 Attractive Investment Proposition, By Raw Material Outlook, 2021
FIG. 9 Attractive Investment Proposition, By Application Outlook, 2021
FIG. 10 Attractive Investment Proposition, By End-Use Outlook, 2021
FIG. 11 Attractive Investment Proposition, By Geography, 2021
FIG. 12 Global Market Share Analysis of Key Caprolactam Market Manufacturers, 2021
FIG. 13 Global Market Positioning of Key Caprolactam Market Manufacturers, 2021
FIG. 14 Global Caprolactam Market Value Contribution, By Raw Material Outlook, 2021 & 2028 (Value %)
FIG. 15 Global Caprolactam Market, By Benzene, Value, 2016-2028 (US$ Bn)
FIG. 16 Global Caprolactam Market, By Hydroxylamine sulfate, Value, 2016-2028 (US$ Bn)
FIG. 17 Global Caprolactam Market, By Cyclohexane, Value, 2016-2028 (US$ Bn)
FIG. 18 Global Caprolactam Market, By Phenol, Value, 2016-2028 (US$ Bn)
FIG. 19 Global Caprolactam Market, By Ammonia, Value, 2016-2028 (US$ Bn)
FIG. 20 Global Caprolactam Market Value Contribution, By Application Outlook, 2021 & 2028 (Value %)
FIG. 21 Global Caprolactam Market, By Nylon 6 Filaments, Value, 2016-2028 (US$ Bn)
FIG. 22 Global Caprolactam Market, By Textile Yarn, Value, 2016-2028 (US$ Bn)
FIG. 23 Global Caprolactam Market, By Nylon 6 Fibers, Value, 2016-2028 (US$ Bn)
FIG. 24 Global Caprolactam Market, By Engineering Plastics, Value, 2016-2028 (US$ Bn)
FIG. 25 Global Caprolactam Market, By Printer Inks, Value, 2016-2028 (US$ Bn)
FIG. 26 Global Caprolactam Market, By Others, Value, 2016-2028 (US$ Bn)
FIG. 27 Global Caprolactam Market Value Contribution, By End-Use Outlook, 2021 & 2028 (Value %)
FIG. 28 Global Caprolactam Market, By Textile Industry, Value, 2016-2028 (US$ Bn)
FIG. 29 Global Caprolactam Market, By Automobile Industry, Value, 2016-2028 (US$ Bn)
FIG. 30 Global Caprolactam Market, By Electrical and Electronics Industry, Value, 2016-2028 (US$ Bn)
FIG. 31 Global Caprolactam Market, By Others, Value, 2016-2028 (US$ Bn)
FIG. 32 U.S. Caprolactam Market, 2016-2028 (US$ Bn)
FIG. 33 Canada Caprolactam Market, 2016-2028 (US$ Bn)
FIG. 34 Germany Caprolactam Market, 2016-2028 (US$ Bn)
FIG. 35 France Caprolactam Market, 2016-2028 (US$ Bn)
FIG. 36 U.K. Caprolactam Market, 2016-2028 (US$ Bn)
FIG. 37 Italy Caprolactam Market, 2016-2028 (US$ Bn)
FIG. 38 Spain Caprolactam Market, 2016-2028 (US$ Bn)
FIG. 39 Rest of Europe Caprolactam Market, 2016-2028 (US$ Bn)
FIG. 40 China Caprolactam Market, 2016-2028 (US$ Bn)
FIG. 41 Japan Caprolactam Market, 2016-2028 (US$ Bn)
FIG. 42 India Caprolactam Market, 2016-2028 (US$ Bn)
FIG. 43 South Korea Caprolactam Market, 2016-2028 (US$ Bn)
FIG. 44 Southeast Asia Caprolactam Market, 2016-2028 (US$ Bn)
FIG. 45 Rest of Asia Pacific Caprolactam Market, 2016-2028 (US$ Bn)
FIG. 46 Latin America Caprolactam Market, 2016-2028 (US$ Bn)
FIG. 47 Brazil Caprolactam Market, 2016-2028 (US$ Bn)
FIG. 48 Mexico Caprolactam Market, 2016-2028 (US$ Bn)
FIG. 49 Rest of Latin America Caprolactam Market, 2016-2028 (US$ Bn)
FIG. 50 Middle East & Africa Caprolactam Market, 2016-2028 (US$ Bn)
FIG. 51 GCC Countries Caprolactam Market, 2016-2028 (US$ Bn)
FIG. 52 South Africa Caprolactam Market, 2016-2028 (US$ Bn)
FIG. 53 Rest of Middle East and Africa Caprolactam Market, 2016-2028 (US$ Bn)

List of Tables

TABLE 1 Market Snapshot: Global Caprolactam Market
TABLE 2 Global Caprolactam Market, By Competitive Benchmarking, 2021
TABLE 3 Global Caprolactam Market, By Geographical Presence Analysis, 2021
TABLE 4 Global Caprolactam Market, By Key Strategies Analysis, 2021
TABLE 5 Global Caprolactam Market, By Raw Material Outlook, 2016-2028 (US$ Bn)
TABLE 6 Global Caprolactam Market, By Application Outlook, 2016-2028 (US$ Bn)
TABLE 7 Global Caprolactam Market, By End-Use Outlook, 2016-2028 (US$ Bn)
TABLE 8 Global Caprolactam Market, By Geography, 2016-2028 (US$ Bn)
TABLE 9 North America Caprolactam Market, By Raw Material Outlook, 2016-2028 (US$ Bn)
TABLE 10 North America Caprolactam Market, By Application Outlook, 2016-2028 (US$ Bn)
TABLE 11 North America Caprolactam Market, By End-Use Outlook, 2016-2028 (US$ Bn)
TABLE 12 North America Caprolactam Market, By Country, 2016-2028 (US$ Bn)
TABLE 13 US Caprolactam Market, By Raw Material Outlook, 2016-2028 (US$ Bn)
TABLE 14 US Caprolactam Market, By Application Outlook, 2016-2028 (US$ Bn)
TABLE 15 US Caprolactam Market, By End-Use Outlook, 2016-2028 (US$ Bn)
TABLE 16 Canada Caprolactam Market, By Raw Material Outlook, 2016-2028 (US$ Bn)
TABLE 17 Canada Caprolactam Market, By Application Outlook, 2016-2028 (US$ Bn)
TABLE 18 Canada Caprolactam Market, By End-Use Outlook, 2016-2028 (US$ Bn)
TABLE 19 Europe Caprolactam Market, By Raw Material Outlook, 2016-2028 (US$ Bn)
TABLE 20 Europe Caprolactam Market, By Application Outlook, 2016-2028 (US$ Bn)
TABLE 21 Europe Caprolactam Market, By End-Use Outlook, 2016-2028 (US$ Bn)
TABLE 22 Europe Caprolactam Market, By Country, 2016-2028 (US$ Bn)
TABLE 23 Germany Caprolactam Market, By Raw Material Outlook, 2016-2028 (US$ Bn)
TABLE 24 Germany Caprolactam Market, By Application Outlook, 2016-2028 (US$ Bn)
TABLE 25 Germany Caprolactam Market, By End-Use Outlook, 2016-2028 (US$ Bn)
TABLE 26 France Caprolactam Market, By Raw Material Outlook, 2016-2028 (US$ Bn)
TABLE 27 France Caprolactam Market, By Application Outlook, 2016-2028 (US$ Bn)
TABLE 28 France Caprolactam Market, By End-Use Outlook, 2016-2028 (US$ Bn)
TABLE 29 UK Caprolactam Market, By Raw Material Outlook, 2016-2028 (US$ Bn)
TABLE 30 UK Caprolactam Market, By Application Outlook, 2016-2028 (US$ Bn)
TABLE 31 UK Caprolactam Market, By End-Use Outlook, 2016-2028 (US$ Bn)
TABLE 32 Italy Caprolactam Market, By Raw Material Outlook, 2016-2028 (US$ Bn)
TABLE 33 Italy Caprolactam Market, By Application Outlook, 2016-2028 (US$ Bn)
TABLE 34 Italy Caprolactam Market, By End-Use Outlook, 2016-2028 (US$ Bn)
TABLE 35 Spain Caprolactam Market, By Raw Material Outlook, 2016-2028 (US$ Bn)
TABLE 36 Spain Caprolactam Market, By Application Outlook, 2016-2028 (US$ Bn)
TABLE 37 Spain Caprolactam Market, By End-Use Outlook, 2016-2028 (US$ Bn)
TABLE 38 Rest of Europe Caprolactam Market, By Raw Material Outlook, 2016-2028 (US$ Bn)
TABLE 39 Rest of Europe Caprolactam Market, By Application Outlook, 2016-2028 (US$ Bn)
TABLE 40 Rest of Europe Caprolactam Market, By End-Use Outlook, 2016-2028 (US$ Bn)
TABLE 41 Asia Pacific Caprolactam Market, By Raw Material Outlook, 2016-2028 (US$ Bn)
TABLE 42 Asia Pacific Caprolactam Market, By Application Outlook, 2016-2028 (US$ Bn)
TABLE 43 Asia Pacific Caprolactam Market, By End-Use Outlook, 2016-2028 (US$ Bn)
TABLE 44 Asia Pacific Caprolactam Market, By Country, 2016-2028 (US$ Bn)
TABLE 45 China Caprolactam Market, By Raw Material Outlook, 2016-2028 (US$ Bn)
TABLE 46 China Caprolactam Market, By Application Outlook, 2016-2028 (US$ Bn)
TABLE 47 China Caprolactam Market, By End-Use Outlook, 2016-2028 (US$ Bn)
TABLE 48 Japan Caprolactam Market, By Raw Material Outlook, 2016-2028 (US$ Bn)
TABLE 49 Japan Caprolactam Market, By Application Outlook, 2016-2028 (US$ Bn)
TABLE 50 Japan Caprolactam Market, By End-Use Outlook, 2016-2028 (US$ Bn)
TABLE 51 India Caprolactam Market, By Raw Material Outlook, 2016-2028 (US$ Bn)
TABLE 52 India Caprolactam Market, By Application Outlook, 2016-2028 (US$ Bn)
TABLE 53 India Caprolactam Market, By End-Use Outlook, 2016-2028 (US$ Bn)
TABLE 54 South Korea Caprolactam Market, By Raw Material Outlook, 2016-2028 (US$ Bn)
TABLE 55 South Korea Caprolactam Market, By Application Outlook, 2016-2028 (US$ Bn)
TABLE 56 South Korea Caprolactam Market, By End-Use Outlook, 2016-2028 (US$ Bn)
TABLE 57 South East Asia Caprolactam Market, By Raw Material Outlook, 2016-2028 (US$ Bn)
TABLE 58 South East Asia Caprolactam Market, By Application Outlook, 2016-2028 (US$ Bn)
TABLE 59 South East Asia Caprolactam Market, By End-Use Outlook, 2016-2028 (US$ Bn)
TABLE 60 Rest of Asia Pacific Caprolactam Market, By Raw Material Outlook, 2016-2028 (US$ Bn)
TABLE 61 Rest of Asia Pacific Caprolactam Market, By Application Outlook, 2016-2028 (US$ Bn)
TABLE 62 Rest of Asia Pacific Caprolactam Market, By End-Use Outlook, 2016-2028 (US$ Bn)
TABLE 63 Latin America Caprolactam Market, By Raw Material Outlook, 2016-2028 (US$ Bn)
TABLE 64 Latin America Caprolactam Market, By Application Outlook, 2016-2028 (US$ Bn)
TABLE 65 Latin America Caprolactam Market, By End-Use Outlook, 2016-2028 (US$ Bn)
TABLE 66 Latin America Caprolactam Market, By Country, 2016-2028 (US$ Bn)
TABLE 67 Brazil Caprolactam Market, By Raw Material Outlook, 2016-2028 (US$ Bn)
TABLE 68 Brazil Caprolactam Market, By Application Outlook, 2016-2028 (US$ Bn)
TABLE 69 Brazil Caprolactam Market, By End-Use Outlook, 2016-2028 (US$ Bn)
TABLE 70 Mexico Caprolactam Market, By Raw Material Outlook, 2016-2028 (US$ Bn)
TABLE 71 Mexico Caprolactam Market, By Application Outlook, 2016-2028 (US$ Bn)
TABLE 72 Mexico Caprolactam Market, By End-Use Outlook, 2016-2028 (US$ Bn)
TABLE 73 Rest of Latin America Caprolactam Market, By Raw Material Outlook, 2016-2028 (US$ Bn)
TABLE 74 Rest of Latin America Caprolactam Market, By Application Outlook, 2016-2028 (US$ Bn)
TABLE 75 Rest of Latin America Caprolactam Market, By End-Use Outlook, 2016-2028 (US$ Bn)
TABLE 76 Middle East and Africa Caprolactam Market, By Raw Material Outlook, 2016-2028 (US$ Bn)
TABLE 77 Middle East and Africa Caprolactam Market, By Application Outlook, 2016-2028 (US$ Bn)
TABLE 78 Middle East and Africa Caprolactam Market, By End-Use Outlook, 2016-2028 (US$ Bn)
TABLE 79 Middle East and Africa Caprolactam Market, By Country, 2016-2028 (US$ Bn)
TABLE 80 GCC Countries Caprolactam Market, By Raw Material Outlook, 2016-2028 (US$ Bn)
TABLE 81 GCC Countries Caprolactam Market, By Application Outlook, 2016-2028 (US$ Bn)
TABLE 82 GCC Countries Caprolactam Market, By End-Use Outlook, 2016-2028 (US$ Bn)
TABLE 83 South Africa Caprolactam Market, By Raw Material Outlook, 2016-2028 (US$ Bn)
TABLE 84 South Africa Caprolactam Market, By Application Outlook, 2016-2028 (US$ Bn)
TABLE 85 South Africa Caprolactam Market, By End-Use Outlook, 2016-2028 (US$ Bn)
TABLE 86 Rest of Middle East and Africa Caprolactam Market, By Raw Material Outlook, 2016-2028 (US$ Bn)
TABLE 87 Rest of Middle East and Africa Caprolactam Market, By Application Outlook, 2016-2028 (US$ Bn)
TABLE 88 Rest of Middle East and Africa Caprolactam Market, By End-Use Outlook, 2016-2028 (US$ Bn)

Frequently Asked Questions

Which region will contribute notably towards the caprolactam market value?

North America accounted for the highest market share in 2021 of the global caprolactam market.

Which key factors will influence the caprolactam market growth?

The increasing adoption of nylon fabrics is driving the growth of the caprolactam market.

Which is the major raw material segment in the caprolactam market?

In 2021, the cyclohexane segment dominated the largest share of the market.

Which is the major application segment in the caprolactam market?

In 2021, the nylon 6 filaments segment dominated the largest share of the market.

Which is the major end use segment in the caprolactam market?

In 2021, the textile segment dominated the largest share of the market.

Cosmetic Ingredients Market

Published:
Report ID: 3703

Hydrocolloids Market

Published:
Report ID: 36265

Ion Exchange Resins Market

Published:
Report ID: 36220

Herbal Extract Market

Published:
Report ID: 36211

Fiber Reinforced Polymer (FRP) Composites Market

Published:
Report ID: 36197

Bio-based Polycarbonate Market

Published:
Report ID: 36188

Middle East and Africa Carbon Black Market

Published:
Report ID: 36181

India Thermic Fluids Market

Published:
Report ID: 36178

Europe Green Hydrogen Market

Published:
Report ID: 36175

Dodecanedioic Acid Market

Published:
Report ID: 36167

Asia Pacific Nickel Mining Market

Published:
Report ID: 36084

Asphalt Additives Market

Published:
Report ID: 36074

Purchase Options

$2999
Delivery Format: Excel.
$4999
Designed for the individual purchaser.
$6999
Users located at a single corporate site or regional office.
$7999
Allowed for unlimited sharing globally within one company.
Smallform of Sample request

Have a question?

User Profile

Don’t settle for less – trust Mitul to help you find the best solution.

Report delivery within 24 to 48 hours

– Other Info –

What people say?-

User Review

I am very impressed with the information in this report. The author clearly did their research when they came up with this product and it has already given me a lot of ideas.

Jana Schmidt
CEDAR CX Technologies

– Connect with us –

Phone

+91 6232 49 3207


support

24/7 Research Support


sales@credenceresearch.com

– Research Methodology –

Going beyond the basics: advanced techniques in research methodology

– Trusted By –

Pepshi, LG, Nestle
Motorola, Honeywell, Johnson and johnson
LG Chem, SIEMENS, Pfizer
Unilever, Samsonite, QIAGEN