
Market Overview
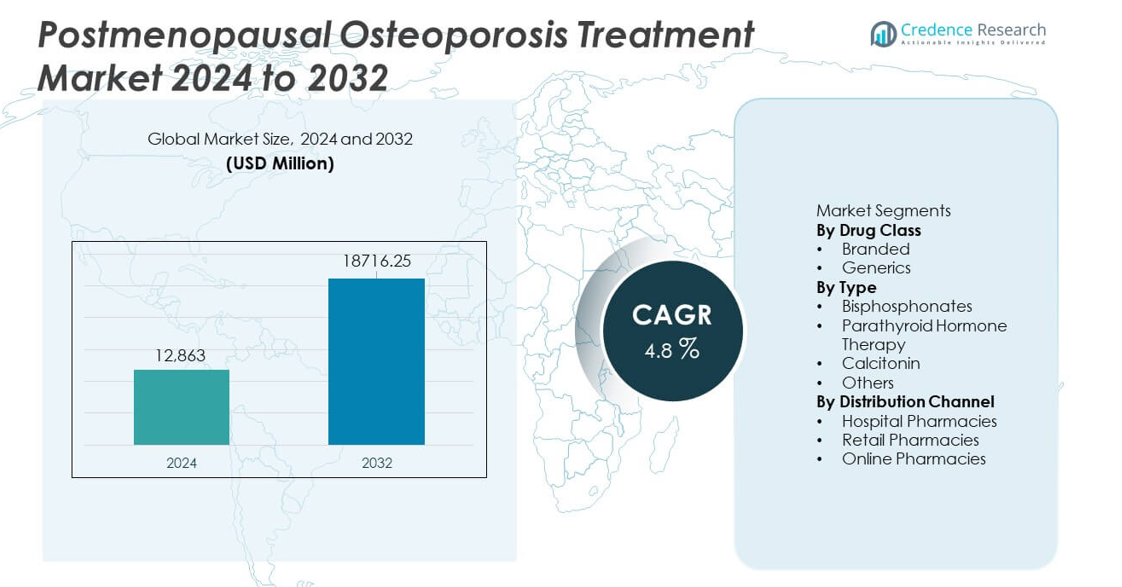
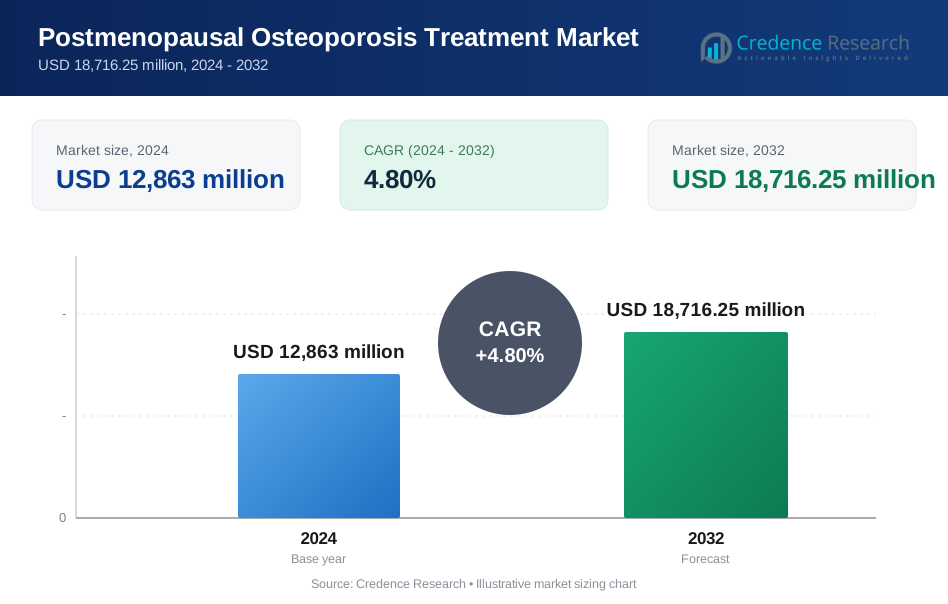
The Postmenopausal Osteoporosis Treatment Market was valued at USD 12,863 million in 2024 and is projected to reach USD 18,716.25 million by 2032, registering a CAGR of 4.8% during the forecast period.
| REPORT ATTRIBUTE | DETAILS |
|---|---|
| Historical Period | 2020-2023 |
| Base Year | 2024 |
| Forecast Period | 2025-2032 |
| Postmenopausal Osteoporosis Treatment Market Size 2024 | USD 12,863 million |
| Postmenopausal Osteoporosis Treatment Market, CAGR | 4.8% |
| Postmenopausal Osteoporosis Treatment Market Size 2032 | USD 18,716.25 million |
Top players in the Postmenopausal Osteoporosis Treatment market include Amgen Inc., Eli Lilly and Company, Novartis AG, F. Hoffmann-La Roche Ltd., Merck & Co., Inc., Pfizer Inc., GlaxoSmithKline plc, Teva Pharmaceutical Industries Ltd., Radius Health, Inc., and Astellas Pharma Inc. These companies lead through strong portfolios in biologics, bisphosphonates, and hormone-based therapies that support fracture prevention and long-term bone health. North America stands as the leading region with a 38% market share due to high diagnosis rates, strong adoption of advanced therapies, and well-established reimbursement systems. Europe follows with a 29% share, supported by structured screening programs and specialist-driven care networks.
Market Insights
- The market reached USD 12,863 million in 2024 and will grow at a 4.8% CAGR through 2032, driven by rising treatment adoption among postmenopausal women.
- Growing demand for branded drugs, which hold a 62% segment share, supports steady market expansion as clinicians prefer proven therapies for high fracture-risk patients.
- Trends such as wider screening and strong uptake of bisphosphonates, which lead the type segment with a 54% share, improve early diagnosis and treatment adherence.
- Key players strengthen competitiveness through biologics, long-acting injectables, and strategic partnerships, while challenges include low long-term adherence and safety concerns.
- North America leads with a 38% share, followed by Europe at 29% and Asia Pacific at 23%, supported by varying levels of diagnostic access and adoption of advanced osteoporosis therapies.
Market Segmentation Analysis:
By Drug Class
Branded drugs hold the dominant share at 62% of the market due to strong clinical trust, wider physician adoption, and broad insurance coverage. These therapies offer proven fracture-risk reduction and long-term safety data, which strengthen adoption among postmenopausal women with high fracture risk. Branding also drives preference in severe cases that require advanced, targeted formulations. Generic drugs capture the remaining market as cost-effective options for stable patients. Demand for generics rises in regions with high price sensitivity, yet branded therapies continue to lead because prescribers prioritize validated outcomes and robust post-marketing evidence.
- For instance, Amgen reported that Prolia reduced new vertebral fractures from 7.2 cases per 100 patient-years to 2.3 cases per 100 patient-years in its FREEDOM trial, confirming long-term clinical reliability.
By Type
Bisphosphonates lead this segment with a 54% share, driven by wide availability, established safety profiles, and strong efficacy in increasing bone mineral density. Physicians prefer these drugs for first-line therapy due to their proven ability to reduce vertebral and non-vertebral fractures. Parathyroid hormone therapy expands adoption among patients with severe osteoporosis, while calcitonin maintains a smaller share due to limited comparative effectiveness. Other emerging therapies gain interest for improved dosing convenience. However, bisphosphonates retain dominance because they deliver reliable outcomes, longer treatment history, and strong guideline support.
- For instance, Merck’s Fosamax demonstrated a reduction in the rate of clinical fractures in the four-year study arm of the Fracture Intervention Trial (FIT), which enrolled women with low bone density but without existing vertebral fractures.
By Distribution Channel
Hospital pharmacies dominate the market with a 47% share as they handle high volumes of osteoporosis cases linked to fractures, emergency visits, and specialist-led treatment plans. These settings support rapid initiation of advanced therapies and ensure structured follow-up. Retail pharmacies capture significant demand through strong community access and chronic treatment refills. Online pharmacies grow due to rising digital adoption and home-delivery convenience but remain secondary for first-time prescriptions. Hospital pharmacies lead because patients often begin treatment after diagnostic evaluations or fracture-related admissions, driving sustained uptake within institutional channels.
Key Growth Driver
Rising Prevalence of Postmenopausal Osteoporosis
Growing life expectancy and an expanding postmenopausal population increase the number of women at high risk of fractures. Healthcare systems record more osteoporosis-related hospital visits, which drives stronger demand for preventive and therapeutic solutions. Earlier screening and improved diagnostic tools further support patient identification. Governments and health agencies promote awareness programs that encourage timely treatment. As fracture-related costs rise, clinicians emphasize early intervention to avoid long-term disability. These factors collectively fuel sustained adoption of advanced osteoporosis therapies.
- For instance, the International Osteoporosis Foundation reported that over 10 million hip fractures in people aged 55+ occurred globally in 2019, and Amgen recorded 7,808 clinical subjects enrolled in its foundational Prolia fracture reduction trial.
Advancements in Targeted and Hormonal Therapies
New drug classes provide improved bone regeneration and reduced fracture risk, attracting strong clinical support. Targeted biologics and parathyroid hormone analogs address severe cases with faster therapeutic response and stronger bone density improvements. Extended dosing intervals and improved safety profiles enhance patient adherence. Manufacturers invest in R&D to introduce next-generation agents with better tolerability. These innovations raise treatment standards and enable personalized therapy selection. Expanded clinical evidence strengthens physician confidence, boosting uptake across hospital and specialty care channels.
- For instance, Eli Lilly’s Forteo increased lumbar spine bone mineral density by approximately 9.7% in a controlled trial of 1,637 women and showed a vertebral fracture reduction supported by three-year follow-up data. The density change was reported as a percentage increase.
Increased Screening and Early Diagnosis
Broader access to bone density testing supports earlier detection of osteoporosis in postmenopausal women. Hospitals expand DXA scan availability, helping clinicians identify fracture-risk patients before symptom escalation. Public health campaigns emphasize preventive care, shifting treatment initiation to earlier stages. Insurers encourage screening to reduce long-term fracture-related expenses. Digital tools and automated risk calculators improve diagnostic accuracy. This push toward proactive monitoring drives stronger demand for both first-line and advanced therapies.
Key Trend & Opportunity
Expansion of Digital Health and Remote Monitoring
Digital platforms support better patient engagement, adherence tracking, and remote monitoring of therapy outcomes. Wearable sensors, fracture-risk assessment apps, and AI-driven tools help clinicians tailor treatment plans. Telehealth platforms expand access to endocrinology and rheumatology specialists. Online pharmacies enhance convenience for chronic medication needs. These tools improve long-term compliance, which is essential for osteoporosis management. As digital adoption rises, companies have new opportunities to integrate digital solutions alongside drug offerings for stronger patient retention.
- For instance, Pfizer uses digital tools and smart pill bottle pilot programs to help improve medication adherence and patient outcomes, with one such pilot for BOSULIF® (bosutinib) involving real-time data sharing with pharmacy teams to enable timely follow-up.
Growing Adoption of Combination and Long-Acting Therapies
Combination regimens gain traction as clinicians seek stronger and faster bone density improvements in high-risk patients. Long-acting injections and extended-interval formulations increase patient convenience and reduce missed doses. These treatment models support better adherence and sustained therapeutic effect. Research efforts focus on therapies that balance safety with stronger anabolic action. The trend creates room for companies to innovate across dosing formats and multi-mechanism approaches. As clinical guidelines evolve, demand for advanced and hybrid therapies is expected to grow.
- For instance, Radius Health reported that Tymlos increased lumbar spine bone density by approximately 12.8% in its ACTIVExtend study (following initial Tymlos treatment) in a relevant patient subgroup.
Key Challenge
Low Long-Term Treatment Adherence
Many patients discontinue therapy due to fear of side effects, complex dosing schedules, or lack of symptom visibility. Poor adherence reduces clinical benefit and increases fracture risk, placing strain on healthcare systems. Oral bisphosphonates often require strict intake procedures that discourage continuous use. Limited follow-up in community settings further affects compliance. Manufacturers and clinicians must address education gaps, simplify dosing, and improve real-time monitoring. Without stronger adherence strategies, therapy outcomes remain below optimal levels.
Safety Concerns and Treatment-Related Complications
Concerns such as rare jaw necrosis, atypical fractures, and gastrointestinal issues influence patient and physician decisions. These risks create hesitation around long-term use, especially for high-dose or extended regimens. Regulatory bodies maintain strict safety monitoring, slowing rapid uptake of newer agents. Clinicians must balance risk profiles with fracture-prevention benefits, which can delay therapy initiation. Safety-related debates also impact public perception of osteoporosis drugs. Manufacturers must continue refining formulations and providing clearer safety data to support wider adoption.
Regional Analysis
North America
North America holds the largest share at 38%, driven by strong healthcare access, high screening rates, and rapid adoption of advanced osteoporosis therapies. The region benefits from established reimbursement systems that support branded and innovative drug uptake. A large postmenopausal population increases demand for fracture-prevention treatments, while specialists promote early diagnosis through routine bone density tests. Biologics and long-acting therapies gain traction due to their proven efficacy. Ongoing clinical trials and strong involvement of major pharmaceutical companies further reinforce the region’s leadership in treatment adoption and technology development.
Europe
Europe accounts for a 29% share and benefits from structured screening programs, strong specialist networks, and rising awareness of fracture-prevention therapy. Countries with aging populations, such as Germany, Italy, and France, drive steady demand for both first-line and advanced treatments. Guidelines issued by regional health bodies encourage early intervention, increasing the use of bisphosphonates and anabolic agents. Reimbursement frameworks support access to long-acting injectable therapies. Growing investment in patient education and fracture liaison services also drives broader adoption across hospitals and outpatient centers.
Asia Pacific
Asia Pacific holds a 23% share and expands rapidly due to rising postmenopausal populations, improved diagnostic infrastructure, and growing adoption of fracture-prevention therapies. Urban hospitals increase DXA scan availability, helping clinicians detect osteoporosis earlier. Adoption of cost-effective generics supports wider access in developing countries, while premium biologics grow in advanced markets such as Japan, South Korea, and Australia. Lifestyle changes, reduced calcium intake, and increasing sedentary behavior raise fracture risk. Government health programs promoting early screening and treatment adherence further support regional growth.
Latin America
Latin America holds an 6% share, supported by improving healthcare access and rising awareness of postmenopausal bone-health risks. Countries such as Brazil and Mexico invest in diagnostic upgrades and public health campaigns to reduce fracture-related disability. Generic osteoporosis drugs see strong adoption due to affordability, while branded therapies gain traction in private care settings. Growing urban populations and rising healthcare spending support market expansion. However, limited screening coverage in rural areas slows early diagnosis. Expanding specialist availability continues to strengthen regional treatment uptake.
Middle East & Africa
The Middle East & Africa region holds a 4% share, driven by growing healthcare modernization and increased recognition of osteoporosis as a major public health concern. Higher life expectancy and rising postmenopausal populations increase fracture risk, creating demand for diagnosis and treatment. Wealthier Gulf nations adopt advanced biologics and long-acting therapies through strong specialist networks, while African markets rely more on generics. Limited diagnostic access restricts early detection in some areas. Ongoing investments in imaging infrastructure and chronic-disease programs support gradual market expansion.
Market Segmentations:
By Drug Class
- Branded
- Generics
By Type
- Bisphosphonates
- Parathyroid Hormone Therapy
- Calcitonin
- Others
By Distribution Channel
- Hospital Pharmacies
- Retail Pharmacies
- Online Pharmacies
By Geography
- North America
- U.S.
- Canada
- Mexico
- Europe
- Germany
- France
- U.K.
- Italy
- Spain
- Rest of Europe
- Asia Pacific
- China
- Japan
- India
- South Korea
- South-east Asia
- Rest of Asia Pacific
- Latin America
- Brazil
- Argentina
- Rest of Latin America
- Middle East & Africa
- GCC Countries
- South Africa
- Rest of the Middle East and Africa
Competitive Landscape
The competitive landscape features major players such as Amgen Inc., Eli Lilly and Company, Novartis AG, F. Hoffmann-La Roche Ltd., Merck & Co., Inc., Pfizer Inc., GlaxoSmithKline plc, Teva Pharmaceutical Industries Ltd., Radius Health, Inc., and Astellas Pharma Inc. These companies compete through innovation in biologics, long-acting injectables, and hormone-based therapies that improve adherence and fracture-risk reduction. Firms invest in expanded clinical trials to validate safety and real-world effectiveness, strengthening physician confidence. Strategic moves include partnerships with research institutions, acquisitions of emerging biotech firms, and product-line expansions targeting high-risk postmenopausal populations. Companies also focus on lifecycle management, including reformulated dosing schedules and digital support tools that enhance patient monitoring. Rising demand for cost-effective therapies drives generic manufacturers to scale production. As treatment guidelines evolve, leading players align their portfolios with advanced therapeutic options, improving competitiveness in both developed and emerging markets.
Key Player Analysis
- Amgen Inc.
- Eli Lilly and Company
- Novartis AG
- Hoffmann-La Roche Ltd.
- Merck & Co., Inc.
- Pfizer Inc.
- GlaxoSmithKline plc
- Teva Pharmaceutical Industries Ltd.
- Radius Health, Inc.
- Astellas Pharma Inc.
Recent Developments
- In January 2024, the regulatory label for Prolia received a boxed-warning from regulators because of risk of severe hypocalcemia in patients with advanced kidney disease.
- In May 2023, Amgen Inc. released real-world data showing that Prolia (denosumab) significantly reduced fracture risk among nearly 500,000 postmenopausal women on Medicare, compared with oral alendronate
Report Coverage
The research report offers an in-depth analysis based on Drug Class, Type, Distribution Channel and Geography. It details leading market players, providing an overview of their business, product offerings, investments, revenue streams, and key applications. Additionally, the report includes insights into the competitive environment, SWOT analysis, current market trends, as well as the primary drivers and constraints. Furthermore, it discusses various factors that have driven market expansion in recent years. The report also explores market dynamics, regulatory scenarios, and technological advancements that are shaping the industry. It assesses the impact of external factors and global economic changes on market growth. Lastly, it provides strategic recommendations for new entrants and established companies to navigate the complexities of the market.
Future Outlook
- Demand for advanced biologics will rise as clinicians seek stronger fracture-risk reduction.
- Long-acting injectable therapies will gain wider use due to better adherence.
- Digital tools for monitoring bone health will support personalized treatment plans.
- Screening programs will expand, leading to earlier diagnosis in postmenopausal women.
- Combination therapies will see growing adoption for severe osteoporosis cases.
- Generic drug uptake will increase in cost-sensitive regions.
- AI-driven fracture-risk prediction models will enhance clinical decision-making.
- Telehealth access will improve specialist reach in underserved areas.
- R&D investment will grow for safer and more targeted anabolic treatments.
- Emerging markets will strengthen their role as treatment access and diagnostic capacity expand.
Request a Free Sample
Fill in your details and we'll send you a free sample report.
- Sample data tables & charts
- Research methodology
Need a Custom Version of This Report?
Tailor the scope, geography, or segments to your exact requirements.
- Custom geography or segment scope
- Direct access to our analyst team
Frequently Asked Questions
What is the current market size for the Postmenopausal Osteoporosis Treatment market, and what is its projected size in 2032?
At what Compound Annual Growth Rate is the Postmenopausal Osteoporosis Treatment market projected to grow between 2025 and 2032?
Which patient demographics segment will post the highest CAGR in the forecast period?
What are the primary factors fueling the growth of the Postmenopausal Osteoporosis Treatment market?
Who are the leading companies in the Postmenopausal Osteoporosis Treatment market?
Table of Content
Chapter 1. Report Introduction
- 1.1 Report Description & Purpose
- 1.1.1 Report Title & Market Definition
- 1.1.2 Unique Selling Propositions (USP) & Key Differentiators
- 1.1.3 Value Proposition for Stakeholders
- 1.2 Research Objectives
- 1.2.1 Market Sizing Objectives (Volume & Revenue)
- 1.2.2 Segmentation Objectives
- 1.2.3 Competitive Intelligence Objectives
- 1.2.4 Forecast & Scenario Objectives
- 1.3 Report Scope
- 1.3.1 Postmenopausal Osteoporosis Treatment Scope – Types & Subtypes Covered
- 1.3.2 Geographic Scope – Regions & Countries Covered
- 1.3.3 Historical Period, Base Year & Forecast Period (2024; forecast to 2032)
- 1.3.4 Inclusions & Exclusions
- 1.4 HS Code & Classification Framework
- 1.5 Currency, Units & Pricing Basis
- 1.6 Target Stakeholders
- 1.7 Limitations & Assumptions
Chapter 2. Executive Summary
- 2.1 Global Postmenopausal Osteoporosis Treatment Market Snapshot
- 2.1.1 Market Size – Historical (2024) & Forecast (2024-2032) (2024: USD 12,863 million → 2032: USD 18,716.25 million)
- 2.1.2 Volume & Revenue – Global Totals
- 2.1.3 Key Market Highlights – Top Five Facts
- 2.2 Postmenopausal Osteoporosis Treatment Market Segmentation Snapshot
- 2.2.1 Market Split by Region – 2024 vs. 2032
- 2.3 Competitive Snapshot
- 2.3.1 Top 10 Players by Revenue Share – 2024
- 2.3.2 Top 10 Players by Volume Share – 2024
- 2.3.3 Recent Strategic Developments (18-Month Summary)
- 2.4 Key Investment Highlights & Strategic Conclusions
Chapter 3. Postmenopausal Osteoporosis Treatment Market Dynamics & Industry Analysis
- 3.1 Market Overview & Context
- 3.1.1 Postmenopausal Osteoporosis Treatment Market Position in the Broader Automotive Value Chain
- 3.1.2 OEM vs. Replacement Market Dynamics
- 3.1.3 Market Maturity & Development Stage by Region
- 3.2 Postmenopausal Osteoporosis Treatment Market Drivers
- 3.3 Postmenopausal Osteoporosis Treatment Market Restraints & Challenges
- 3.4 Postmenopausal Osteoporosis Treatment Market Opportunities
- 3.5 Porter's Five Forces Analysis
- 3.5.1 Threat of New Entrants
- 3.5.2 Bargaining Power of Suppliers
- 3.5.3 Bargaining Power of Buyers
- 3.5.4 Threat of Substitutes
- 3.5.5 Competitive Rivalry – Intensity Assessment
- 3.6 Postmenopausal Osteoporosis Treatment Value Chain Analysis
- 3.6.1 Upstream – Raw Material/Input Suppliers
- 3.6.1.1 Raw Material/Input 1
- 3.6.1.2 Raw Material/Input 2
- 3.6.1.3 Raw Material/Input 3
- 3.6.2 Midstream – Production/Manufacturing/Service Delivery
- 3.6.2.1 Production/Process Overview
- 3.6.2.2 Key Facility Locations & Capacity by Manufacturer
- 3.6.3 Downstream – Distribution & End Consumer
- 3.6.3.1 Primary Channel – B2B/OEM
- 3.6.3.2 Secondary Channels – Dealer, Retail, Online, Direct
- 3.6.4 Value Chain Profitability Analysis
- 3.6.1 Upstream – Raw Material/Input Suppliers
- 3.7 PESTEL Analysis
- 3.7.1 Political Factors
- 3.7.2 Economic Factors
- 3.7.3 Social Factors
- 3.7.4 Technological Factors
- 3.7.5 Environmental Factors
- 3.7.6 Legal Factors
- 3.8 Postmenopausal Osteoporosis Treatment Supply Chain Analysis
- 3.8.1 Raw Material/Input Supply Risk Assessment
- 3.8.2 Manufacturing Concentration Risk (Geographic Exposure)
- 3.8.3 Trade Disruption Impact Analysis
- 3.9 Regulatory & Policy Landscape
Note: The regulatory and policy landscape section covers regulations based on their applicability to the market, Postmenopausal Osteoporosis Treatment category, geography, and scope of the study. Only regulatory frameworks with a material impact on operations, compliance, trade, sustainability, or market access are analyzed in detail.
Chapter 4. Key Investment Pockets & Opportunity Analysis
- 4.1 Postmenopausal Osteoporosis Treatment Market Attractiveness Analysis
- 4.1.1 By Region – Investment Attractiveness Matrix (Volume × CAGR)
- 4.2 Absolute Revenue Growth Opportunity
- 4.2.1 By Region – Absolute USD Growth Through 2032
- 4.3 Incremental Volume Opportunity
- 4.3.1 By Region – Incremental Volume Through 2032
- 4.3.2 Segment – Incremental Volume
- 4.4 Emerging Submarket Opportunity Deep Dive (Subject to Applicability)
- 4.5 Emerging Market Opportunity Scorecards
- 4.5.1 United States
- 4.5.2 Europe
- 4.5.3 Asia
- 4.5.4 Middle East & Africa
Note: Emerging Market Opportunity Scorecards will be included based on relevance and strategic importance. Regions listed are indicative and may vary depending on data availability and market dynamics.
Chapter 5. Postmenopausal Osteoporosis Treatment Import-Export Analysis & Trade Flows
- 5.1 Global Trade Overview
- 5.1.1 Global Export Value by Country (2024)
- 5.1.2 Global Export Volume by Country (2024)
- 5.1.3 Global Import Value by Country (2024)
- 5.1.4 Global Import Volume by Country (2024)
- 5.1.5 Net Trade Balance by Country (2024)
- 5.2 Export Analysis – Segment
- 5.2.1 Type 1 (HS Code)
- 5.2.2 Type 2 (HS Code)
- 5.2.3 Type 3 (HS Code)
- 5.2.4 Type 4 (HS Code)
- 5.2.5 Type 5 (HS Code)
- 5.3 Import Analysis – Segment
- 5.3.1 Type 1 (HS Code)
- 5.3.2 Type 2 (HS Code)
- 5.3.3 Type 3 (HS Code)
- 5.3.4 Type 4 (HS Code)
- 5.3.5 Type 5 (HS Code)
- 5.4 Average Unit Trade Prices
- 5.4.1 Average Export Price – Segment & Country
- 5.4.2 Average Import Price – Segment & Source Country
- 5.4.3 Price Trends (2024)
- 5.5 Key Trade Route Analysis
- 5.5.1 Trade Route 1
- 5.5.2 Trade Route 2
- 5.5.3 Trade Route 3
- 5.5.4 Trade Route 4
- 5.5.5 Trade Route 5
- 5.6 Trade Policy Impact Assessment
- 5.6.1 US Anti-Dumping & Section 301 Tariffs
- 5.6.2 EU Customs Union Impact
- 5.6.3 Major Free Trade Agreements
- 5.6.4 USMCA Rules of Origin
Note: Trade policy analysis will be included only where relevant to the Postmenopausal Osteoporosis Treatment market.
Chapter 6. Competitive Landscape & Company Benchmarking
- 6.1 Postmenopausal Osteoporosis Treatment Market Concentration & Structure
- 6.1.1 Herfindahl-Hirschman Index (HHI) – vs. 2024
- 6.1.2 Tier 1, Tier 2 & Tier 3 Market Structure
- 6.1.3 Global, Regional & Local Player Dynamics
- 6.2 Postmenopausal Osteoporosis Treatment Market Share Analysis – 2024
- 6.2.1 Global Revenue Share by Company
- 6.2.2 Global Volume Share by Company
- 6.2.3 Regional Revenue Share
- 6.2.4 Market Share Evolution ( vs. 2024)
- 6.2.5 OEM Segment Share by Company
- 6.2.6 Replacement Segment Share by Company
- 6.3 Production/Delivery Capacity & Facility Analysis
- 6.3.1 Global Installed Capacity
- 6.3.2 Capacity Utilization Rates
- 6.3.3 Production/Output Volume
- 6.3.4 Facility Locations & Capacity Map
- 6.3.5 Planned Capacity Additions
- 6.4 Postmenopausal Osteoporosis Treatment Competitive Benchmarking Matrix
- 6.4.1 Revenue, Volume, CAGR & Profitability Comparison
- 6.4.2 Channel Revenue Mix
- 6.4.3 Geographic Revenue Exposure
- 6.4.4 R&D Intensity
- 6.4.5 Sustainability Maturity
- 6.5 Strategic Developments in Postmenopausal Osteoporosis Treatment (Last 24 Months)
- 6.5.1 Mergers, Acquisitions & Divestments
- 6.5.2 New Postmenopausal Osteoporosis Treatment Launches
- 6.5.3 Facility Expansions
- 6.5.4 Strategic Alliances, Joint Ventures & Partnerships
- 6.5.5 Distribution Expansion & Market Entry
- 6.5.6 Sustainability & ESG Initiatives
- 6.6 Competitive Strategy Mapping
- 6.6.1 Leader, Challenger, Follower & Niche Classification
- 6.6.2 Pricing Strategy Comparison
- 6.6.3 Channel Strategy Matrix
Note: Strategic developments are included based on their materiality and the availability of reliable information.
Chapter 7. Global Postmenopausal Osteoporosis Treatment Market – By Distribution Channel
- 7.1 Segment Overview
- 7.1.1 Volume & Revenue Split by Channel (2024 & 2032)
- 7.1.2 Channel Mix Evolution (2024-2032)
Chapter 8. Regional Market Analysis – Global Overview
- 8.1 Global Regional Overview
- 8.1.1 Regional Volume Share
- 8.1.2 Regional Revenue Share
- 8.1.3 Regional Volume by Region
- 8.1.4 Regional Revenue by Region
- 8.1.5 Regional Forecast Through 2032
- 8.2 Cross-Regional Segment Analysis
- 8.2.1 By Distribution Channel
- 8.2.2 By Brand/Price Tier
Chapter 9. North America Postmenopausal Osteoporosis Treatment Market
- 9.1 United States
- 9.2 Canada
- 9.3 Mexico
Chapter 10. Europe Postmenopausal Osteoporosis Treatment Market
- 10.1 Germany
- 10.2 France
- 10.3 Italy
- 10.4 United Kingdom
- 10.5 Spain
- 10.6 Poland
- 10.7 Russia
- 10.8 Netherlands
- 10.9 Belgium
- 10.10 Sweden
- 10.11 Denmark
- 10.12 Norway
- 10.13 Rest of Europe
Chapter 11. Asia Pacific Postmenopausal Osteoporosis Treatment Market
- 11.1 China
- 11.2 India
- 11.3 Japan
- 11.4 South Korea
- 11.5 Thailand
- 11.6 Indonesia
- 11.7 Vietnam
- 11.8 Malaysia
- 11.9 Australia
- 11.10 Rest of Asia Pacific
Chapter 12. Latin America Postmenopausal Osteoporosis Treatment Market
- 12.1 Brazil
- 12.2 Argentina
- 12.3 Colombia
- 12.4 Chile
- 12.5 Rest of Latin America
Chapter 13. Middle East Postmenopausal Osteoporosis Treatment Market
- 13.1 Saudi Arabia
- 13.2 United Arab Emirates
- 13.3 Turkey
- 13.4 Israel
- 13.5 Iran
- 13.6 Rest of the Middle East
Chapter 14. Africa Postmenopausal Osteoporosis Treatment Market
- 14.1 South Africa
- 14.2 Egypt
- 14.3 Nigeria
- 14.4 Morocco
- 14.5 Rest of Africa
Chapter 15. Postmenopausal Osteoporosis Treatment Company Profiles
- 15.1 [Company 01]
- 15.1.1 Company Overview
- 15.1.2 Key Management Personnel
- 15.1.3 Products & Services Portfolio
- 15.1.4 Financial Performance
- 15.1.5 Key Market Focus & Geographic Presence
- 15.1.6 Recent Developments & Strategic Initiatives
Note: The company profile list is preliminary and may change based on research findings, market developments, data availability, and client requirements.
Chapter 16. Appendices
- Appendix A – List of Abbreviations & Acronyms
- Appendix B – Industry Classification Code Reference – Full Series
- Appendix C – Production & Capacity Data Tables
- Appendix D – End-Use & Demand Base Tables
- Appendix E – Consumption & Replacement Rate Assumptions
- Appendix F – ASP Reference Tables
- Appendix G – Manufacturing & Facility Database
- Appendix H – Import-Export Data Tables
- Appendix I – Regulatory Summary Tables
- Appendix J – Primary Research Participant List (Anonymized)
- Appendix K – Primary Research Questionnaire Framework
- Appendix L – Data Sources & Bibliography
- Appendix M – Market Size Divergence & Source Comparison
Chapter 17. Research Methodology
- 17.1 Research Framework & Philosophy
- 17.2 Secondary Research – Sources, Hierarchy & Data Extraction
- 17.3 Data Modeling – Bottom-Up & Top-Down Market Sizing
- 17.4 Primary Research – Stakeholder Framework, LOI & Sample Sizes
- 17.5 Forecast Methodology – Regression, Scenario & Sensitivity Analysis
- 17.6 Quality Control – Four-Layer Validation Framework
- 17.7 Limitations & Standard Assumptions
- 17.8 Disclaimer
