
Market Overview:
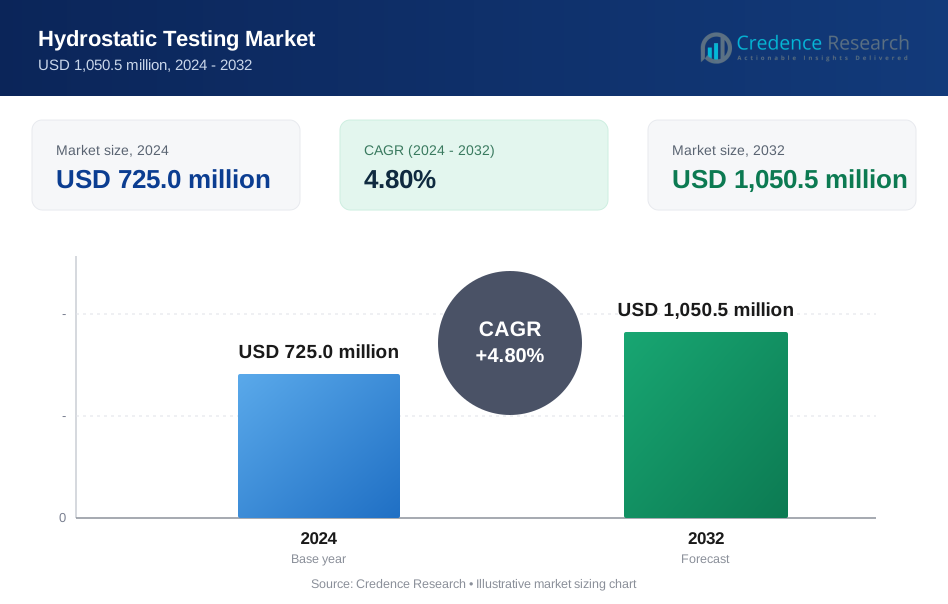
The Hydrostatic Testing Market size was valued at USD 630.0 million in 2018 to USD 725.0 million in 2024 and is anticipated to reach USD 1,050.5 million by 2032, at a CAGR of 4.8% during the forecast period.
| REPORT ATTRIBUTE | DETAILS |
|---|---|
| Historical Period | 2020-2023 |
| Base Year | 2024 |
| Forecast Period | 2025-2032 |
| Hydrostatic Testing Market Size 2024 | USD 725.0 million |
| Hydrostatic Testing Market, CAGR | 4.8% |
| Hydrostatic Testing Market Size 2032 | USD 1,050.5 million |
The market is driven by rising demand for pipeline integrity, safety compliance, and leak detection across industries such as oil and gas, energy, and construction. Growing regulatory frameworks that mandate strict testing of pressure systems encourage higher adoption. Expanding energy infrastructure and increasing investments in industrial projects are creating steady demand for hydrostatic testing. Additionally, technological improvements in equipment design and digital monitoring are enabling higher precision, efficiency, and reliability, further driving adoption across end-use sectors.
Geographically, North America dominates due to advanced energy infrastructure and strict compliance requirements across industries. Europe follows with strong adoption driven by safety regulations in manufacturing and utilities. Meanwhile, Asia-Pacific is emerging as the fastest-growing region due to rapid industrialization, expanding oil and gas projects, and increasing investments in construction. Countries like China, India, and Southeast Asian nations are driving this growth, while the Middle East is also gaining momentum with its focus on large-scale pipeline and energy projects.
Market Insights:
- The Hydrostatic Testing Market was valued at USD 630.0 million in 2018, reached USD 725.0 million in 2024, and is projected to hit USD 1,050.5 million by 2032, at a CAGR of 4.8%.
- North America led with 35.2% share in 2024 due to strong regulatory frameworks, Europe followed with 28.3% supported by advanced manufacturing sectors, and Asia Pacific held 26.5% driven by infrastructure and industrial expansion.
- Asia Pacific remains the fastest-growing region with a 6.0% CAGR, supported by rapid industrialization, large-scale infrastructure projects, and increasing adoption of testing standards in China and India.
- Pumps accounted for the largest share among product types in 2024, reflecting their critical role in ensuring consistent pressure testing across industries.
- Pressure gauges held the second-highest contribution, supported by demand for precision measurement and compliance across oil and gas, utilities, and manufacturing sectors.
Market Drivers:
Increasing Demand for Pipeline Integrity and Safety Compliance
The Hydrostatic Testing Market is expanding due to strict safety and compliance requirements across industries. Governments and regulatory bodies enforce mandatory pressure testing for pipelines, boilers, and tanks to ensure reliability. This demand strengthens the role of hydrostatic testing as a standard practice. Companies use it to prevent costly failures, environmental hazards, and workplace accidents. Rising investment in energy projects highlights the importance of testing systems before operations. Industrial expansions in construction and chemicals also reinforce adoption. Strong compliance culture drives steady demand in developed economies. The market benefits from consistent enforcement of safety frameworks.
- For instance, Enbridge hydrostatically tests every new pipeline segment by filling it with water and pressurizing it to 1.25 to 1.5 times the maximum operating pressure, maintaining this test for a minimum of 8 hours, as per U.S. and Canadian regulatory requirements and company practice. This procedure is documented for Enbridge Line 6B and Line 9B hydrostatic test plans, both submitted to and validated by U.S. and Canadian authorities.
Growing Energy Infrastructure Development Across Global Economies
The Hydrostatic Testing Market benefits from rising investments in oil and gas infrastructure. Companies construct new pipelines and expand energy facilities across multiple regions. These projects require regular testing to ensure safety and efficiency. Demand for hydrostatic testing grows as infrastructure scales. It provides confidence in equipment durability under extreme pressures. Expansion of offshore and onshore exploration projects intensifies reliance on testing services. Energy transition projects, including renewable power plants, also use pressure testing for safety. Strong infrastructure development continues to drive market revenue upward.
- For instance, the Chevron Wheatstone Project in Australia documented hydrostatic testing involving the filling and pressurizing of offshore trunklines to industry-regulated pressures, followed by the safe discharge of approximately 20,000 cubic meters of test water at each hydrotest cycle, as reported in Chevron's official Environmental Management Plan
Advancements in Testing Technology and Equipment Efficiency
The Hydrostatic Testing Market gains momentum from advancements in testing equipment. Modern systems deliver faster, more accurate pressure measurements with digital integration. Automated monitoring enhances efficiency by reducing manual intervention. It allows companies to achieve consistent results while lowering operational costs. Adoption of portable testing units enables on-site testing for remote projects. Industries favor upgraded systems for reducing downtime during inspections. High precision and reliable performance strengthen user confidence in results. Improved technology ensures compliance with evolving standards.
Rising Demand Across Industrial Manufacturing and Utility Applications
The Hydrostatic Testing Market grows due to broad adoption across manufacturing, utilities, and construction. Industrial manufacturers use it to test pressure vessels, pipelines, and storage systems. Utilities rely on it to secure water distribution and energy transmission networks. Expansion in heavy industries highlights the importance of reliable pressure testing. Growth in chemicals, automotive, and aerospace adds to demand. It ensures safe operations and reduces risks of leaks and breakdowns. Testing services support operational efficiency across multiple sectors. Widening application scope fuels consistent long-term growth.
Market Trends:
Integration of Digital Monitoring and Smart Testing Systems
The Hydrostatic Testing Market experiences a trend toward digital integration. Testing solutions now combine sensors with real-time monitoring platforms. It enables faster data collection and automated reporting. Industries benefit from higher accuracy and improved traceability. Smart testing systems reduce the reliance on manual oversight. Companies adopt connected technologies to comply with evolving regulatory standards. Integration supports predictive maintenance strategies in critical sectors. This shift toward intelligent systems defines the modern testing landscape. Growing adoption of IoT-based platforms will further enhance efficiency in testing workflows.
- For instance, in March 2023, Cumulus Digital Systems launched its “Digital Pressure Testing” smart workflow platform. This system connects with a Bluetooth-enabled pressure gauge and enables real-time hydrostatic test data capture, automated digital report generation, and cloud-synced compliance records.
Growing Focus on Sustainable Practices and Eco-Friendly Testing
The Hydrostatic Testing Market reflects a rising focus on sustainability. Industries seek methods that minimize water use and environmental impact. It drives demand for recycling systems that reuse test water. Eco-friendly chemicals support safe disposal processes. Companies develop testing solutions aligned with environmental regulations. Industrial users adopt sustainable practices to meet compliance goals. The trend strengthens global adoption of green solutions. Sustainability becomes an important factor influencing product innovation. Growing emphasis on corporate ESG goals will accelerate adoption of eco-friendly testing methods.
Expansion of Third-Party Testing Services and Outsourced Models
The Hydrostatic Testing Market shows a trend toward outsourcing. Companies increasingly rely on specialized third-party testing providers. It helps reduce capital expenditure on in-house testing equipment. Service providers deliver expertise, faster turnaround, and regulatory compliance. Demand for outsourcing grows in regions with high industrial activity. It allows smaller companies to access advanced testing capabilities. Competitive markets drive service providers to offer innovative solutions. Outsourcing strengthens overall market service growth. Strategic partnerships between industrial firms and service providers are expected to rise.
- For instance, Applied Technical Services (ATS) is a certified third-party provider that conducts hydrostatic pressure testing of pressure vessels, piping, and safety-critical equipment. ATS technicians maintain compliance with ASTM, ASME, and DOT standards, and clients are assured all test reports are traceable and fully documented for regulatory audits.
Increased Adoption in Aerospace and Defense Applications
The Hydrostatic Testing Market expands into aerospace and defense. Pressure systems in aircraft and defense equipment require strict validation. It ensures safety and reliability in critical environments. Adoption rises with growing defense budgets across regions. Aerospace manufacturers adopt hydrostatic testing for precision systems. The trend highlights the diversification of end-use industries. It strengthens demand in high-value applications with strict compliance needs. Expanding defense projects support testing market resilience. Rising focus on next-generation aircraft and defense systems will further drive demand.
Market Challenges Analysis:
High Operational Costs and Complex Testing Procedures
The Hydrostatic Testing Market faces challenges from operational costs and complex procedures. High-pressure equipment requires investment in specialized tools and skilled labor. Smaller companies find it difficult to manage costs for regular testing. Complex procedures often delay projects and reduce productivity. It creates a barrier for widespread adoption in emerging regions. Industries balance cost management with strict safety requirements. Companies investing in automation can reduce these challenges. However, the initial costs of advanced equipment remain high.
Environmental Restrictions and Limited Awareness in Developing Economies
The Hydrostatic Testing Market also encounters challenges from environmental regulations. Disposal of test water and chemicals requires compliance with strict norms. Developing economies often lack awareness of testing benefits, reducing adoption. Industries without regulatory enforcement delay investments in testing systems. It limits the growth potential across some regions. Companies must address training gaps and raise awareness about safety. Expansion in developing markets remains dependent on education and incentives. Environmental and awareness challenges create growth restrictions for the market.
Market Opportunities:
Expanding Industrialization in Emerging Economies
The Hydrostatic Testing Market sees opportunities in rapidly industrializing regions. Expanding oil, gas, and construction sectors drive rising demand. It creates strong opportunities for service providers and equipment manufacturers. Growing urbanization and infrastructure investments strengthen testing needs. Regional governments support safety frameworks and compliance requirements. Adoption of modern testing systems grows steadily in Asia-Pacific. Strong market potential exists in untapped economies with rising industrial output. Emerging nations offer long-term opportunities for consistent market expansion.
Innovation in Testing Systems and Advanced Service Models
The Hydrostatic Testing Market benefits from innovation in equipment and services. Companies develop portable, automated, and digital-enabled systems. It creates opportunities to serve industries with diverse testing needs. Advanced service models, including remote monitoring, enhance efficiency. Industrial users seek solutions that reduce downtime and increase safety. Demand for next-generation systems offers growth potential for innovators. Expanding applications across multiple sectors strengthen long-term opportunities. Advanced solutions position market players for competitive advantage.
Market Segmentation Analysis:
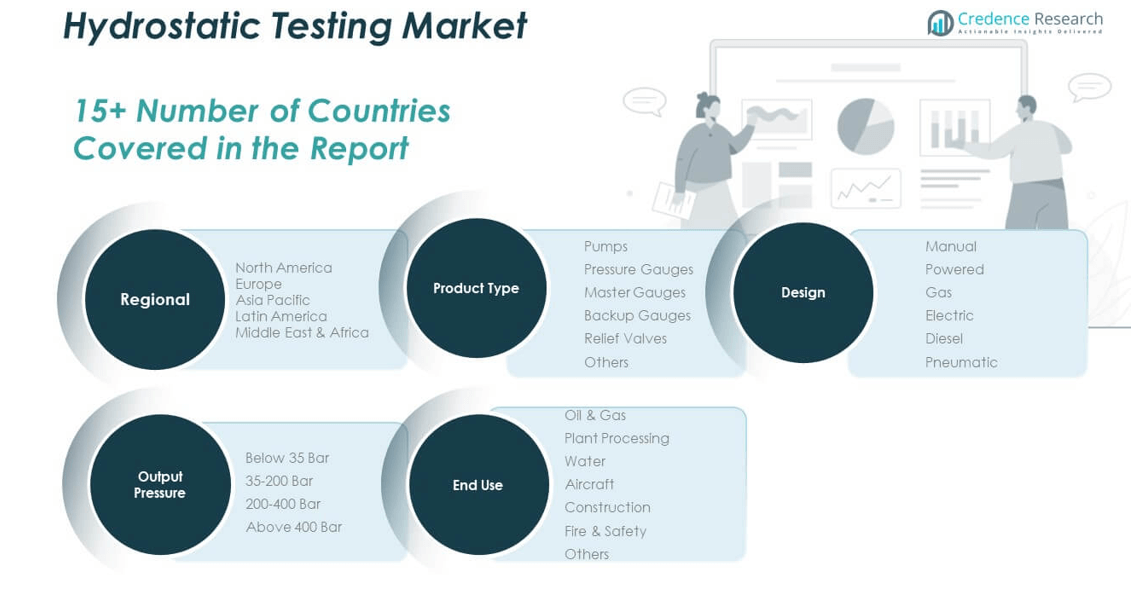
By product type, the Hydrostatic Testing Market is structured across diverse product categories that support pressure verification in industrial systems. Pumps hold a significant share due to their role in delivering reliable test pressure for pipelines and vessels. Pressure gauges, master gauges, backup gauges, and relief valves provide accuracy, redundancy, and safety assurance during operations. Other instruments also contribute by serving specialized testing requirements across multiple industries. Together, these products ensure dependable performance in mission-critical applications where equipment failure carries high risk.
By design segments include manual, powered, gas, electric, diesel, and pneumatic systems. Manual units are widely used for smaller applications, while powered and electric systems dominate large-scale projects requiring efficiency and precision. Gas and diesel units address testing in remote or high-demand environments, offering durability and higher capacity. Pneumatic systems continue to find adoption where portability and safety against ignition hazards are priorities. The combination of design categories reflects the market’s adaptability to varied industrial needs.
- For instance, RICE Hydro manufactures manual (MTP series), electric (EL series), diesel, gas, and pneumatic hydrostatic test pumps, with the TR-series offering up to 5,000 psi (345 bar) for high-pressure pneumatic testing, and manual models for residential and smaller industrial work rated up to 1,500 psi (103 bar).
By end-use segmentation highlights oil and gas as the leading industry due to the extensive network of pipelines and pressure vessels requiring testing. Plant processing facilities, aircraft manufacturing, construction, and fire and safety applications also show strong demand. It reinforces the critical importance of hydrostatic testing in ensuring operational safety, preventing accidents, and meeting compliance requirements across sectors. Other industries maintain smaller but consistent adoption levels.
By output pressure, the market spans below 35 bar, 35–200 bar, 200–400 bar, and above 400 bar categories. Lower ranges serve utilities and construction, while mid and high ranges dominate in oil, gas, and aerospace. Above 400 bar systems cater to specialized industries where extreme safety validation is required. This segmentation reflects how varying pressure thresholds align with distinct application areas and operational risks.
- For instance, pressure test units from Hydrorex and Petersen Products deliver certified and documented hydrostatic tests across a spectrum of output pressures. Hydrorex units provide up to 65,000 psi (4,482 bar) for testing critical-pressure vessels in oil and gas, while Petersen’s high-pressure series offers standardized models for 1,000–10,000 psi (69–690 bar)-with use cases in heat exchanger tube, aerospace, and utility equipment validation.
Segmentation:
By Product Type
- Pumps
- Pressure Gauges
- Master Gauges
- Backup Gauges
- Relief Valves
- Others
By Design
- Manual
- Powered
- Gas
- Electric
- Diesel
- Pneumatic
By End-Use
- Oil & Gas
- Plant Processing
- Aircraft
- Construction
- Fire & Safety
- Others
By Output Pressure
- Below 35 Bar
- 35–200 Bar
- 200–400 Bar
- Above 400 Bar
By Region
- North America
- U.S.
- Canada
- Mexico
- Europe
- UK
- France
- Germany
- Italy
- Spain
- Russia
- Belgium
- Netherlands
- Austria
- Sweden
- Poland
- Denmark
- Switzerland
- Rest of Europe
- Asia Pacific
- China
- Japan
- South Korea
- India
- Australia
- Thailand
- Indonesia
- Vietnam
- Malaysia
- Philippines
- Taiwan
- Rest of Asia Pacific
- Latin America
- Brazil
- Argentina
- Peru
- Chile
- Colombia
- Rest of Latin America
- Middle East
- UAE
- KSA
- Israel
- Turkey
- Iran
- Rest of Middle East
- Africa
- Egypt
- Nigeria
- Algeria
- Morocco
- Rest of Africa
Regional Analysis:
North America
The North America Hydrostatic Testing Market size was valued at USD 224.8 million in 2018 to USD 255.5 million in 2024 and is anticipated to reach USD 369.6 million by 2032, at a CAGR of 4.8% during the forecast period. North America accounts for 35.2% of the global share in 2024, making it the leading region. Strong regulatory frameworks and established oil and gas infrastructure support consistent demand. It benefits from advanced testing technologies and high safety awareness across industries. The U.S. dominates with extensive pipeline networks and industrial facilities requiring frequent testing. Canada contributes through strong adoption in energy and construction sectors. Mexico adds demand with investments in utilities and processing plants. The region maintains growth through compliance-driven practices and a focus on reliability.
Europe
The Europe Hydrostatic Testing Market size was valued at USD 185.2 million in 2018 to USD 205.7 million in 2024 and is anticipated to reach USD 283.4 million by 2032, at a CAGR of 4.1% during the forecast period. Europe represents 28.3% of the global share in 2024, securing a strong position. Stringent safety standards and regulations in industries drive steady demand. Countries like Germany, the UK, and France lead in adoption due to well-developed manufacturing and energy sectors. The region emphasizes sustainable testing methods aligned with environmental policies. Growing aerospace and automotive industries expand the scope of hydrostatic testing. Eastern European markets also contribute with rising industrialization. Europe benefits from technological innovation and strong industry compliance. It maintains long-term growth through safety-focused practices.
Asia Pacific
The Asia Pacific Hydrostatic Testing Market size was valued at USD 160.0 million in 2018 to USD 192.0 million in 2024 and is anticipated to reach USD 305.1 million by 2032, at a CAGR of 6.0% during the forecast period. Asia Pacific holds 26.5% of the global share in 2024, positioning it as the fastest-growing region. Rapid industrialization and expanding infrastructure projects fuel market expansion. China leads with massive pipeline projects and manufacturing hubs requiring frequent testing. India contributes through growth in energy, construction, and processing sectors. Japan and South Korea enhance demand with aerospace and advanced manufacturing applications. Australia adds growth through mining and utilities. Southeast Asia supports adoption with expanding oil and gas activities. The region thrives on industrial development and large-scale infrastructure investment.
Latin America
The Latin America Hydrostatic Testing Market size was valued at USD 32.1 million in 2018 to USD 36.5 million in 2024 and is anticipated to reach USD 48.2 million by 2032, at a CAGR of 3.6% during the forecast period. Latin America accounts for 5.0% of the global share in 2024, reflecting steady growth. Brazil leads the market with demand in oil, gas, and construction sectors. Argentina contributes through plant processing and utility projects. The region benefits from government investment in energy infrastructure. Industrial expansions create opportunities for testing services. Limited regulatory enforcement in some areas restricts broader adoption. However, outsourcing of testing services is expanding. Latin America remains a stable but secondary growth market.
Middle East
The Middle East Hydrostatic Testing Market size was valued at USD 18.2 million in 2018 to USD 19.2 million in 2024 and is anticipated to reach USD 24.2 million by 2032, at a CAGR of 3.0% during the forecast period. The Middle East holds 2.6% of the global share in 2024, driven by its oil and gas dominance. GCC countries lead with large-scale energy projects requiring continuous testing. Saudi Arabia and UAE invest heavily in safety and infrastructure. Israel adds demand through aerospace and defense industries. Turkey supports growth through construction and industrial projects. Strong focus on energy security fuels demand for pressure testing. Limited diversification restricts wider market penetration. The region remains significant for specialized energy-related applications.
Africa
The Africa Hydrostatic Testing Market size was valued at USD 9.6 million in 2018 to USD 16.0 million in 2024 and is anticipated to reach USD 20.1 million by 2032, at a CAGR of 2.4% during the forecast period. Africa contributes 2.9% of the global share in 2024, reflecting a smaller market footprint. South Africa leads adoption with established industrial and utility sectors. Egypt supports demand with oil, gas, and infrastructure projects. Other African nations show limited adoption due to weaker regulatory enforcement. It faces challenges from lack of awareness and limited access to advanced testing systems. Market potential exists in pipeline projects and expanding industrialization. Foreign investment and infrastructure development can create future opportunities. Africa remains in an early growth stage with selective demand.
Key Player Analysis:
- Intertek
- Bureau Veritas
- SGS
- Applus+
- Element Materials Technology
- Omega Engineering
- Testo
- Ametek
- Curtiss-Wright Corporation
- Airgas, Inc.
- Alemite, LLC
- Fluke Corporation
- GE Measurement & Control
- Instron Corporation
- Parker Hannifin
- Beijing Ke Hua Technology
- InterTest, Inc.
- TekScan Industries
- Galiso
- Lorimer Corp
- Petersen Products
Competitive Analysis:
The Hydrostatic Testing Market features a competitive landscape defined by global testing service providers, instrumentation companies, and specialized solution developers. Leading players such as Intertek, Bureau Veritas, SGS, and Applus+ dominate through strong testing networks, compliance expertise, and multinational presence. Equipment manufacturers including Omega Engineering, Ametek, Fluke Corporation, and Parker Hannifin strengthen market presence with advanced gauges, pumps, and valves tailored to industrial needs. It is marked by strategic mergers, acquisitions, and product launches aimed at expanding service portfolios and regional reach. Companies focus on developing portable and digital-enabled systems to enhance efficiency and accuracy. Aerospace, oil and gas, and manufacturing industries drive partnerships for long-term testing contracts. Emerging regional firms compete by offering cost-effective services and specialized testing models. The market remains highly competitive, shaped by compliance-driven demand, technological innovation, and the need for global scalability.
Recent Developments:
- In February 2025, Danos disclosed the acquisition of substantially all assets of X-Pro Valve, LLC along with Surplus Valve Warehouse, LLC. This acquisition is designed to enhance Danos’ valve and wellhead service capabilities, notably expanding its hydrostatic testing, repairs, and field services for the industrial and energy sectors.
- In June 2025, Intertek launched "Intertek AI²," the world's first end-to-end AI assurance program, designed to enhance digital quality assurance-inclusive of industrial testing processes such as hydrostatic testing.
- In September 2025, SI Solutions announced the acquisition of Integrity Specialists, LLC, in a move to expand its pipeline inspection capabilities, which commonly include advanced hydrostatic testing services. With this acquisition, SI Solutions aims to strengthen its reach in the pipeline inspection and integrity verification sector, addressing growing demand for reliable and compliant hydrostatic testing in North America and supporting the safe operation of critical infrastructure
Report Coverage:
The research report offers an in-depth analysis based on Product Type, Design, End-Use and Output Pressure. It details leading market players, providing an overview of their business, product offerings, investments, revenue streams, and key applications. Additionally, the report includes insights into the competitive environment, SWOT analysis, current market trends, as well as the primary drivers and constraints. Furthermore, it discusses various factors that have driven market expansion in recent years. The report also explores market dynamics, regulatory scenarios, and technological advancements that are shaping the industry. It assesses the impact of external factors and global economic changes on market growth. Lastly, it provides strategic recommendations for new entrants and established companies to navigate the complexities of the market.
Future Outlook:
- The Hydrostatic Testing Market will continue expanding due to rising regulatory requirements in safety-critical sectors.
- Growth will be influenced by increasing adoption of automated and digital-enabled testing solutions across industries.
- Rising investments in oil, gas, and energy infrastructure will drive steady demand for hydrostatic testing services.
- Aerospace and defense industries will strengthen adoption through stringent testing needs for pressure systems.
- Outsourced testing services will gain traction as companies reduce capital costs and focus on compliance.
- Emerging economies in Asia Pacific will remain key growth contributors due to rapid industrialization.
- Innovation in portable and eco-friendly testing equipment will create new revenue opportunities.
- Competitive strategies will center on mergers, acquisitions, and regional expansion to increase market presence.
- Environmental regulations will encourage adoption of sustainable testing practices and water reuse systems.
- The market will benefit from broader industrial diversification, ensuring steady long-term growth potential.
Request a Free Sample
Fill in your details and we'll send you a free sample report.
- Sample data tables & charts
- Research methodology
Need a Custom Version of This Report?
Tailor the scope, geography, or segments to your exact requirements.
- Custom geography or segment scope
- Direct access to our analyst team
Frequently Asked Questions
What is the projected market size for the hydrostatic testing market by 2032?
What drives the growth of the hydrostatic testing market?
Which regions are leading the hydrostatic testing market?
What challenges does the hydrostatic testing market face?
Table of Content
Chapter 1. Report Introduction
- 1.1 Report Description & Purpose
- 1.1.1 Report Title & Market Definition
- 1.1.2 Unique Selling Propositions (USP) & Key Differentiators
- 1.1.3 Value Proposition for Stakeholders
- 1.2 Research Objectives
- 1.2.1 Market Sizing Objectives (Volume & Revenue)
- 1.2.2 Segmentation Objectives
- 1.2.3 Competitive Intelligence Objectives
- 1.2.4 Forecast & Scenario Objectives
- 1.3 Report Scope
- 1.3.1 Hydrostatic Testing Scope – Types & Subtypes Covered
- 1.3.2 Geographic Scope – Regions & Countries Covered
- 1.3.3 Historical Period, Base Year & Forecast Period (2024; forecast to 2032)
- 1.3.4 Inclusions & Exclusions
- 1.4 HS Code & Classification Framework
- 1.5 Currency, Units & Pricing Basis
- 1.6 Target Stakeholders
- 1.7 Limitations & Assumptions
Chapter 2. Executive Summary
- 2.1 Global Hydrostatic Testing Market Snapshot
- 2.1.1 Market Size – Historical (2024) & Forecast (2024-2032) (2024: USD 725.0 million → 2032: USD 1,050.5 million)
- 2.1.2 Volume & Revenue – Global Totals
- 2.1.3 Key Market Highlights – Top Five Facts
- 2.2 Hydrostatic Testing Market Segmentation Snapshot
- 2.2.1 Market Split by Region – 2024 vs. 2032
- 2.3 Competitive Snapshot
- 2.3.1 Top 10 Players by Revenue Share – 2024
- 2.3.2 Top 10 Players by Volume Share – 2024
- 2.3.3 Recent Strategic Developments (18-Month Summary)
- 2.4 Key Investment Highlights & Strategic Conclusions
Chapter 3. Hydrostatic Testing Market Dynamics & Industry Analysis
- 3.1 Market Overview & Context
- 3.1.1 Hydrostatic Testing Market Position in the Broader Automotive Value Chain
- 3.1.2 OEM vs. Replacement Market Dynamics
- 3.1.3 Market Maturity & Development Stage by Region
- 3.2 Hydrostatic Testing Market Drivers
- 3.3 Hydrostatic Testing Market Restraints & Challenges
- 3.4 Hydrostatic Testing Market Opportunities
- 3.5 Porter's Five Forces Analysis
- 3.5.1 Threat of New Entrants
- 3.5.2 Bargaining Power of Suppliers
- 3.5.3 Bargaining Power of Buyers
- 3.5.4 Threat of Substitutes
- 3.5.5 Competitive Rivalry – Intensity Assessment
- 3.6 Hydrostatic Testing Value Chain Analysis
- 3.6.1 Upstream – Raw Material/Input Suppliers
- 3.6.1.1 Raw Material/Input 1
- 3.6.1.2 Raw Material/Input 2
- 3.6.1.3 Raw Material/Input 3
- 3.6.2 Midstream – Production/Manufacturing/Service Delivery
- 3.6.2.1 Production/Process Overview
- 3.6.2.2 Key Facility Locations & Capacity by Manufacturer
- 3.6.3 Downstream – Distribution & End Consumer
- 3.6.3.1 Primary Channel – B2B/OEM
- 3.6.3.2 Secondary Channels – Dealer, Retail, Online, Direct
- 3.6.4 Value Chain Profitability Analysis
- 3.6.1 Upstream – Raw Material/Input Suppliers
- 3.7 PESTEL Analysis
- 3.7.1 Political Factors
- 3.7.2 Economic Factors
- 3.7.3 Social Factors
- 3.7.4 Technological Factors
- 3.7.5 Environmental Factors
- 3.7.6 Legal Factors
- 3.8 Hydrostatic Testing Supply Chain Analysis
- 3.8.1 Raw Material/Input Supply Risk Assessment
- 3.8.2 Manufacturing Concentration Risk (Geographic Exposure)
- 3.8.3 Trade Disruption Impact Analysis
- 3.9 Regulatory & Policy Landscape
Note: The regulatory and policy landscape section covers regulations based on their applicability to the market, Hydrostatic Testing category, geography, and scope of the study. Only regulatory frameworks with a material impact on operations, compliance, trade, sustainability, or market access are analyzed in detail.
Chapter 4. Key Investment Pockets & Opportunity Analysis
- 4.1 Hydrostatic Testing Market Attractiveness Analysis
- 4.1.1 By Region – Investment Attractiveness Matrix (Volume × CAGR)
- 4.2 Absolute Revenue Growth Opportunity
- 4.2.1 By Region – Absolute USD Growth Through 2032
- 4.3 Incremental Volume Opportunity
- 4.3.1 By Region – Incremental Volume Through 2032
- 4.3.2 Segment – Incremental Volume
- 4.4 Emerging Submarket Opportunity Deep Dive (Subject to Applicability)
- 4.5 Emerging Market Opportunity Scorecards
- 4.5.1 United States
- 4.5.2 Europe
- 4.5.3 Asia
- 4.5.4 Middle East & Africa
Note: Emerging Market Opportunity Scorecards will be included based on relevance and strategic importance. Regions listed are indicative and may vary depending on data availability and market dynamics.
Chapter 5. Hydrostatic Testing Import-Export Analysis & Trade Flows
- 5.1 Global Trade Overview
- 5.1.1 Global Export Value by Country (2024)
- 5.1.2 Global Export Volume by Country (2024)
- 5.1.3 Global Import Value by Country (2024)
- 5.1.4 Global Import Volume by Country (2024)
- 5.1.5 Net Trade Balance by Country (2024)
- 5.2 Export Analysis – Segment
- 5.2.1 Type 1 (HS Code)
- 5.2.2 Type 2 (HS Code)
- 5.2.3 Type 3 (HS Code)
- 5.2.4 Type 4 (HS Code)
- 5.2.5 Type 5 (HS Code)
- 5.3 Import Analysis – Segment
- 5.3.1 Type 1 (HS Code)
- 5.3.2 Type 2 (HS Code)
- 5.3.3 Type 3 (HS Code)
- 5.3.4 Type 4 (HS Code)
- 5.3.5 Type 5 (HS Code)
- 5.4 Average Unit Trade Prices
- 5.4.1 Average Export Price – Segment & Country
- 5.4.2 Average Import Price – Segment & Source Country
- 5.4.3 Price Trends (2024)
- 5.5 Key Trade Route Analysis
- 5.5.1 Trade Route 1
- 5.5.2 Trade Route 2
- 5.5.3 Trade Route 3
- 5.5.4 Trade Route 4
- 5.5.5 Trade Route 5
- 5.6 Trade Policy Impact Assessment
- 5.6.1 US Anti-Dumping & Section 301 Tariffs
- 5.6.2 EU Customs Union Impact
- 5.6.3 Major Free Trade Agreements
- 5.6.4 USMCA Rules of Origin
Note: Trade policy analysis will be included only where relevant to the Hydrostatic Testing market.
Chapter 6. Competitive Landscape & Company Benchmarking
- 6.1 Hydrostatic Testing Market Concentration & Structure
- 6.1.1 Herfindahl-Hirschman Index (HHI) – vs. 2024
- 6.1.2 Tier 1, Tier 2 & Tier 3 Market Structure
- 6.1.3 Global, Regional & Local Player Dynamics
- 6.2 Hydrostatic Testing Market Share Analysis – 2024
- 6.2.1 Global Revenue Share by Company
- 6.2.2 Global Volume Share by Company
- 6.2.3 Regional Revenue Share
- 6.2.4 Market Share Evolution ( vs. 2024)
- 6.2.5 OEM Segment Share by Company
- 6.2.6 Replacement Segment Share by Company
- 6.3 Production/Delivery Capacity & Facility Analysis
- 6.3.1 Global Installed Capacity
- 6.3.2 Capacity Utilization Rates
- 6.3.3 Production/Output Volume
- 6.3.4 Facility Locations & Capacity Map
- 6.3.5 Planned Capacity Additions
- 6.4 Hydrostatic Testing Competitive Benchmarking Matrix
- 6.4.1 Revenue, Volume, CAGR & Profitability Comparison
- 6.4.2 Channel Revenue Mix
- 6.4.3 Geographic Revenue Exposure
- 6.4.4 R&D Intensity
- 6.4.5 Sustainability Maturity
- 6.5 Strategic Developments in Hydrostatic Testing (Last 24 Months)
- 6.5.1 Mergers, Acquisitions & Divestments
- 6.5.2 New Hydrostatic Testing Launches
- 6.5.3 Facility Expansions
- 6.5.4 Strategic Alliances, Joint Ventures & Partnerships
- 6.5.5 Distribution Expansion & Market Entry
- 6.5.6 Sustainability & ESG Initiatives
- 6.6 Competitive Strategy Mapping
- 6.6.1 Leader, Challenger, Follower & Niche Classification
- 6.6.2 Pricing Strategy Comparison
- 6.6.3 Channel Strategy Matrix
Note: Strategic developments are included based on their materiality and the availability of reliable information.
Chapter 7. Global Hydrostatic Testing Market – By Distribution Channel
- 7.1 Segment Overview
- 7.1.1 Volume & Revenue Split by Channel (2024 & 2032)
- 7.1.2 Channel Mix Evolution (2024-2032)
Chapter 8. Regional Market Analysis – Global Overview
- 8.1 Global Regional Overview
- 8.1.1 Regional Volume Share
- 8.1.2 Regional Revenue Share
- 8.1.3 Regional Volume by Region
- 8.1.4 Regional Revenue by Region
- 8.1.5 Regional Forecast Through 2032
- 8.2 Cross-Regional Segment Analysis
- 8.2.1 By Distribution Channel
- 8.2.2 By Brand/Price Tier
Chapter 9. North America Hydrostatic Testing Market
- 9.1 United States
- 9.2 Canada
- 9.3 Mexico
Chapter 10. Europe Hydrostatic Testing Market
- 10.1 Germany
- 10.2 France
- 10.3 Italy
- 10.4 United Kingdom
- 10.5 Spain
- 10.6 Poland
- 10.7 Russia
- 10.8 Netherlands
- 10.9 Belgium
- 10.10 Sweden
- 10.11 Denmark
- 10.12 Norway
- 10.13 Rest of Europe
Chapter 11. Asia Pacific Hydrostatic Testing Market
- 11.1 China
- 11.2 India
- 11.3 Japan
- 11.4 South Korea
- 11.5 Thailand
- 11.6 Indonesia
- 11.7 Vietnam
- 11.8 Malaysia
- 11.9 Australia
- 11.10 Rest of Asia Pacific
Chapter 12. Latin America Hydrostatic Testing Market
- 12.1 Brazil
- 12.2 Argentina
- 12.3 Colombia
- 12.4 Chile
- 12.5 Rest of Latin America
Chapter 13. Middle East Hydrostatic Testing Market
- 13.1 Saudi Arabia
- 13.2 United Arab Emirates
- 13.3 Turkey
- 13.4 Israel
- 13.5 Iran
- 13.6 Rest of the Middle East
Chapter 14. Africa Hydrostatic Testing Market
- 14.1 South Africa
- 14.2 Egypt
- 14.3 Nigeria
- 14.4 Morocco
- 14.5 Rest of Africa
Chapter 15. Hydrostatic Testing Company Profiles
- 15.1 [Company 01]
- 15.1.1 Company Overview
- 15.1.2 Key Management Personnel
- 15.1.3 Products & Services Portfolio
- 15.1.4 Financial Performance
- 15.1.5 Key Market Focus & Geographic Presence
- 15.1.6 Recent Developments & Strategic Initiatives
Note: The company profile list is preliminary and may change based on research findings, market developments, data availability, and client requirements.
Chapter 16. Appendices
- Appendix A – List of Abbreviations & Acronyms
- Appendix B – Industry Classification Code Reference – Full Series
- Appendix C – Production & Capacity Data Tables
- Appendix D – End-Use & Demand Base Tables
- Appendix E – Consumption & Replacement Rate Assumptions
- Appendix F – ASP Reference Tables
- Appendix G – Manufacturing & Facility Database
- Appendix H – Import-Export Data Tables
- Appendix I – Regulatory Summary Tables
- Appendix J – Primary Research Participant List (Anonymized)
- Appendix K – Primary Research Questionnaire Framework
- Appendix L – Data Sources & Bibliography
- Appendix M – Market Size Divergence & Source Comparison
Chapter 17. Research Methodology
- 17.1 Research Framework & Philosophy
- 17.2 Secondary Research – Sources, Hierarchy & Data Extraction
- 17.3 Data Modeling – Bottom-Up & Top-Down Market Sizing
- 17.4 Primary Research – Stakeholder Framework, LOI & Sample Sizes
- 17.5 Forecast Methodology – Regression, Scenario & Sensitivity Analysis
- 17.6 Quality Control – Four-Layer Validation Framework
- 17.7 Limitations & Standard Assumptions
- 17.8 Disclaimer
