
Market Overview
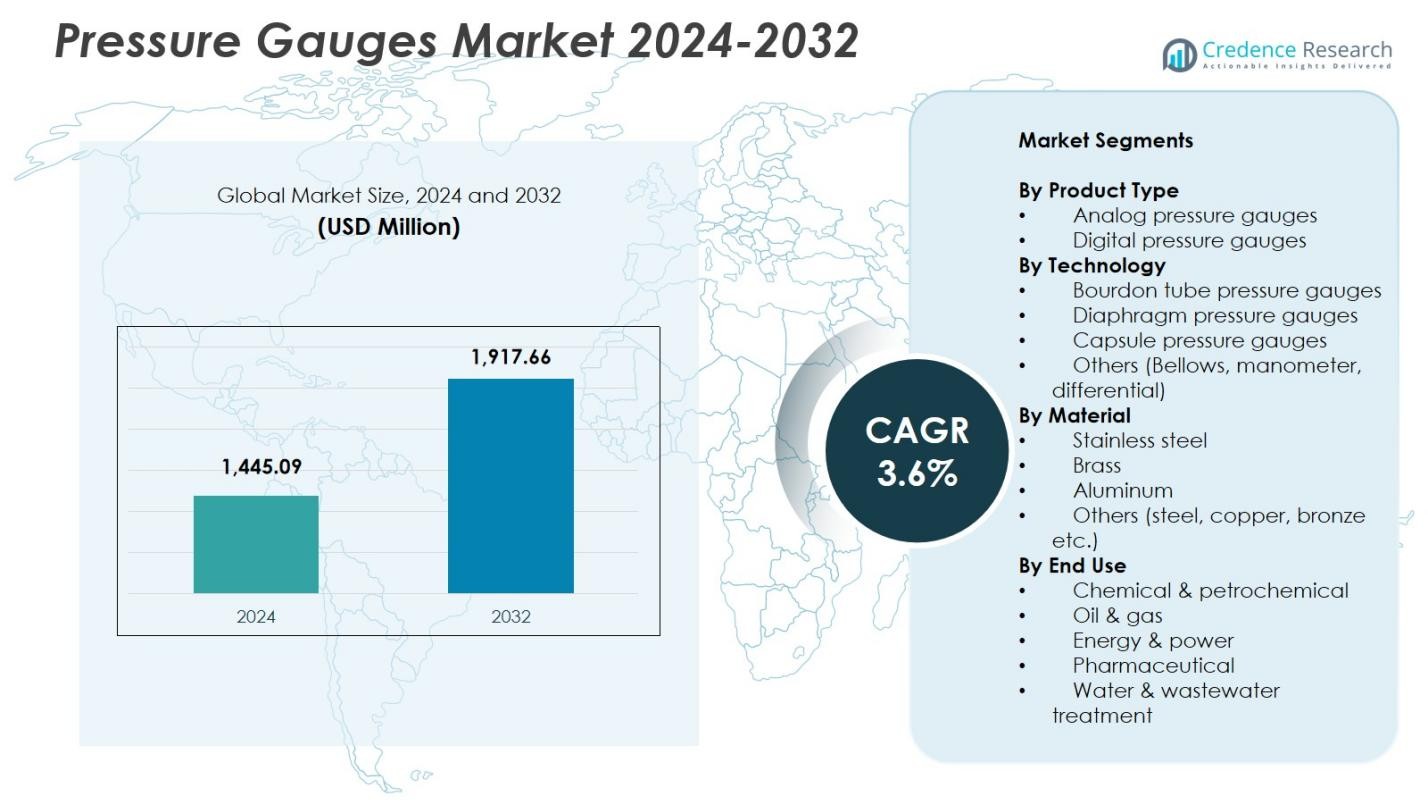
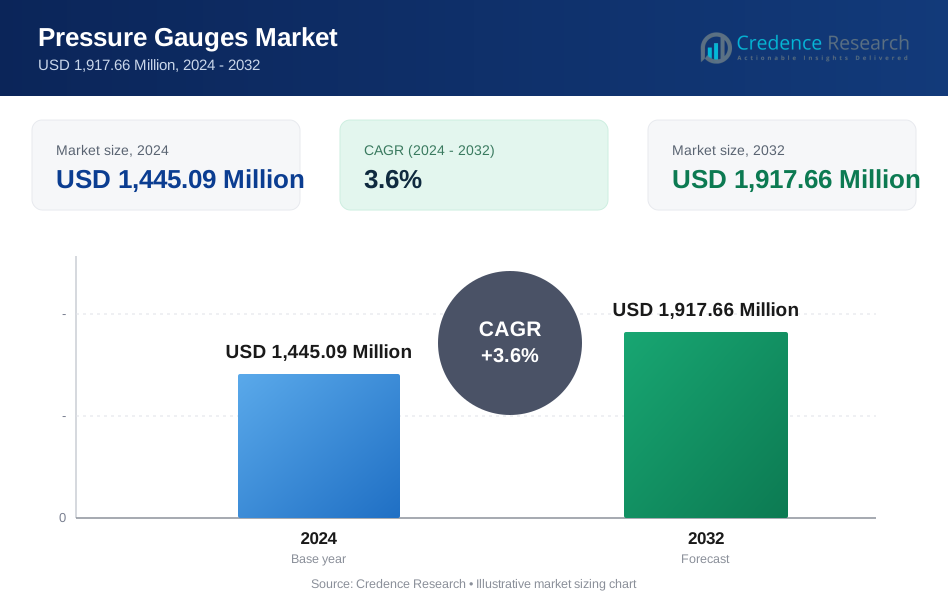
Pressure Gauges Market size was valued at USD 1,445.09 Million in 2024 and is anticipated to reach USD 1,917.66 Million by 2032, at a CAGR of 3.6% during the forecast period.
| REPORT ATTRIBUTE | DETAILS |
|---|---|
| Historical Period | 2020-2023 |
| Base Year | 2024 |
| Forecast Period | 2025-2032 |
| Pressure Gauges Market Size 2024 | USD 1,445.09 Million |
| Pressure Gauges Market, CAGR | 3.6% |
| Pressure Gauges Market Size 2032 | USD 1,917.66 Million |
Pressure Gauges Market features leading players such as Ametek, Badotherm, Circor, Dwyer, Emerson, Fluke Corporation, Honeywell International, Kobold Instruments, Newbow, and Omega Engineering, each focusing on precision engineering, material innovation, and expanded product portfolios to meet rising industrial measurement demands. These companies strengthen their presence through advanced analog and digital gauges designed for reliability in oil & gas, chemical processing, energy, and manufacturing applications. Regionally, North America led the market with a 32.6% share in 2024, supported by strong industrial infrastructure and high adoption of technologically advanced monitoring systems.
Market Insights
- Pressure Gauges Market was valued at USD 1,445.09 Million in 2024 and is projected to grow at a CAGR of 3.6% through 2032.
- Growing industrial automation and rising investments in oil & gas, chemicals, and power generation drive strong demand for precision pressure monitoring instruments across end-use sectors.
- Digital gauge adoption accelerates as industries integrate IoT-enabled systems, real-time diagnostics, and predictive maintenance solutions, while analog gauges maintain dominance with a 68.4% share due to cost efficiency and reliability.
- Key players including Ametek, Emerson, Honeywell International, Fluke Corporation, Circor, and Badotherm expand portfolios through material innovation, stainless-steel designs, and application-specific offerings to strengthen market positioning.
- Regionally, North America led with a 32.6% share in 2024, followed by Europe at 28.4% and Asia-Pacific at 24.9%, while Bourdon tube technology remained dominant with a 54.7% share across global industrial applications.
 Market Segmentation Analysis:
By Product Type:
In the Pressure Gauges Market, analog pressure gauges dominated the product type segment with a 68.4% share in 2024, driven by their cost efficiency, operational simplicity, and widespread use in industrial, HVAC, oil & gas, and mechanical systems. Their durability, reliability in harsh environments, and suitability for applications without continuous power supply reinforce their leadership. Digital gauges continue to gain traction due to advanced features such as higher precision, data logging, and remote monitoring; however, their higher cost and maintenance requirements limit broader adoption, ensuring analog systems maintain strong preference across global industries.
- For instance, WIKA's Bourdon tube pressure gauges, featuring elastic elements like stainless steel cases and glycerine filling, excel in hydraulic applications by damping vibrations for clear readability amid aggressive media in oil & gas and refrigeration systems.
By Technology:
Among the technology segments, Bourdon tube pressure gauges held the largest share at 54.7% in 2024, supported by their versatility, wide pressure measurement range, and strong mechanical reliability across industrial operations. Their proven performance in oil & gas, chemical processing, and heavy manufacturing environments further drives adoption. Diaphragm and capsule gauges are increasingly used for low-pressure and corrosive media applications, while other technologies such as bellows, manometers, and differential gauges serve specialized operational needs. However, Bourdon tube systems remain dominant due to their robust design, accuracy, and cost-effective deployment.
- For instance, Budenberg provides DMC-cased Bourdon tube gauges (model 966TGP) with safety patterns for corrosive petrochemical environments, used in producing ethylene and propylene while ensuring longevity through fire-retardant certification.
By Material:
The stainless-steel segment led the materials category with a 61.2% share in 2024, driven by its superior corrosion resistance, high mechanical strength, and long operational life in demanding conditions such as petrochemical, marine, and pharmaceutical applications. Stainless-steel gauges offer enhanced compatibility with aggressive media and high-pressure environments, supporting their widespread use in critical systems. Brass gauges follow in adoption for general-purpose measurement, especially in HVAC and water systems, while aluminum and other metals such as steel, copper, and bronze serve niche applications requiring lightweight or specialized performance characteristics.
Key Growth Drivers
Rising Industrial Automation and Process Optimization
Increasing adoption of automation across manufacturing, oil & gas, chemical processing, and power generation significantly drives demand for advanced pressure gauges. Industries rely on accurate, real-time pressure monitoring to ensure optimal process control, equipment safety, and operational efficiency. As facilities modernize legacy systems and integrate smart pressure monitoring solutions, the need for reliable gauges with high precision and durability expands. Growth in continuous production environments, where predictive maintenance and system uptime are critical, further accelerates market adoption of both analog and digital pressure measurement instruments.
- For instance, Icon Process Controls' OBS Series plastic pressure gauges, featuring ±0.75% accuracy and color range tabs, integrate with gauge guards for chemical processing tanks, providing corrosion-resistant monitoring without filling or assembly.
Expansion of Oil & Gas, Petrochemical, and Energy Infrastructure
Global investments in upstream exploration, midstream transportation networks, and downstream refining operations strengthen the demand for robust pressure gauges capable of withstanding extreme temperatures, corrosive media, and high-pressure conditions. Refineries, LNG terminals, pipeline networks, and power plants depend on continuous pressure measurement to maintain system integrity and regulatory compliance. As developing economies expand energy infrastructure and advanced economies upgrade older facilities, the need for high-performance industrial-grade pressure gauges accelerates, fueling sustained market growth across heavy industrial segments.
- For instance, Bourdon's model 262/263 series uses monel wetted parts for Bourdon tube gauges, providing corrosion resistance against aggressive acids and bases in chemical and petrochemical process industries.
Growing Focus on Safety Compliance and Equipment Reliability
Stricter safety regulations across industries such as pharmaceuticals, food processing, water treatment, and aerospace increase the need for accurate and certified pressure monitoring instruments. Pressure gauges play a critical role in preventing equipment failures, leakages, and pressure-related hazards, making them essential for compliance with ISO, ASME, and national safety standards. Manufacturers increasingly adopt high-precision gauges with improved materials, overload protection, vibration resistance, and tamper-proof designs. This focus on operational safety and reliability strengthens demand for both mechanical and digital pressure gauges across industrial and commercial environments.
Key Trends & Opportunities
Shift Toward Smart, Digital, and Connected Pressure Measurement
A major trend in the Pressure Gauges Market is the transition from conventional analog systems to intelligent digital gauges with features such as wireless connectivity, Bluetooth integration, data logging, and remote diagnostics. These technologies support predictive maintenance and seamless integration with IoT platforms, expanding opportunities in smart factories and digitalized industrial operations. As industries embrace Industry 4.0, manufacturers offering advanced digital gauges with enhanced analytics capabilities, cloud compatibility, and real-time monitoring are well positioned to capture emerging growth opportunities.
- For instance, Honeywell's SmartLine Wireless Gauge Pressure transmitters in Series 800 and 700 provide wireless transmission for remote monitoring in industrial settings.
Rising Adoption of Corrosion-Resistant and Application-Specific Materials
Growing demand for specialized gauges designed for harsh environments presents strong opportunities for manufacturers. End users increasingly prefer stainless steel, Hastelloy, and chemically resistant materials that enhance durability in petrochemical, marine, and pharmaceutical applications. Similarly, sectors such as food & beverage, semiconductor manufacturing, and biotechnology require hygienic and contamination-free pressure measurement solutions. This shift toward material innovation and application customization encourages product differentiation, creating new avenues for suppliers focused on engineered materials, advanced coatings, and industry-specific performance enhancements.
- For instance, WIKA's XSEL® process gauge Model 23x.34 features a bourdon tube, pressure connection, and all wetted parts made of 316L stainless steel, enabling it to handle corrosive petrochemical environments with positive pressures up to 30,000 psi (2,000 bar).
Key Challenges
Price Sensitivity and Competition from Low-Cost Manufacturers
The Pressure Gauges Market faces significant pressure from low-cost manufacturers offering budget alternatives, particularly in Asia-Pacific. This price sensitivity affects margins for established brands and complicates market penetration for advanced digital products. Many end users in cost-driven industries prioritize affordability over long-term performance, limiting adoption of high-specification gauges. As competition intensifies, manufacturers must balance cost efficiency with innovation while addressing customer expectations through value-added features, extended service life, and product differentiation to maintain their market position.
Maintenance Issues, Calibration Needs, and Performance Degradation
Pressure gauges, especially mechanical models, are prone to wear, vibration damage, temperature variations, and calibration drift over time. These performance challenges increase maintenance costs and may compromise measurement accuracy in critical applications. Industries with continuous operations require frequent calibration and replacement cycles, creating operational inefficiencies. Exposure to corrosive media or high-pressure conditions further accelerates degradation. To overcome these challenges, manufacturers must invest in enhanced materials, robust internal mechanisms, and digital alternatives that offer stable readings, reduced maintenance, and extended service reliability.
Regional Analysis
North America
North America led the Pressure Gauges Market with a 32.6% share in 2024, driven by strong industrial activity across oil & gas, petrochemicals, power generation, and manufacturing. The region’s emphasis on workplace safety, advanced process control, and modernization of industrial facilities accelerates adoption of both analog and digital gauges. Growth in shale gas exploration, pipeline expansions, and automation initiatives further strengthens demand. The presence of established instrumentation manufacturers and stringent regulatory frameworks ensures high product quality standards, supporting continued market dominance across critical infrastructure and industrial applications.
Europe
Europe accounted for a 28.4% share in 2024, supported by its advanced industrial base, strong regulatory environment, and rising investments in energy transition infrastructure. The region’s chemical, pharmaceutical, and food processing industries rely heavily on precision pressure monitoring for safety and quality compliance. Growing adoption of digital pressure gauges aligns with Industry 4.0 initiatives across Germany, the UK, France, and Italy. Additionally, stringent EU standards promoting equipment reliability and environmental protection drive the replacement of outdated mechanical gauges with high-performance, corrosion-resistant models suited for demanding industrial conditions.
Asia-Pacific
Asia-Pacific held a 24.9% share in 2024, emerging as the fastest-expanding region due to rapid industrialization, infrastructure development, and expanding manufacturing ecosystems in China, India, Japan, and Southeast Asia. Large-scale growth in chemicals, automotive, construction, and energy sectors fuels significant demand for cost-effective yet durable pressure gauges. Government-led industrial expansion programs and rising adoption of smart factory technologies further boost market penetration. The region also benefits from the presence of numerous low-cost manufacturers, enhancing product availability and supporting widespread use across mid-sized industrial facilities and high-volume commercial applications.
Latin America
Latin America captured a 7.3% share in 2024, driven by growing investments in oil & gas, mining, and food processing industries across Brazil, Mexico, and Argentina. The region’s reliance on pressure monitoring for pipeline operations, refinery safety, and industrial plant efficiency sustains steady demand. Structural modernization initiatives in water management, energy distribution, and manufacturing facilities support further market growth. However, economic fluctuations and cost-sensitive procurement practices influence adoption trends. Increasing awareness of equipment reliability and operational safety encourages gradual transition toward higher-quality pressure gauges and corrosion-resistant materials.
Middle East & Africa
The Middle East & Africa region held a 6.8% share in 2024, supported by expansion in oil & gas exploration, petrochemical refining, and desalination infrastructure. Countries such as Saudi Arabia, UAE, and Qatar continue to invest heavily in pressure-intensive industrial applications requiring robust and high-accuracy gauges. Growing construction activity and power generation projects further enhance regional demand. Africa’s mining, water treatment, and manufacturing sectors contribute to steady adoption, though budget constraints affect high-end product uptake. Increasing focus on operational safety and equipment durability drives gradual shift toward stainless steel and digital monitoring technologies.
Market Segmentations:
By Product Type
- Analog pressure gauges
- Digital pressure gauges
By Technology
- Bourdon tube pressure gauges
- Diaphragm pressure gauges
- Capsule pressure gauges
- Others (Bellows, manometer, differential)
By Material
- Stainless steel
- Brass
- Aluminum
- Others (steel, copper, bronze etc.)
By End Use
- Chemical & petrochemical
- Oil & gas
- Energy & power
- Pharmaceutical
- Water & wastewater treatment
By Geography
- North America
- U.S.
- Canada
- Mexico
- Europe
- Germany
- France
- U.K.
- Italy
- Spain
- Rest of Europe
- Asia Pacific
- China
- Japan
- India
- South Korea
- South-east Asia
- Rest of Asia Pacific
- Latin America
- Brazil
- Argentina
- Rest of Latin America
- Middle East & Africa
- GCC Countries
- South Africa
- Rest of the Middle East and Africa
Competitive Landscape
Competitive landscape in the Pressure Gauges Market features leading manufacturers such as Ametek, Badotherm, Circor, Dwyer, Emerson, Fluke Corporation, Honeywell International, Kobold Instruments, Newbow, and Omega Engineering at the forefront of product innovation, material advancements, and global distribution expansion. These companies focus on enhancing precision, durability, and digital integration to meet rising industrial automation and safety requirements. Many players emphasize developing corrosion-resistant designs, IoT-enabled digital gauges, and application-specific solutions tailored for oil & gas, chemical processing, manufacturing, and pharmaceuticals. Strategic initiatives including product launches, capacity expansions, and aftermarket service offerings strengthen their market presence. Regional players also intensify competition by offering cost-effective analog gauges, particularly in Asia-Pacific, creating pricing pressure on global brands. Manufacturers increasingly adopt partnerships with distributors and engineering firms to expand reach into emerging markets. Overall, the landscape reflects a shift toward technologically advanced, high-reliability pressure measurement solutions aligned with Industry 4.0 and regulatory compliance trends.
Key Player Analysis
- Newbow
- Emerson
- Ametek
- Kobold Instruments
- Omega Engineering
- Fluke Corporation
- Badotherm
- Honeywell International
- Circor
- Dwyer
Recent Developments
- In September 2025 Honeywell International launched its new 13MM Pressure Sensor, a high-precision device designed for cleanroom and semiconductor-grade applications.
- In September 2025, ABB launched the P-300 versatile pressure transmitter series in the United States, featuring high accuracy up to 0.055% and coverage from 0.05 kPa to 105 MPa for petrochemical and chemical applications.
- In May 2024 AMETEK STC (in collaboration with Crystal Engineering) introduced the XP3i digital pressure gauge, offering enhanced accuracy and Bluetooth connectivity over its predecessor.
Report Coverage
The research report offers an in-depth analysis based on Product Type, Technology, Material, End Use and Geography. It details leading market players, providing an overview of their business, product offerings, investments, revenue streams, and key applications. Additionally, the report includes insights into the competitive environment, SWOT analysis, current market trends, as well as the primary drivers and constraints. Furthermore, it discusses various factors that have driven market expansion in recent years. The report also explores market dynamics, regulatory scenarios, and technological advancements that are shaping the industry. It assesses the impact of external factors and global economic changes on market growth. Lastly, it provides strategic recommendations for new entrants and established companies to navigate the complexities of the market.
Future Outlook
- The market will experience steady demand as industries prioritize accuracy, safety, and regulatory compliance.
- Adoption of digital and IoT-enabled pressure gauges will expand across automated and smart factory environments.
- Stainless-steel and corrosion-resistant materials will gain wider acceptance in harsh industrial applications.
- Growth in oil & gas, petrochemicals, and energy infrastructure will continue supporting high-pressure gauge adoption.
- Manufacturers will focus on advanced sensor integration for real-time monitoring and predictive maintenance.
- Low-cost regional suppliers will drive pricing pressure, encouraging global players to differentiate through innovation.
- Replacement demand will increase as industries upgrade legacy systems with modern precision gauges.
- Customized and application-specific gauges will grow in importance across pharmaceuticals, food processing, and water treatment.
- Environmental and safety regulations will accelerate adoption of certified, high-accuracy instruments.
- Emerging markets will offer strong expansion opportunities as industrialization and infrastructure development rise.
Request a Free Sample
Fill in your details and we'll send you a free sample report.
- Sample data tables & charts
- Research methodology
Need a Custom Version of This Report?
Tailor the scope, geography, or segments to your exact requirements.
- Custom geography or segment scope
- Direct access to our analyst team
Frequently Asked Questions
What is the current market size for Pressure Gauges Market, and what is its projected size in 2032?
At what Compound Annual Growth Rate is the Pressure Gauges Market projected to grow between 2024 and 2032?
Which Pressure Gauges Market segment held the largest share in 2024?
What are the primary factors fueling the growth of the Pressure Gauges Market?
Who are the leading companies in the Pressure Gauges Market?
Which region commanded the largest share of the Pressure Gauges Market in 2024?
Table of Content
Chapter 1 Market Segmentation
- 1.1 Segmentation Framework
- 1.1.1 Product and Service Classification
- 1.1.2 Application and End-Use Classification
- 1.1.3 Technology and Solution Classification
- 1.1.4 Customer and Distribution Channel Classification
- 1.1.5 Geographic Segmentation
- 1.1.6 Market Segment Definitions and Boundaries
Chapter 2 Introduction
- 2.1 Report Objectives and Scope
- 2.2 Product Definition and Industry Terminology
- 2.3 Market Inclusions and Exclusions
- 2.4 Research Process
- 2.4.1 Primary Research and Expert Interviews
- 2.4.2 Secondary Research and Source Review
- 2.4.3 Top-Down and Bottom-Up Estimation
- 2.4.4 Data Triangulation and Verification
- 2.5 Market Size Measurement Basis
- 2.5.1 2024: USD 1,445.09 Million → 2032: USD 1,917.66 Million
- 2.6 Historical and Forecast Reference Periods
- 2.6.1 Base Year: 2024
- 2.6.2 Forecast Period: 2024-2032
- 2.7 Research Assumptions and Limitations
Chapter 3 Executive Summary
- 3.1 Market Snapshot and Key Findings
- 3.2 Base-Year Market Size, 2024
- 3.3 Forecast Market Size, 2032
- 3.4 Revenue and Volume Growth Outlook
- 3.5 Key Demand and Supply Indicators
- 3.6 Leading Market Segments
- 3.7 Fastest-Growing Market Opportunities
- 3.8 Regional Performance Highlights
- 3.9 Technology and Industry Transformation
- 3.10 Competitive Landscape Summary
- 3.11 Analyst View and Strategic Implications
Chapter 4 Global Pressure Gauges Market Trends and Developments
- 4.1 Historical Industry Development
- 4.2 Recent Market Trends and Developments
- 4.3 Demand and Customer Behavior Trends
- 4.4 Technology and Product Innovation
- 4.5 Artificial Intelligence, Automation and Digitalization
- 4.6 Local Manufacturing and Supply Chain Realignment
- 4.7 Industry Partnerships, Mergers and Acquisitions
- 4.8 Sustainability and Circular Economy Developments
- 4.9 Government and Private Sector Investment Trends
- 4.10 Emerging Business Models and Commercialization
- 4.11 Industry Developments and Announcements
Chapter 5 Global Pressure Gauges Market Production, Supply and Demand Analysis
- 5.1 Demand Trend and Consumption Analysis
- 5.2 Demand Forecast, 2024-2032
- 5.3 Production and Output Trend
- 5.4 Production and Output Forecast, 2024-2032
- 5.5 Installed Capacity and Capacity Utilization
- 5.6 Company-Wise Production Plants and Statistics
- 5.6.1 Installed Production Capacity
- 5.6.2 Actual Production
- 5.6.3 Planned Capacity and Expansion Targets
- 5.7 Supply Chain Structure and Procurement Trends
- 5.8 Supply-Demand Gap and Bottlenecks
- 5.9 Import Dependence and Sourcing Structure
- 5.10 Contract Manufacturing and Outsourcing
- 5.11 Regional Supply and Demand Concentration
Chapter 6 Global Pressure Gauges Market Pricing Analysis
- 6.1 Pricing Structure and Measurement
- 6.2 Historical Pricing Trends
- 6.3 Pricing Outlook, 2024-2032
- 6.4 Average Selling Price and Unit Economics
- 6.5 Pricing by Product and Market Segment
- 6.6 Geographic Pricing Differences
- 6.7 Key Input, Energy, Labor and Logistics Costs
- 6.8 Contract Pricing and Purchasing Models
- 6.9 Pricing Sensitivity and Competitive Positioning
- 6.10 Price, Margin and Profitability Implications
Chapter 7 Global Pressure Gauges Market Dynamics
- 7.1 Market Growth Drivers
- 7.1.1 Demand-Side Drivers
- 7.1.2 Technology and Innovation Drivers
- 7.1.3 Infrastructure and Investment Drivers
- 7.1.4 Regulatory and Policy Drivers
- 7.2 Market Restraints
- 7.2.1 Cost and Affordability Constraints
- 7.2.2 Technology and Adoption Barriers
- 7.2.3 Supply Chain and Operational Constraints
- 7.3 Market Challenges
- 7.3.1 Competitive Pressure and Margin Erosion
- 7.3.2 Skills, Infrastructure and Implementation Gaps
- 7.4 Emerging Market Opportunities
- 7.5 Market Dynamics Impact and Time-Horizon Assessment
Chapter 8 Global Pressure Gauges Value Chain Analysis
- 8.1 Industry Value Chain Overview
- 8.2 Upstream Suppliers and Critical Inputs
- 8.3 Technology and Component Providers
- 8.4 Manufacturing or Service Delivery
- 8.5 Distribution, Channel Partners and Integrators
- 8.6 Downstream Applications and End Users
- 8.7 Value Addition and Profit Pools
- 8.8 Vertical Integration and Outsourcing
- 8.9 Supplier Concentration and Risk
- 8.10 Supply Chain Localization and Resilience
Chapter 9 Global Pressure Gauges Market Regulations and Policies
- 9.1 Relevant Laws, Standards and Compliance Frameworks
- 9.2 Product, Service, Safety and Quality Requirements
- 9.3 Government Policies, Incentives and Subsidies
- 9.4 Imports, Exports and Trade Barriers
- 9.5 Public Procurement and Local Content Requirements
- 9.6 Environmental and Sustainability Compliance
- 9.7 Upcoming Policy Changes and Market Implications
Chapter 10 Global Pressure Gauges Market Hotspots and Opportunities
- 10.1 Market Opportunity Mapping and Growth Hotspots
- 10.2 High-Growth Applications and Customer Groups
- 10.3 Underserved Markets and White-Space Opportunities
- 10.4 Emerging Technology and Product Opportunities
- 10.5 New Capacity and Investment Hotspots
- 10.6 Market Entry and Expansion Opportunities
- 10.7 Distribution and Partnership Opportunities
- 10.8 Near-Term and Long-Term Commercial Potential
- 10.9 Opportunity Attractiveness and Execution Risks
Chapter 11 Global Pressure Gauges Market Outlook, 2024-2032
- 11.1 Market Size and Analysis
- 11.1.1 Revenue (Market Measurement: 2024: USD 1,445.09 Million → 2032: USD 1,917.66 Million)
- 11.1.2 Market Volume and Quantity Sold
- 11.1.3 Historical Market Size
- 11.1.4 Base-Year Market Size, 2024
- 11.2 Market Forecast, 2024-2032
- 11.2.1 Revenue Forecast to 2032
- 11.2.2 Volume Forecast to 2032
- 11.2.3 CAGR and Year-on-Year Growth
- 11.2.4 Incremental Revenue Opportunity
- 11.3 Forecast Assumptions and Scenario Analysis
- 11.3.1 Base-Case Forecast
- 11.3.2 Optimistic and Conservative Scenarios
- 11.3.3 Technology, Pricing and Policy Sensitivities
- 11.4 Market Attractiveness and Growth Outlook
Chapter 12 Global Pressure Gauges Market Segmentation and Outlook
- 12.1 Segmentation Summary and Market Shares, 2024
- 12.2 Largest and Fastest-Growing Segments
- 12.3 Segment Growth Comparison
- 12.4 Segment Attractiveness and Priority Matrix
Chapter 13 Global Pressure Gauges Geographic Market Outlook, 2024-2032
- 13.1 Regional Market Size and Share, 2024
- 13.2 Regional Market Forecast, 2024-2032
- 13.3 Regional Pricing, Production and Demand Differences
- 13.4 North America
- 13.4.1 United States
- 13.4.2 Canada
- 13.4.3 Mexico
- 13.5 Europe
- 13.5.1 Germany
- 13.5.2 France
- 13.5.3 Italy
- 13.5.4 United Kingdom
- 13.5.5 Spain
- 13.5.6 Poland
- 13.5.7 Russia
- 13.5.8 Netherlands
- 13.5.9 Belgium
- 13.5.10 Sweden
- 13.5.11 Denmark
- 13.5.12 Norway
- 13.5.13 Rest of Europe
- 13.6 Asia Pacific
- 13.6.1 China
- 13.6.2 India
- 13.6.3 Japan
- 13.6.4 South Korea
- 13.6.5 Thailand
- 13.6.6 Indonesia
- 13.6.7 Vietnam
- 13.6.8 Malaysia
- 13.6.9 Australia
- 13.6.10 Rest of Asia Pacific
- 13.7 Latin America
- 13.7.1 Brazil
- 13.7.2 Argentina
- 13.7.3 Colombia
- 13.7.4 Chile
- 13.7.5 Rest of Latin America
- 13.8 Middle East
- 13.8.1 Saudi Arabia
- 13.8.2 United Arab Emirates
- 13.8.3 Turkey
- 13.8.4 Israel
- 13.8.5 Iran
- 13.8.6 Rest of the Middle East
- 13.9 Africa
- 13.9.1 South Africa
- 13.9.2 Egypt
- 13.9.3 Nigeria
- 13.9.4 Morocco
- 13.9.5 Rest of Africa
- 13.10 Regional Investment, Policy and Supply Chain Differences
- 13.11 Regional Competitive Landscape
- 13.12 Geographic Growth Hotspots
Chapter 14 Global Pressure Gauges Technology, Innovation and Sustainability Outlook
- 14.1 Technology Landscape and Maturity
- 14.2 Product, Process and Service Innovation
- 14.3 AI, Automation and Digital Tools in the Industry
- 14.4 Technology Adoption and Performance Benchmarking
- 14.5 Innovation Pipeline and R&D Investment
- 14.6 Patent and Intellectual Property Trends
- 14.7 Energy Efficiency and Resource Management
- 14.8 Sustainability, Recycling and Circularity
- 14.9 Technology Roadmap, 2024-2032
- 14.10 Risks of Obsolescence and Technology Substitution
Chapter 15 Global Pressure Gauges Market Key Strategic Imperatives
- 15.1 Growth and Market Entry Priorities
- 15.2 High-Return Products and Segments
- 15.3 Pricing, Profitability and Cost Optimization
- 15.4 Technology Investment and Product Differentiation
- 15.5 Supply Chain Localization and Resilience
- 15.6 Distribution and Customer Acquisition
- 15.7 Partnership, Acquisition and Capacity Strategy
- 15.8 Regional Expansion Priorities
- 15.9 Short-, Medium- and Long-Term Actions
Chapter 16 Competition Outlook
- 16.1 Industry Competition Characteristics
- 16.2 Market Structure and Concentration
- 16.3 Market Share and Competitive Positioning, 2024
- 16.4 Company-Wise Revenue and Product Benchmarking
- 16.5 Production and Service Capacity Benchmarking
- 16.6 Technology, Pricing and Differentiation
- 16.7 Regional Footprint and Distribution Strength
- 16.8 Mergers, Acquisitions and Strategic Alliances
- 16.9 New Entrants and Competitive Threats
- 16.10 Porter's Five Forces and Industry Attractiveness
- 16.11 Competitive Outlook, 2024-2032
Chapter 17 Company Profiles
- 17.1 Company Coverage and Selection Criteria
- 17.2 Leading Market Participants – Standard Profile Structure
- 17.2.1 Business Description
- 17.2.2 Company Ownership and Geographic Presence
- 17.2.3 Product and Service Portfolio
- 17.2.4 Manufacturing and Operating Footprint
- 17.2.5 Production Capacity and Expansion Plans
- 17.2.6 Financial Performance and Investment
- 17.2.7 Market Share and Competitive Position
- 17.2.8 Technology and Innovation Capabilities
- 17.2.9 Strategic Alliances or Partnerships
- 17.2.10 Recent Developments
- 17.2.11 Growth Strategy and Outlook
- 17.3 Other Relevant Market Participants
Note: Every listed company is profiled on the structure shown under the first company. The company list is preliminary and may change based on research findings, market developments, data availability and client requirements.
Chapter 18 Disclaimer
- 18.1 Research and Forecast Disclaimer
- 18.2 Data Source and Estimation Limitations
Note: The depth of individual sections depends on data availability for this market. Volume, capacity, trade and other unit-based metrics are included where applicable.

