Pre-summer cleaning and repairs anchor service spend
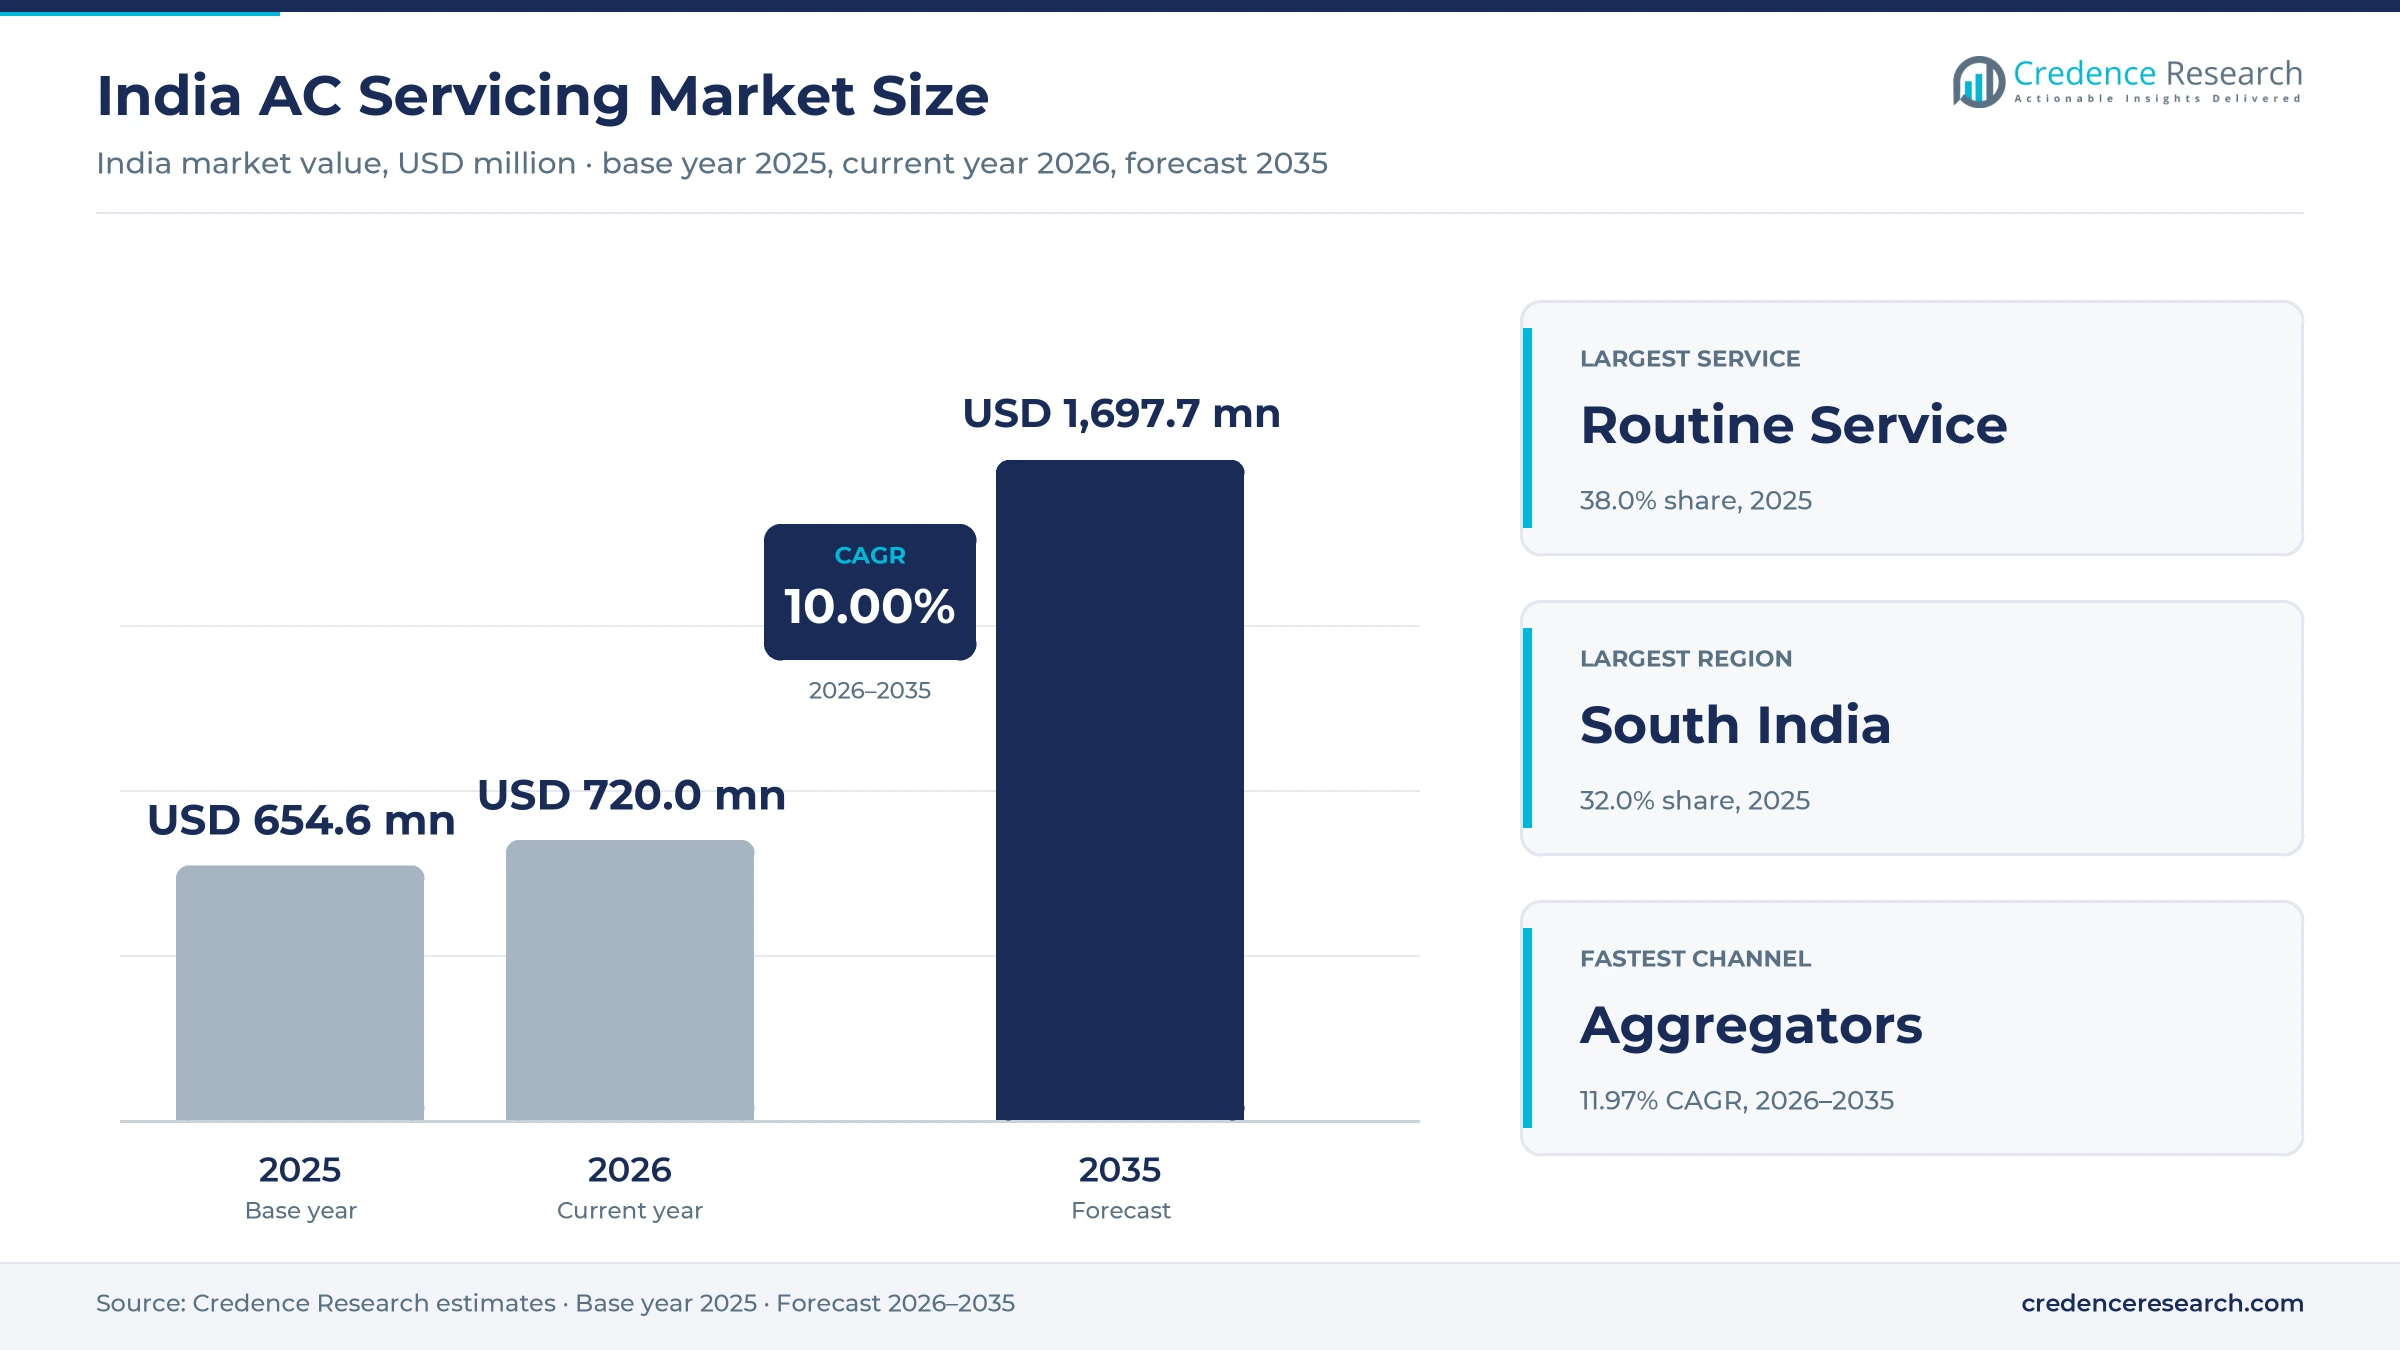
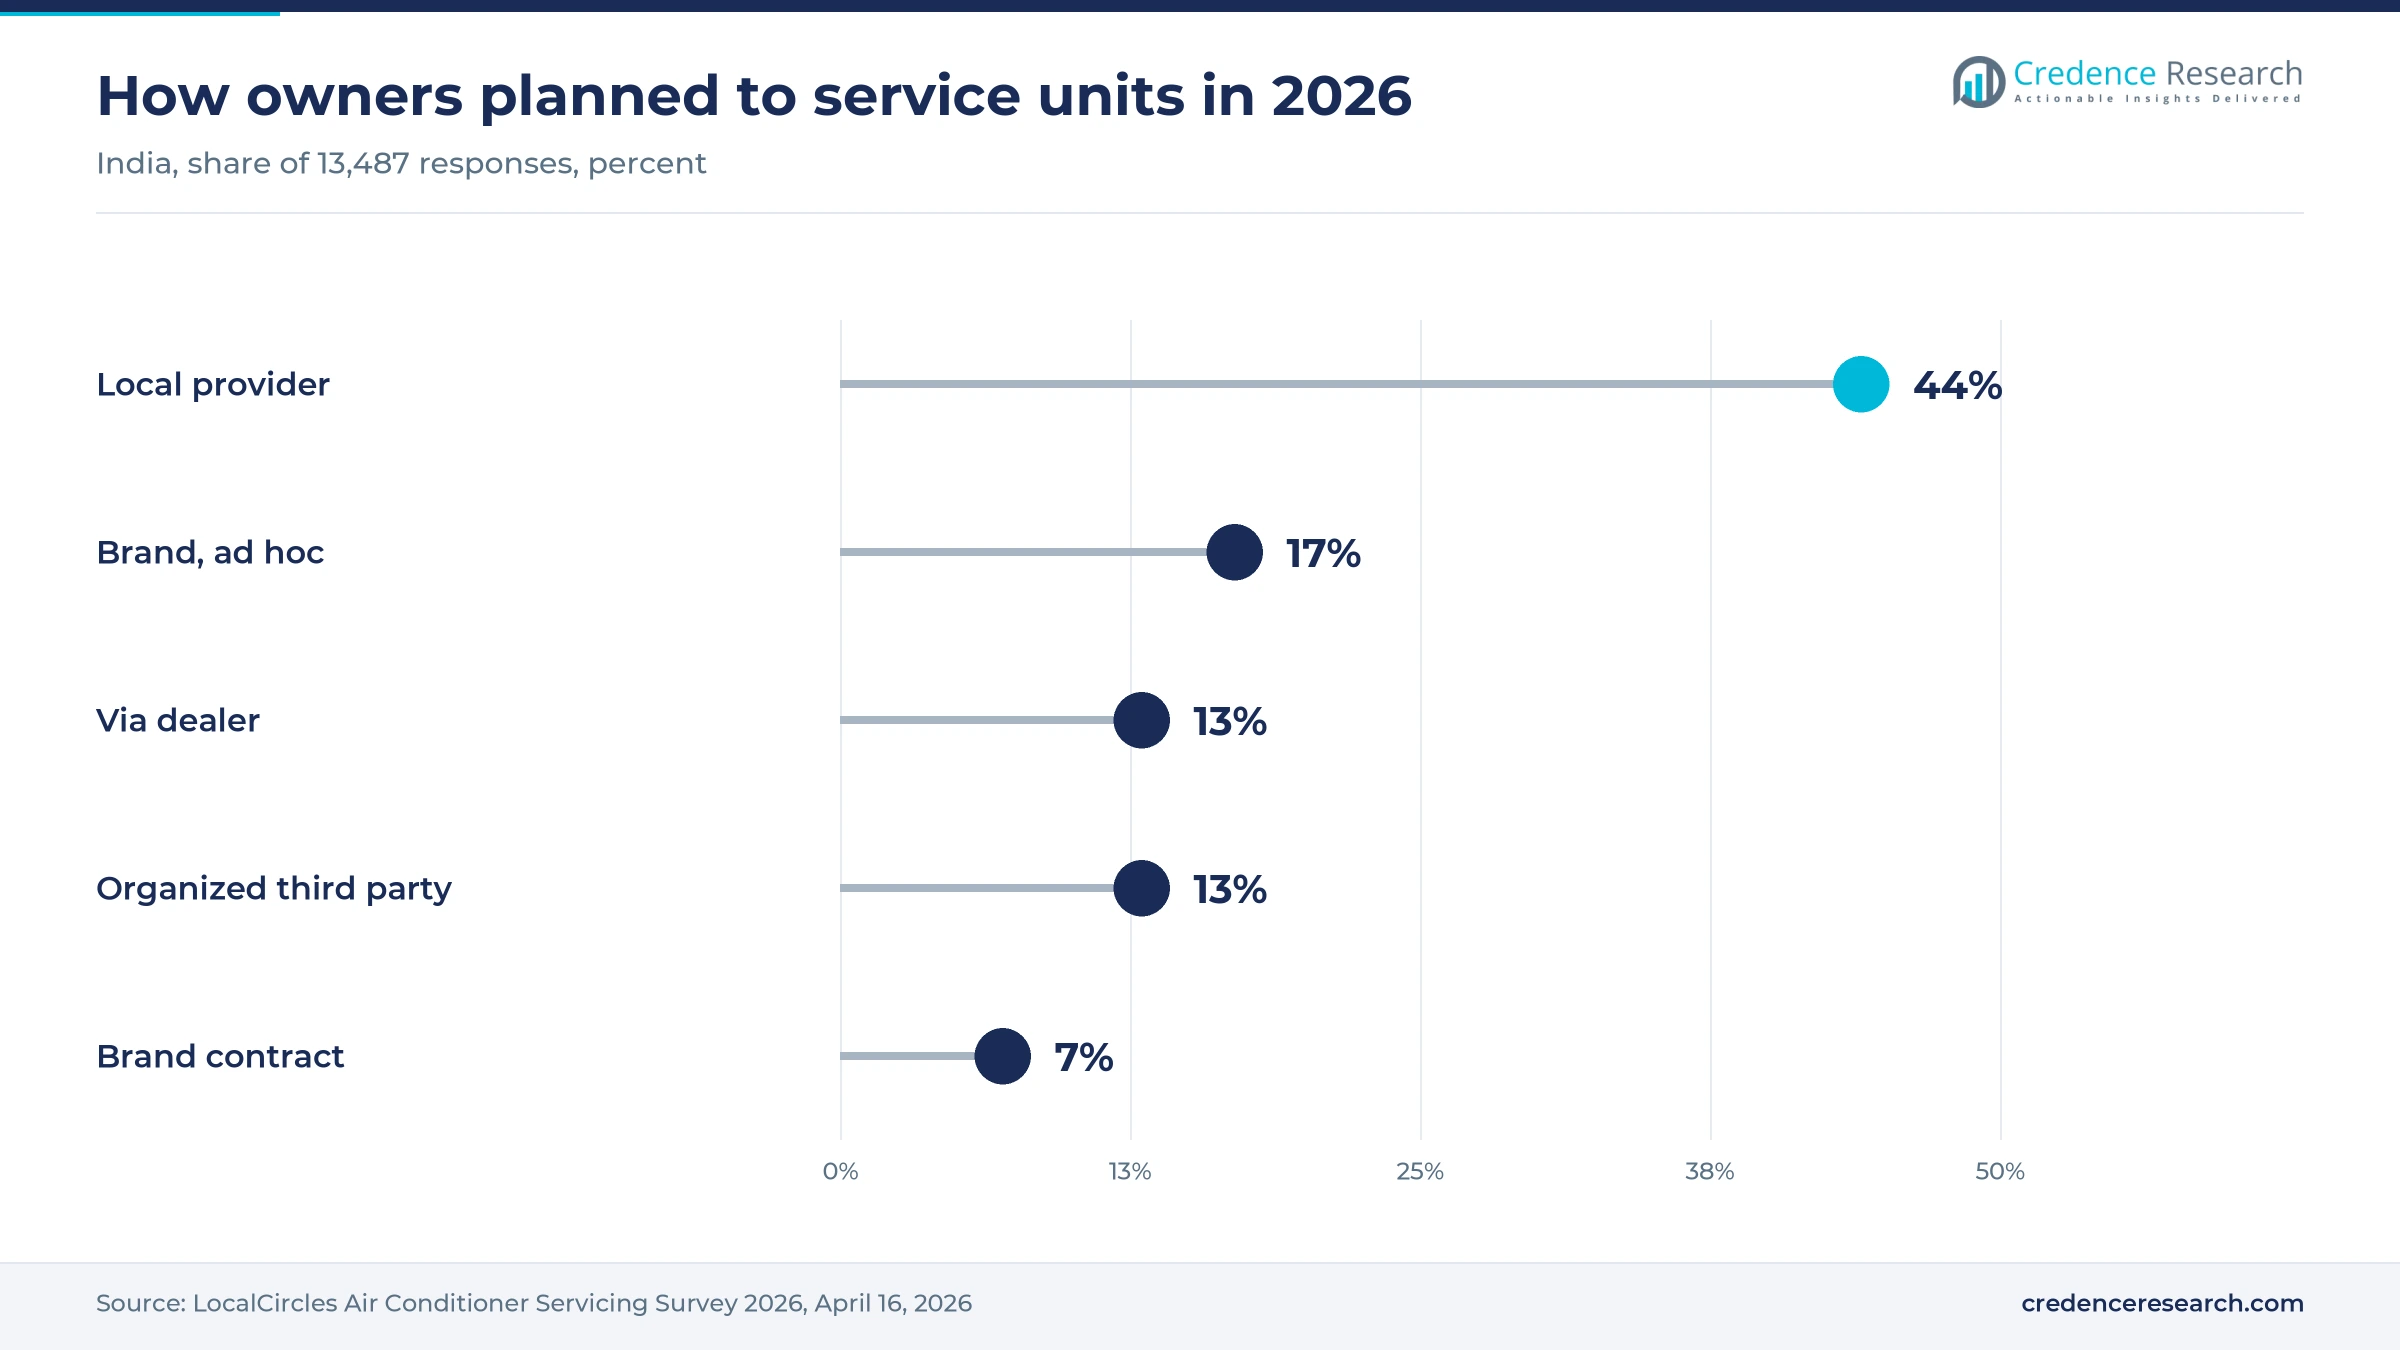
The India AC servicing market was valued at USD 654.6 million in 2025 and is projected to increase from USD 720.0 million in 2026 to USD 1.70 billion by 2035, registering a CAGR of 10.00% during 2026–2035. Demand comes from households and small offices that book pre-summer cleaning, gas refills, breakdown repairs and the installation of new split units. South India held the largest regional share, 32.0% in 2025, because humid coastal cities keep units running for most of the year. Northeast India is the fastest-growing region at 11.20% a year, starting from a very small base. The installed fleet keeps expanding, since ICRA put FY25 room AC sales at a record 12.5–13.0 million units. Channels are also changing, because LocalCircles found in April 2026 that 44% of owners planned to use a local provider and 24% planned brand servicing. Skills remain the main constraint, as CEEW expects the need for skilled technicians to rise from about 0.37 million to 2 million by 2036-37.
Cleaning, refills, repairs and installs set the scope
The market counts fees that owners pay for routine cleaning, gas refills, repairs and the installation or reinstallation of room air conditioners in homes and small offices. It covers paid visits booked with brand service centers, through apps and aggregators, and directly with local technicians, as well as annual maintenance contracts sold after the warranty period.
The market excludes the sale of new units, spare parts sold over the counter, and large central plant contracts for chillers and VRF systems in commercial buildings. Value flows from owners to service companies and platforms, which then pay technicians, parts suppliers, refrigerant distributors and lead-generation partners.
India AC Servicing Market Insights
- Service revenue rises from USD 654.6 million in 2025 to USD 1.70 billion by 2035 at a 10.00% CAGR, as a fleet of tens of millions of room units needs cleaning, gas and repair.
- South India held 32.0% of 2025 value, because humid coastal cities such as Chennai and Hyderabad run air conditioners for most of the year.
- Routine Service accounted for 38.0% of 2025 value, as LocalCircles found in April 2026 that only 3% of owners planned to skip servicing.
- Urban Company was reported in October 2025 to be exploring room AC assembly under its Native brand, linking hardware with its technician network.
- CEEW estimated in November 2025 that skilled technician demand rises from about 0.37 million in 2022-23 to about 2 million by 2036-37.
Routine service and local technicians lead the market
Why routine service holds the largest job share
Based on service, the market is categorized into routine service, gas refill, repair and installation. Routine Service led with 38.0% of 2025 value because most owners book at least one cleaning before summer, and LocalCircles found in April 2026 that only 3% planned to skip servicing because their unit worked fine. Urban Company prices foam and power-jet cleaning from Rs 449, which keeps the job affordable for most homes. Installation grows fastest at 10.89% a year as new units keep arriving, and PTI reported that Voltas alone sold 1 million room ACs from April to June 2026. Gas refill and repair demand follows the aging installed base of older units.
Households dominate while small offices buy contracts
Based on customer, the market is categorized into households and small offices. Households led with 76.0% of 2025 value because room AC ownership is concentrated in homes, and NFHS-5 data analyzed by The Hindu showed that about 40% of urban households owned an AC or cooler in 2019–21. Households also grow fastest at 10.15% a year as ownership spreads, since CEEW expects room AC sales to keep growing about 12% a year from 2028 to 2037. Small offices, clinics and shops buy split units and contract visits through local dealers, and Godrej offers labor contracts with two services a year for such buyers.
Local technicians lead as app booking grows fastest
Based on channel, the market is categorized into brand service, aggregators and local technicians. Local Technicians led with 50.0% of 2025 value because 44% of owners planned to use a local provider in 2026, according to LocalCircles, against 24% who planned brand servicing. Price explains much of this gap, since high brand charges were the top complaint in the same survey. Aggregators grow fastest at 11.97% a year as app booking spreads, and Entrackr reported that Urban Company had 6.8 million annual transacting users across 51 cities in the year to March 2025. Brand service keeps in-warranty repairs, where Blue Star works through more than 2,100 service partners.
| Segment Group | Leading Sub-segment | Share, 2025 | Fastest-growing Sub-segment | CAGR, 2026–2035 |
|---|---|---|---|---|
| By Service | Routine Service | 38.0% | Installation | 10.89% |
| By Customer | Households | 76.0% | Households | 10.15% |
| By Channel | Local Technicians | 50.0% | Aggregators | 11.97% |
Request a Free Sample
Fill in your details and we'll send you a free sample report.
- Sample data tables & charts
- Research methodology
Heat, contracts and app booking lift job volumes
Hotter summers and larger fleets raise service calls
Air-conditioner servicing follows heat, because every hot week brings cleaning calls, gas top-ups and breakdown repairs. India recorded 536 heatwave days from April to June 2024, the highest since 2010, according to IMD data reported by National Herald, and Delhi stayed above 40°C for 40 straight days from May 13. The fleet that needs this care is also larger, since CEEW put the room AC stock at about 66 million units in 2022-23 and projects 345 million by 2036-37. CEEW also cites UNEP findings that units can lose up to 50% of their performance without regular servicing. IMD again forecast above-normal heatwave days for April to June 2026. In the Credence Research model this adds about 3.70 percentage points to annual growth to 2035.
Maintenance contracts improve repeat job flow
Annual maintenance contracts turn one-off visits into scheduled jobs, which smooths technician calendars outside the April to July peak. Godrej sells comprehensive and labor contracts for air conditioners with two services a year, at what it describes as less than Rs 90 a month. LG promoted its Best Care AMC with Gold and Platinum plans in May 2026, offering discounted pricing for buyers who sign within 30 days of purchase. Urban Company says annual service contracts in India range from Rs 2,000 to Rs 8,000 depending on the unit and terms. Uptake still has room to grow, because only 7% of owners planned to use a brand contract in 2026, according to LocalCircles. In the Credence Research model this adds about 2.70 percentage points to annual growth to 2035.
Aggregators and online booking lift technician use
Online booking lets technicians fill more slots each day, because platforms route jobs by location, skill and time window. Urban Company reported 6.8 million annual transacting users across 51 cities in the year to March 2025, according to Entrackr, and AC repair is one of its core categories. Its IPO was subscribed 103.63 times in September 2025, YourStory reported, which gave the platform capital to recruit and train more partners. In October 2025, Outlook Business reported that Urban Company had rolled out a device co-pilot that guides technicians through standard AC fault checks. Rivals are arriving too, since Entrackr named Snabbit and Pronto as emerging competitors and noted that Swiggy entered home services with Pyng. In the Credence Research model this adds about 2.00 percentage points to annual growth to 2035.
Record unit sales widen the installation base
Each new room air conditioner creates an installation job and a stream of later visits, so record sales widen the paid base. ICRA said in September 2025 that industry sales reached a record 12.5–13.0 million units in FY25, even though it expected a 10–15% dip in FY26 after extended rains. Demand rebounded in 2026, and PTI reported on June 21, 2026, that Voltas sold 1 million units in the April to June quarter alone. LG Electronics India also said it crossed 1 million AC sales in the first calendar quarter of 2026. The GST rate on air conditioners was also cut from 28% to 18%, as ICRA noted in the same report. These sales feed the installation segment directly, because nearly every new split unit needs mounting, piping and a first test run.
Platforms and refrigerant rules are reshaping service work
Shift toward platform-owned hardware and diagnostics
Service platforms are shifting from booking tools toward owning the full appliance relationship, which changes who controls repeat jobs. Outlook Business reported on Oct. 6, 2025, that Urban Company was in early talks with component suppliers to assemble room ACs under its Native brand. Native already sells water purifiers and smart locks, and Entrackr counted 17 service categories on the platform in FY25. The same report said Urban Company had launched a device co-pilot to guide technicians through standard fault checks. Daikin India also lets owners raise service requests on WhatsApp and through national helplines, which shows brands digitizing their own channels. Organized providers still have ground to win, because their share of planned servicing slipped two points to 13% between 2023 and 2026, according to LocalCircles.
Rise of refrigerant transition work in gas jobs
The move away from older refrigerants is creating more specialized gas handling work for trained technicians. India must fully phase out HCFCs by 2030 under its Montreal Protocol commitments, Energetica India reported and it starts phasing down HFCs from 2028 under the Kigali Amendment. Servicing accounts for up to 40% of annual refrigerant demand in India, according to the cooling plan figures cited by CEEW. The India Cooling Action Plan summarized by the IEA also targets a 25% to 30% cut in refrigerant demand by 2037-38. Yet over 60% of technicians surveyed by CEEW in April 2024 reported little or no knowledge of new refrigerants. As a result, gas refill jobs increasingly need recovery tools and leak testing rather than simple top-ups.
Opening in certified technician training
Certified training is an opening for brands, platforms and institutes, because demand for skilled hands will far outrun supply. CEEW estimated in November 2025 that India needed about 0.37 million skilled room AC technicians in 2022-23 and will need about 2 million by 2036-37. It put the cost of skilling them at about Rs 2,200 crore by 2037, with 200 hours of short-term training per new technician. The India Cooling Action Plan had set a goal of training and certifying 100,000 servicing technicians by 2022-23 with the Skill India Mission. CEEW's April 2024 survey found that 73% of technicians would take a test to earn a government-approved certificate. Providers that train and certify their own crews can therefore charge more and win contract renewals.
Opening for organized providers in smaller cities
Smaller cities offer an opening for organized providers that can match local prices with brand-grade quality. LocalCircles drew 56% of its respondents from tier 2, 3 and four districts in its April 2026 survey, where local providers win most jobs. The same survey found that 67% of owners avoided brand service because of high cost, up from 54% in 2023. Blue Star said in March 2026 that it works with more than 2,100 service partners, a network that can reach these towns. Urban Company lists AC service from Rs 449 and repair visits from Rs 299, the price points that platforms bring to new cities. IMD's April 2026 outlook also flagged heatwaves in eastern and northeastern states, where organized coverage is still thin.
Technician gaps and weather swings strain providers
Skilled technician shortage caps peak capacity
Skilled technicians are scarce, which caps how many jobs the market can serve in peak weeks. CEEW estimated in November 2025 that India needed about 0.37 million skilled room AC technicians in 2022-23, while demand will rise to about 2 million by 2036-37. Its April 2024 survey found that two in five technicians had received no formal training at all. Startup Feed reported in February 2026 that Delhi-NCR wait times could reach four to five days in March 2026. Providers respond with training, peak-season incentives and earlier contract visits.
High brand charges push owners to informal work
Many owners distrust authorized service, which keeps price pressure on brand channels and contracts. LocalCircles found in April 2026 that 67% of owners avoided brand servicing because of high cost, while 42% cited a complicated contact process. The share planning to use a brand maintenance contract fell from 13% in 2023 to 7% in 2026. Brands therefore lose repeat work to local technicians, who charge less but rarely offer warranties. Transparent price lists and app booking can help brands recover some of that work.
Weather swings make demand hard to plan
Service demand swings with the weather, which makes staffing hard to plan for every provider. ICRA said in September 2025 that room AC sales fell 15–20% from April to July 2025 after extended rains, following 40–50% growth a year earlier. It expected FY26 volumes of 11.0–11.5 million units, down 10–15%, which also trimmed installation jobs. Providers that rely on summer cleaning calls see idle crews in a cool year. Contracts with fixed visit dates and off-season repair offers soften these swings.
Outdated skills raise risks with new refrigerants
Newer refrigerants demand careful handling, and many technicians have not been retrained for them. CEEW's April 2024 survey found that 57% of technicians last attended training more than five years earlier. Over 60% said they knew little or nothing about new refrigerants, and online videos were their main source of information. Poor gas handling risks leaks, lower efficiency and safety incidents in homes. Brands and platforms can close the gap with refresher courses, since 73% of surveyed technicians said a government training program would be useful.
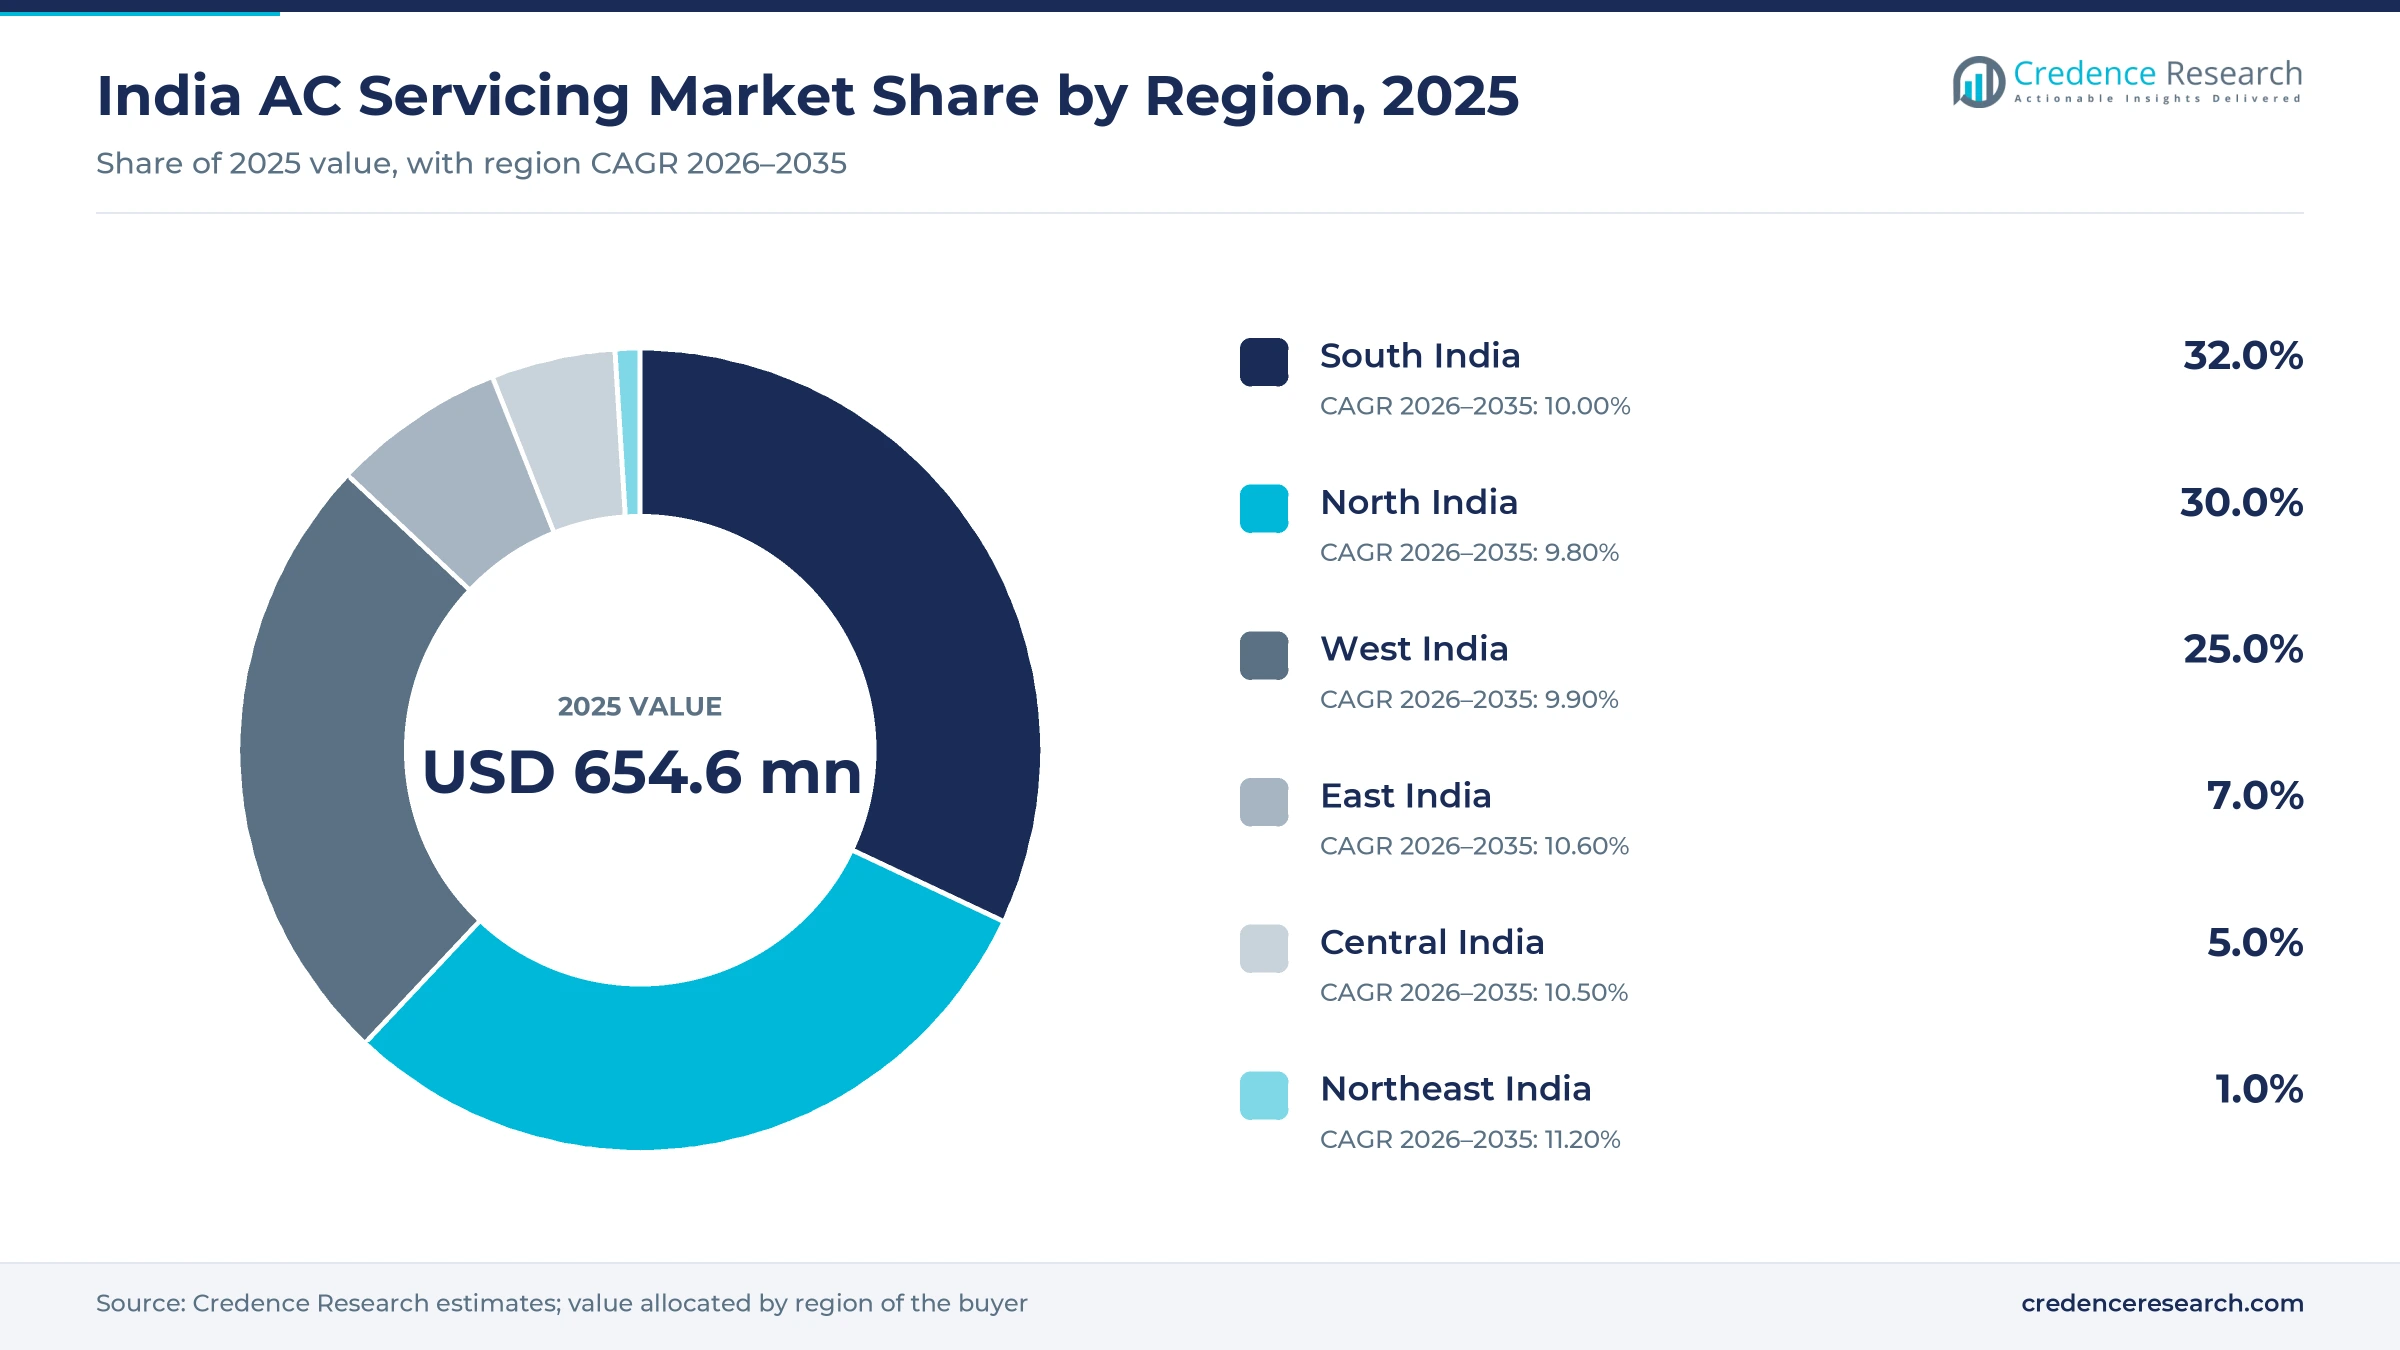
Humid southern cities run units almost all year
| Region | Value, 2025 (USD million) | Share, 2025 | CAGR, 2026–2035 |
|---|---|---|---|
| South India | 209.5 | 32.0% | 10.00% |
| North India | 196.4 | 30.0% | 9.80% |
| West India | 163.6 | 25.0% | 9.90% |
| East India | 45.8 | 7.0% | 10.60% |
| Central India | 32.7 | 5.0% | 10.50% |
| Northeast India | 6.5 | 1.0% | 11.20% |
South India leads on humid, year-round cooling
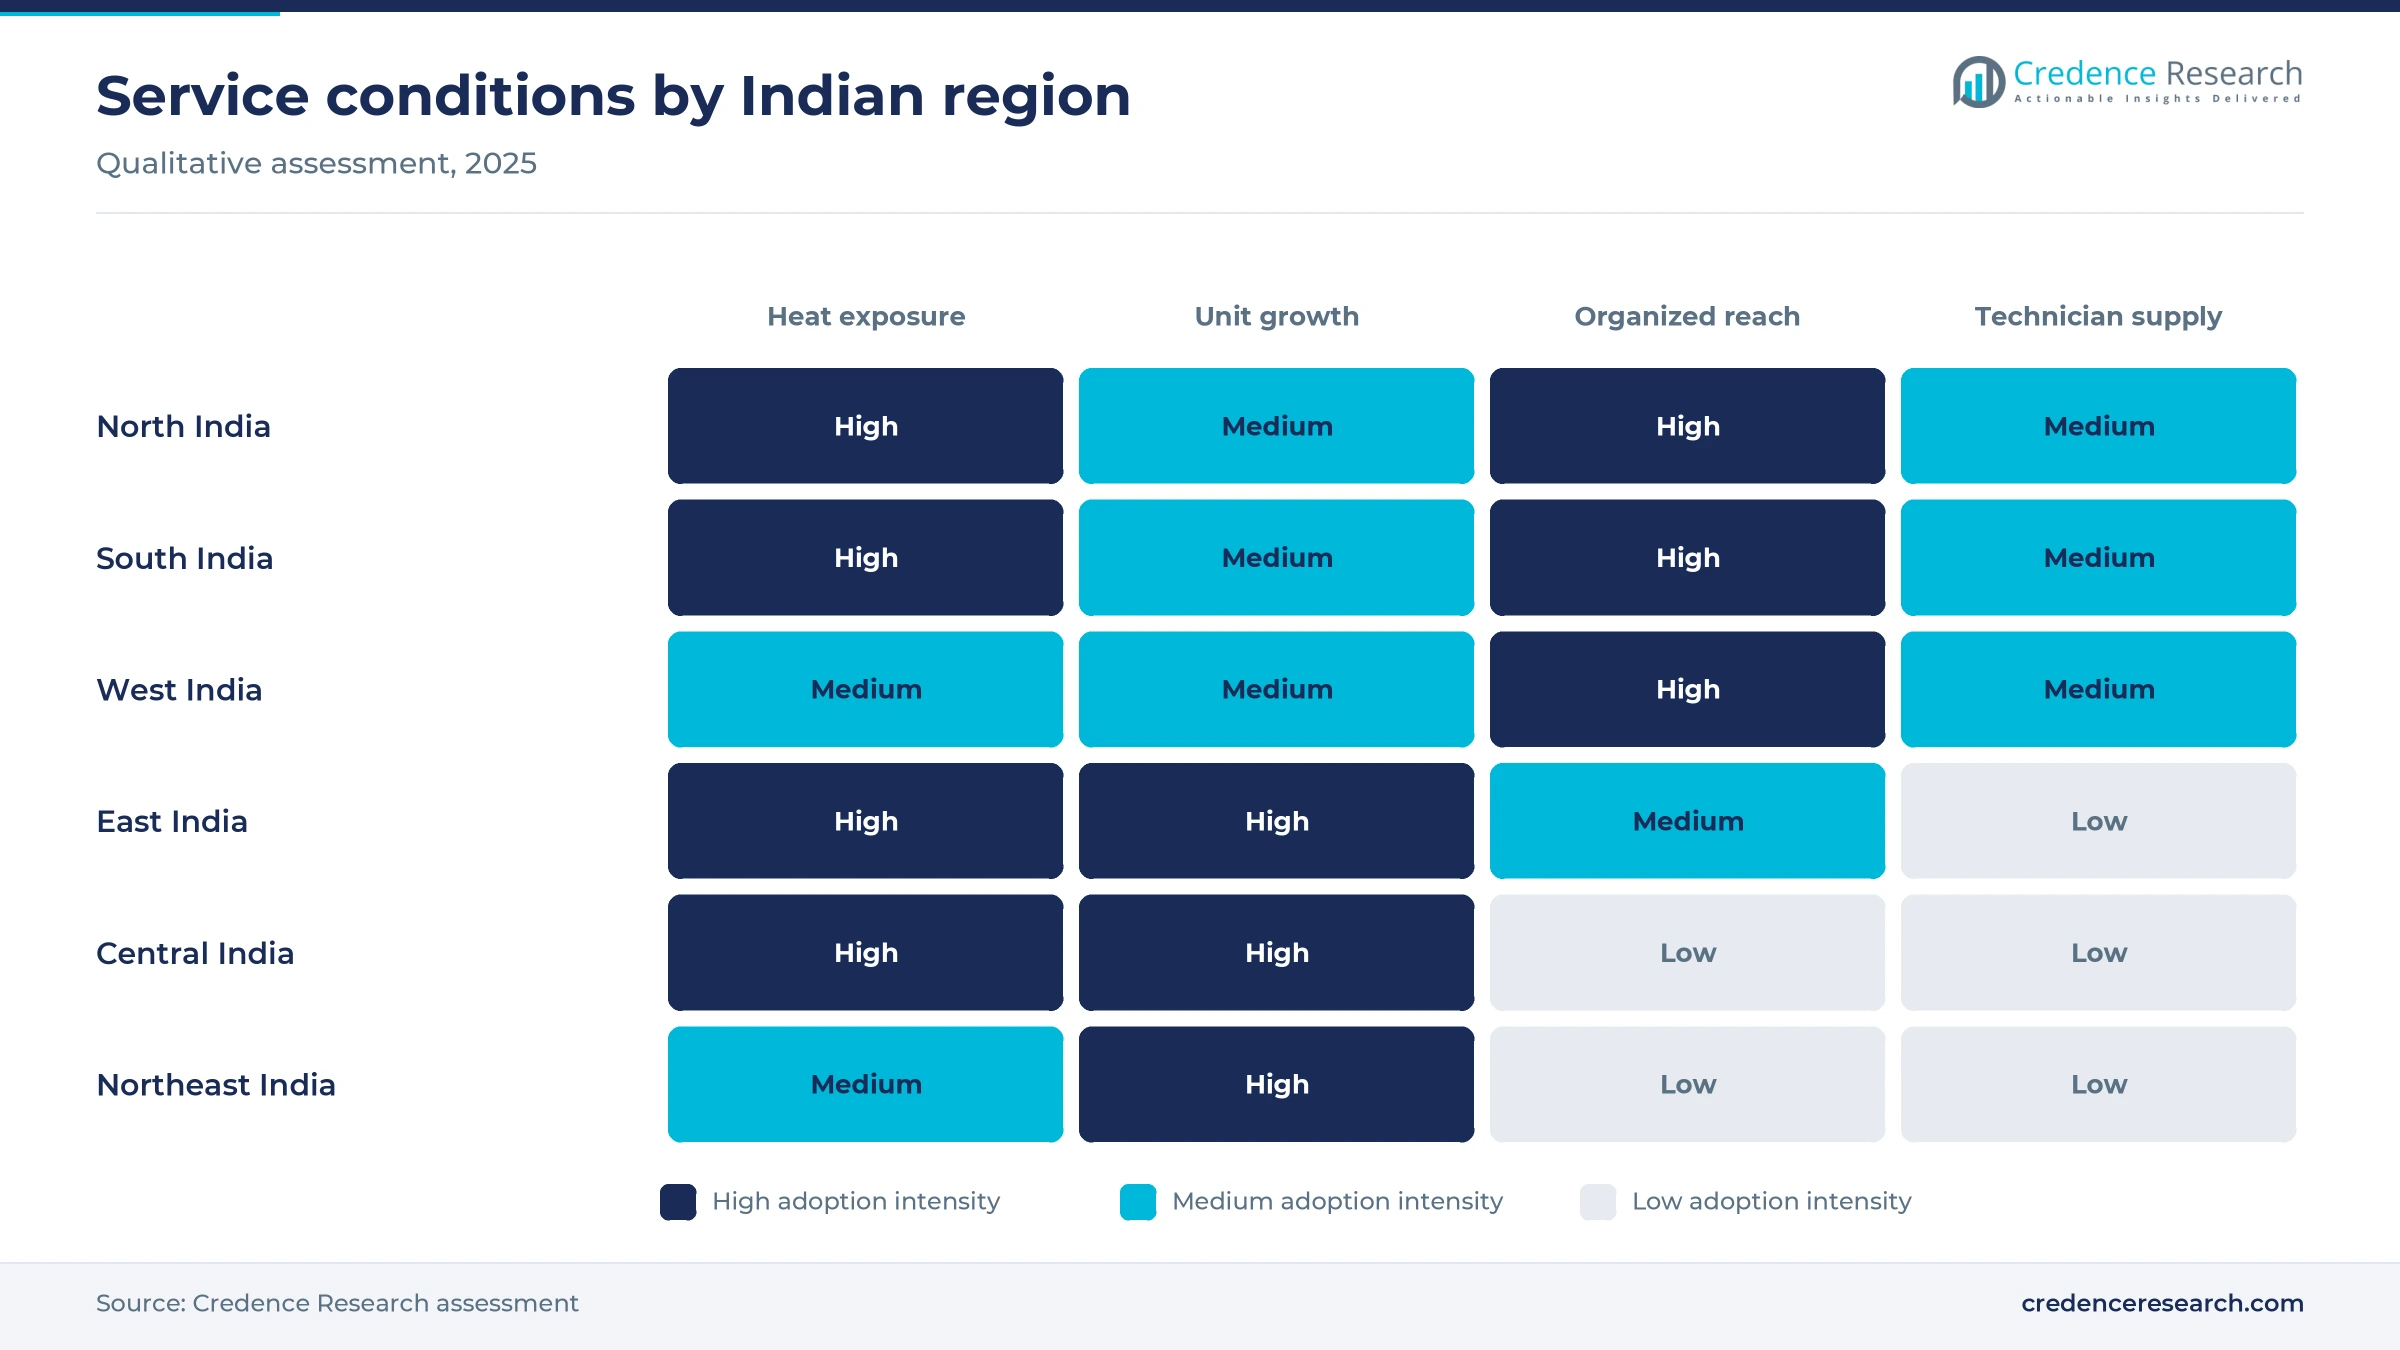
South India held 32.0% of 2025 value and grows at 10.00% a year, the largest zone in the India AC servicing market. Hot, humid coastal cities such as Chennai, Hyderabad and Bengaluru keep units running for much of the year, which raises cleaning and repair frequency. IMD's April 2026 outlook flagged above-normal heatwave days in coastal Tamil Nadu, Puducherry and Andhra Pradesh, Down To Earth reported. ICRA also expected the FY26 sales recovery to come mainly from southern and western regions.
North India packs demand into a short, hot peak
North India held 30.0% of 2025 value and grows at 9.80% a year, driven by intense but shorter summers. Delhi stayed above 40°C for 40 consecutive days from May 13, 2024, and parts of Rajasthan crossed 50°C, according to IMD data. Punjab had the highest share of households with an AC or cooler, at 70% in NFHS-5. The short peak packs cleaning and gas refill calls into April and May, which stretches technician capacity across Delhi-NCR.
West India relies on humid metro demand
West India held 25.0% of 2025 value and grows at 9.90% a year, led by Mumbai, Pune and Ahmedabad. Coastal humidity keeps units running beyond the summer, which supports contract visits and filter cleaning through the monsoon. IMD's April 2026 outlook included isolated parts of Gujarat and Maharashtra among areas facing above-normal heatwave days. ICRA named western regions, with the south, as the main source of the FY26 sales recovery, which adds installation jobs in the zone.
East India grows on first-time ownership
East India held 7.0% of 2025 value and grows at 10.60% a year, faster than the national pace. Odisha, West Bengal, Jharkhand and Bihar were among the states with 20 to 38 heatwave days in summer 2024, according to IMD. IMD again flagged coastal Odisha and West Bengal for above-normal heatwave days in April 2026. Ownership is still low, so each new unit adds a first installation and a first service visit in cities such as Kolkata and Bhubaneswar.
Central India depends on local technicians
Central India held 5.0% of 2025 value and grows at 10.50% a year from a small base. Madhya Pradesh was among the states with 20 to 38 heatwave days in summer 2024, according to IMD data reported by National Herald. Most work in Indore, Bhopal and Raipur goes to local technicians, which matches the national pattern in which local providers lead planned servicing, according to LocalCircles. Urban Company lists AC repair in Indore, which brings app booking to the zone.
Northeast India grows fastest from a small base
Northeast India held 1.0% of 2025 value and grows at 11.20% a year, the fastest pace in the model. The base is very small, because many homes in the hills still manage without cooling. IMD's April 2026 outlook said northeastern regions may see hotter-than-normal days and longer heatwaves, which pushes first purchases in Guwahati and nearby towns. June 2024 also brought a 33% rainfall deficit to the Northeast, according to IMD, which added to hot spells.
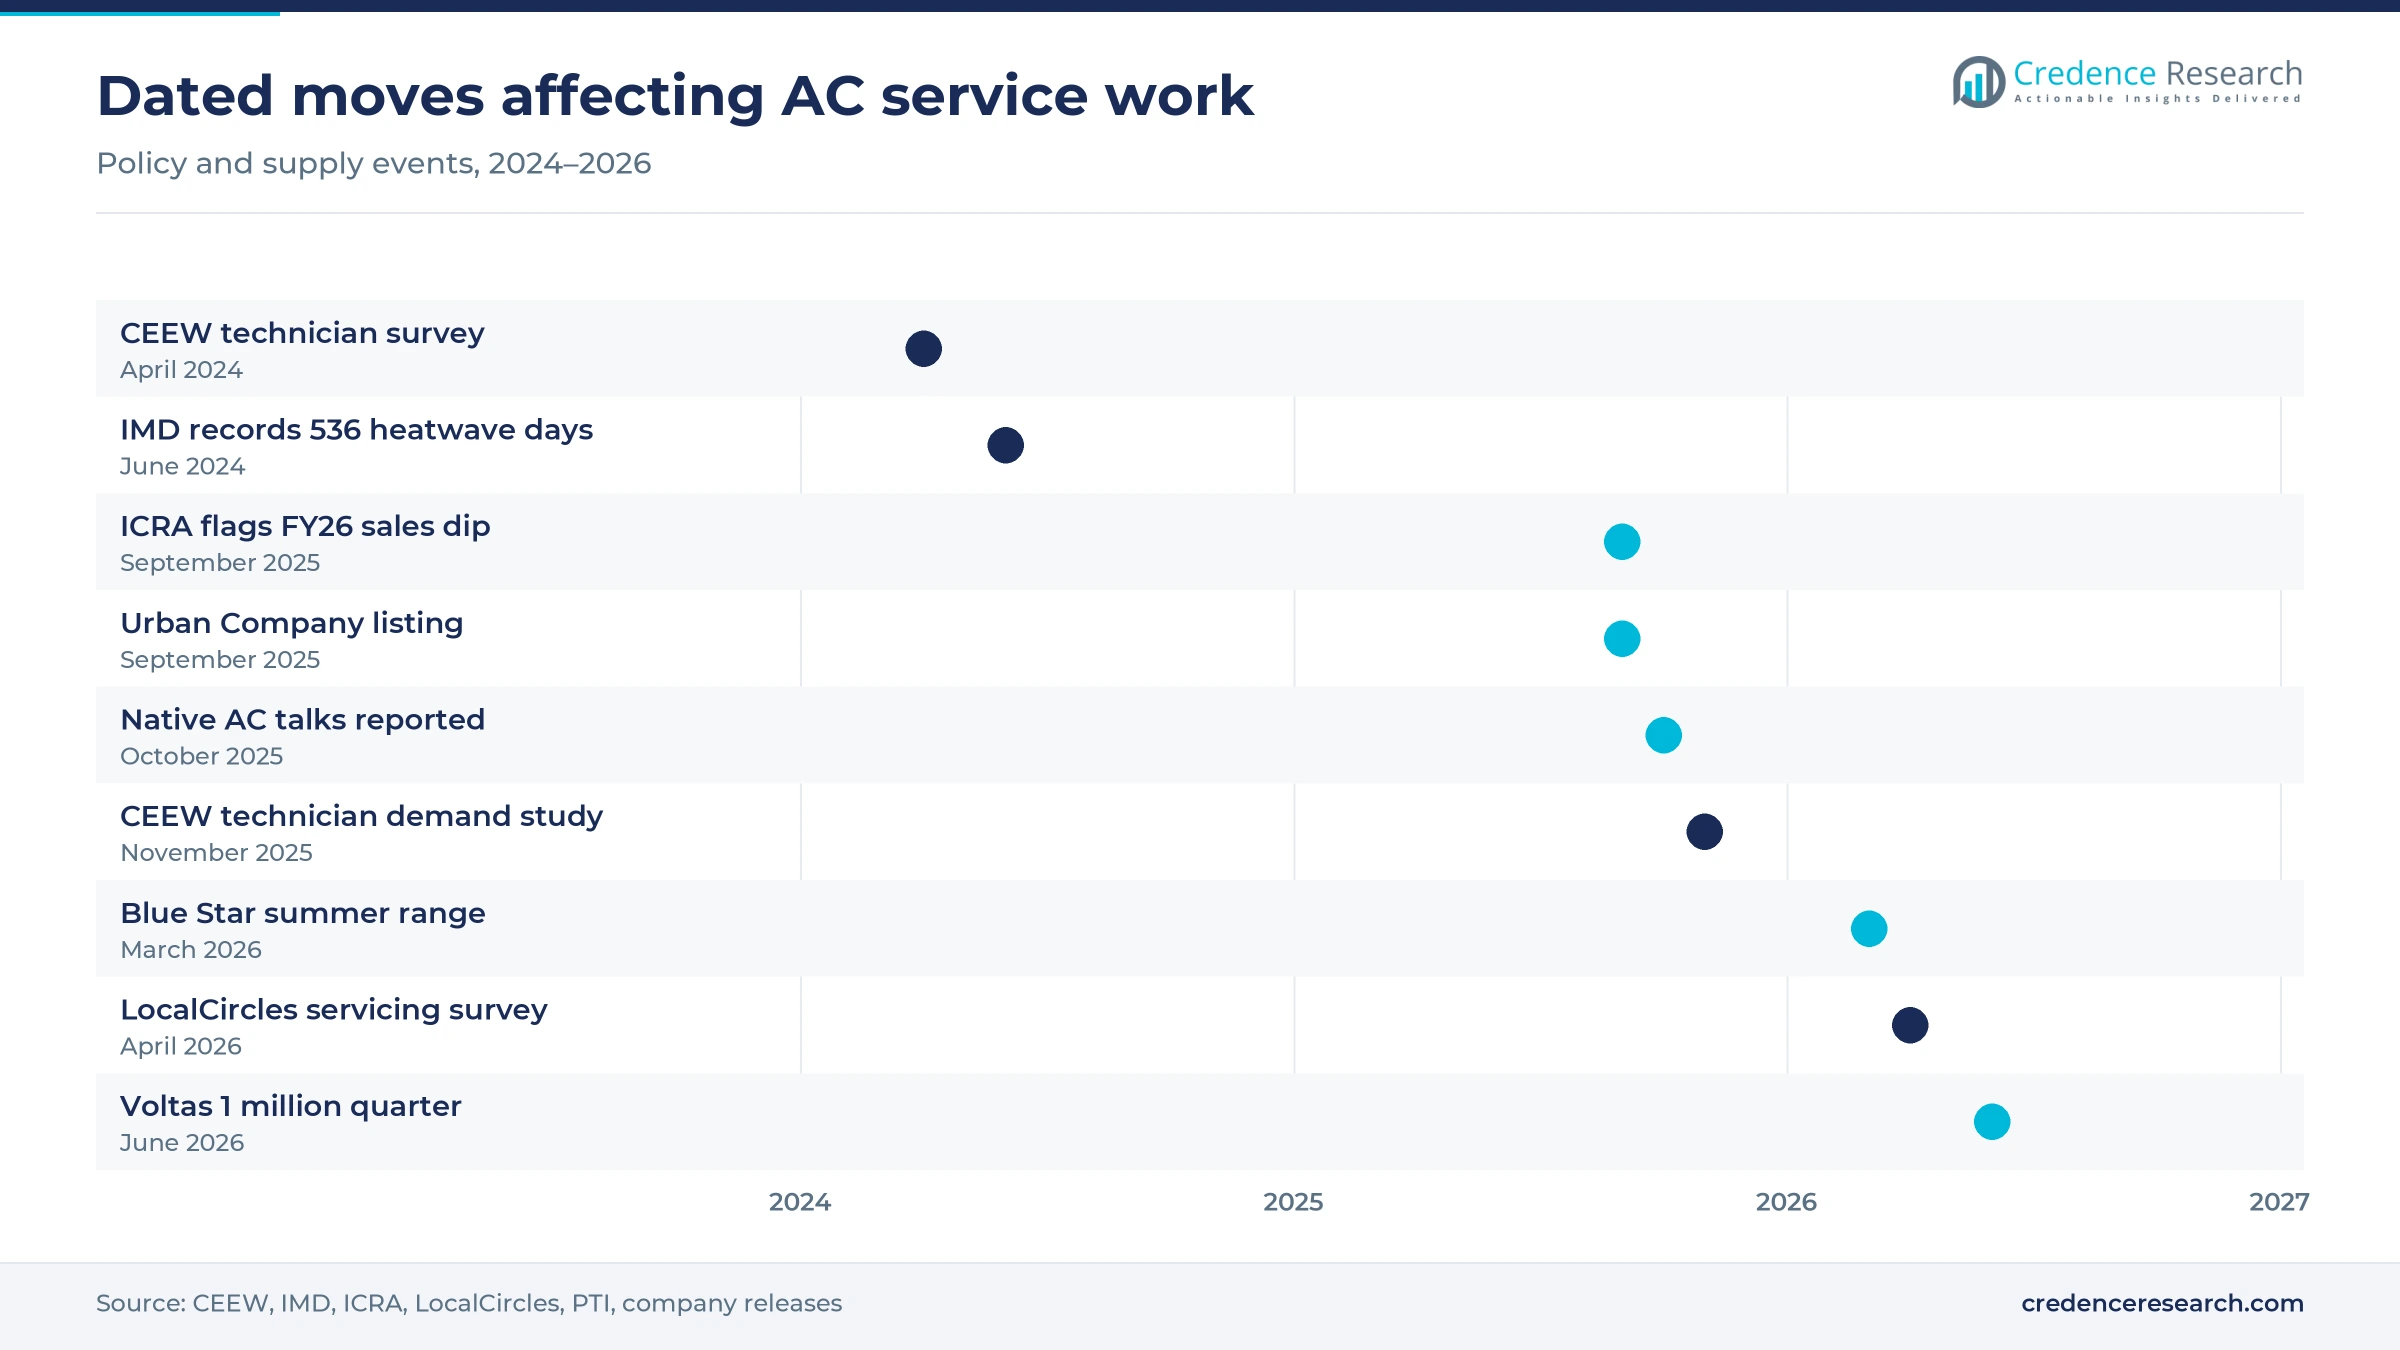
Platform, brand and survey moves from 2024 to 2026
| Development | Status and market relevance |
|---|---|
| In April 2024, CEEW published a survey of AC maintenance technicians that found 40% had received no formal training. | Published, informs skilling programs |
| In September 2025, Urban Company listed on the NSE and BSE after its IPO was subscribed 103.63 times, YourStory reported. | Listed, funds platform expansion |
| In October 2025, Urban Company was reported to be in early talks to assemble room ACs under its Native brand. | Under discussion, links hardware with service |
| In March 2026, Blue Star launched 125 room AC models for summer, backed by more than 2,100 service partners. | Launched, widens the installation base |
| In April 2026, LocalCircles released its Air Conditioner Servicing Survey 2026 covering over 27,000 households in 289 districts. | Published, shows the channel split |
Cleaning, diagnostics and gas tools set job quality
- Foam and power-jet cleaning washes coils and filters in one visit, and Urban Company lists it from Rs 449, which makes it the standard pre-summer job.
- App-based diagnostics guide technicians through standard fault checks, as with the device co-pilot that Urban Company introduced in 2025.
- Refrigerant recovery and leak testing become necessary as HCFCs are phased out by 2030 and newer gases need careful charging.
- Smart thermostats and controls link with connected HVAC controls that can flag faults early and support scheduled contract visits.
Need a Custom Version of This Report?
Tailor the scope, geography, or segments to your exact requirements.
- Custom geography or segment scope
- Direct access to our analyst team
Brands and platforms compete with lakhs of local hands
The India AC servicing market is fragmented, with lakhs of local technicians competing against brand networks and app platforms. Urban Company competes on fixed menu prices, background-checked partners and app booking across 51 cities, and it is exploring hardware under its Native brand. Voltas, Blue Star, LG Electronics India and Daikin India run authorized networks that handle in-warranty repairs and sell maintenance contracts, with Blue Star citing more than 2,100 service partners in March 2026. LG sells its Best Care plans at a discount within 30 days of purchase, while Daikin India accepts service requests on WhatsApp. Local technicians win on price and speed in tier 2 and smaller cities, where LocalCircles found most respondents. Competition increasingly turns on trained crews, because owners cite slow service and weak skills as reasons to switch providers. Small offices in larger buildings often fold unit care into facility management contracts, which narrows the open market for them.
Companies profiled and their roles in this market
| Company | Type | Role in the market |
|---|---|---|
| Urban Company | Service aggregator | Books AC cleaning, repair, gas refill and installation through its app in 51 cities |
| Voltas | Brand service network | Services its room ACs after selling 1 million units in the April to June 2026 quarter |
| Blue Star | Brand service network | Works with more than 2,100 service partners across the country |
| LG Electronics India | Brand service network | Sells Best Care maintenance plans with Gold and Platinum tiers |
| Daikin India | Brand service network | Takes service requests through WhatsApp and national helplines |
Skilled crews will decide who wins repeat jobs
Credence Research's view is that the India AC servicing market will reward providers that can field trained crews in the April to July peak. Demand is secure because the installed fleet keeps growing, and IMD expects hotter summers to keep units running longer. Price, however, still pushes most owners toward local technicians, and brand contracts lost ground between 2023 and 2026. Platforms with menu pricing and diagnostics apps are best placed to bridge that gap. The refrigerant transition to 2030 will also favor providers with recovery tools and certified staff, which should slowly formalize gas refill and repair work.
How the installed-base service model was built
The report uses 2025 as the base year and forecasts to 2035. Market values come from the Credence Research model, checked against the installed room AC stock multiplied by visit frequency and published job prices. Segment and regional splits are Credence Research estimates informed by unit ownership data, heat exposure, platform coverage and a published owner survey. Sources used include government and meteorological data, think-tank studies, policy summaries, credit-rating commentary, trade press and company announcements. No interviews or surveys were conducted in preparing this report.
A larger fleet keeps service jobs rising to 2035
India AC servicing revenue is forecast to reach USD 1.70 billion by 2035, with a larger fleet and hotter summers doing most of the work. South India should remain the largest region, while Northeast India and East India grow faster as first-time ownership spreads. Installation is expected to grow at 10.89% a year, while routine service remains the largest job type. Aggregators should keep gaining share from local technicians as app booking reaches smaller cities. Skills remain the binding constraint, so providers that train for new refrigerants and offer fair contract prices are likely to capture most repeat work.
Frequently Asked Questions
How big is the India AC servicing market?
Which region leads the market?
Which service type is largest?
How do most owners get their units serviced?
How much does a basic AC service cost?
Why do aggregators grow fastest?
How many technicians does India need?
What is the biggest risk for the market?
Table of Content
Chapter 1 Market Segmentation
- 1.1 Segmentation Framework
- 1.1.1 Product and Service Classification
- 1.1.2 Application and End-Use Classification
- 1.1.3 Technology and Solution Classification
- 1.1.4 Customer and Distribution Channel Classification
- 1.1.5 Geographic Segmentation
- 1.1.6 Market Segment Definitions and Boundaries
- 1.2 By Service
- 1.2.1 Routine Service
- 1.2.2 Repair
- 1.2.3 Gas Refill
- 1.2.4 Installation
- 1.3 By Customer
- 1.3.1 Households
- 1.3.2 Small Offices
- 1.4 By Channel
- 1.4.1 Local Technicians
- 1.4.2 Brand Service
- 1.4.3 Aggregators
Chapter 2 Introduction
- 2.1 Report Objectives and Scope
- 2.2 Product Definition and Industry Terminology
- 2.3 Market Inclusions and Exclusions
- 2.4 Research Process
- 2.4.1 Primary Research and Expert Interviews
- 2.4.2 Secondary Research and Source Review
- 2.4.3 Top-Down and Bottom-Up Estimation
- 2.4.4 Data Triangulation and Verification
- 2.5 Market Size Measurement Basis
- 2.5.1 2025: USD 654.6 million → 2035: USD 1.70 billion
- 2.6 Historical and Forecast Reference Periods
- 2.6.1 Historical Period: 2018-2025
- 2.6.2 Base Year: 2025
- 2.6.3 Forecast Period: 2025-2035
- 2.7 Research Assumptions and Limitations
Chapter 3 Executive Summary
- 3.1 Market Snapshot and Key Findings
- 3.2 Base-Year Market Size, 2025
- 3.3 Forecast Market Size, 2035
- 3.4 Revenue and Volume Growth Outlook
- 3.5 Key Demand and Supply Indicators
- 3.6 Leading Market Segments
- 3.7 Fastest-Growing Market Opportunities
- 3.8 Regional Performance Highlights
- 3.9 Technology and Industry Transformation
- 3.10 Competitive Landscape Summary
- 3.11 Analyst View and Strategic Implications
Chapter 4 India AC Servicing Market Trends and Developments
- 4.1 Historical Industry Development, 2018-2025
- 4.2 Recent Market Trends and Developments
- 4.3 Demand and Customer Behavior Trends
- 4.4 Technology and Product Innovation
- 4.5 Artificial Intelligence, Automation and Digitalization
- 4.6 Local Manufacturing and Supply Chain Realignment
- 4.7 Industry Partnerships, Mergers and Acquisitions
- 4.8 Sustainability and Circular Economy Developments
- 4.9 Government and Private Sector Investment Trends
- 4.10 Emerging Business Models and Commercialization
- 4.11 Industry Developments and Announcements
Chapter 5 India AC Servicing Market Production, Supply and Demand Analysis
- 5.1 Demand Trend and Consumption Analysis, 2018-2025
- 5.2 Demand Forecast, 2025-2035
- 5.3 Production and Output Trend, 2018-2025
- 5.4 Production and Output Forecast, 2025-2035
- 5.5 Installed Capacity and Capacity Utilization
- 5.6 Company-Wise Production Plants and Statistics
- 5.6.1 Installed Production Capacity
- 5.6.2 Actual Production
- 5.6.3 Planned Capacity and Expansion Targets
- 5.7 Supply Chain Structure and Procurement Trends
- 5.8 Supply-Demand Gap and Bottlenecks
- 5.9 Import Dependence and Sourcing Structure
- 5.10 Contract Manufacturing and Outsourcing
- 5.11 Regional Supply and Demand Concentration
Chapter 6 India AC Servicing Market Pricing Analysis
- 6.1 Pricing Structure and Measurement
- 6.2 Historical Pricing Trends, 2018-2025
- 6.3 Pricing Outlook, 2025-2035
- 6.4 Average Selling Price and Unit Economics
- 6.5 Pricing by Product and Market Segment
- 6.6 Geographic Pricing Differences
- 6.7 Key Input, Energy, Labor and Logistics Costs
- 6.8 Contract Pricing and Purchasing Models
- 6.9 Pricing Sensitivity and Competitive Positioning
- 6.10 Price, Margin and Profitability Implications
Chapter 7 India AC Servicing Market Dynamics
- 7.1 Market Growth Drivers
- 7.1.1 Demand-Side Drivers
- 7.1.2 Technology and Innovation Drivers
- 7.1.3 Infrastructure and Investment Drivers
- 7.1.4 Regulatory and Policy Drivers
- 7.2 Market Restraints
- 7.2.1 Cost and Affordability Constraints
- 7.2.2 Technology and Adoption Barriers
- 7.2.3 Supply Chain and Operational Constraints
- 7.3 Market Challenges
- 7.3.1 Competitive Pressure and Margin Erosion
- 7.3.2 Skills, Infrastructure and Implementation Gaps
- 7.4 Emerging Market Opportunities
- 7.5 Market Dynamics Impact and Time-Horizon Assessment
Chapter 8 India AC Servicing Value Chain Analysis
- 8.1 Industry Value Chain Overview
- 8.2 Upstream Suppliers and Critical Inputs
- 8.3 Technology and Component Providers
- 8.4 Manufacturing or Service Delivery
- 8.5 Distribution, Channel Partners and Integrators
- 8.6 Downstream Applications and End Users
- 8.7 Value Addition and Profit Pools
- 8.8 Vertical Integration and Outsourcing
- 8.9 Supplier Concentration and Risk
- 8.10 Supply Chain Localization and Resilience
Chapter 9 India AC Servicing Market Regulations and Policies
- 9.1 Relevant Laws, Standards and Compliance Frameworks
- 9.2 Product, Service, Safety and Quality Requirements
- 9.3 Government Policies, Incentives and Subsidies
- 9.4 Imports, Exports and Trade Barriers
- 9.5 Public Procurement and Local Content Requirements
- 9.6 Environmental and Sustainability Compliance
- 9.7 Upcoming Policy Changes and Market Implications
Chapter 10 India AC Servicing Market Hotspots and Opportunities
- 10.1 Market Opportunity Mapping and Growth Hotspots
- 10.2 High-Growth Applications and Customer Groups
- 10.3 Underserved Markets and White-Space Opportunities
- 10.4 Emerging Technology and Product Opportunities
- 10.5 New Capacity and Investment Hotspots
- 10.6 Market Entry and Expansion Opportunities
- 10.7 Distribution and Partnership Opportunities
- 10.8 Near-Term and Long-Term Commercial Potential
- 10.9 Opportunity Attractiveness and Execution Risks
Chapter 11 India AC Servicing Market Outlook, 2025-2035
- 11.1 Market Size and Analysis
- 11.1.1 Revenue (Market Measurement: 2025: USD 654.6 million → 2035: USD 1.70 billion)
- 11.1.2 Market Volume and Quantity Sold
- 11.1.3 Historical Market Size, 2018-2025
- 11.1.4 Base-Year Market Size, 2025
- 11.2 Market Forecast, 2025-2035
- 11.2.1 Revenue Forecast to 2035
- 11.2.2 Volume Forecast to 2035
- 11.2.3 CAGR and Year-on-Year Growth
- 11.2.4 Incremental Revenue Opportunity
- 11.3 Forecast Assumptions and Scenario Analysis
- 11.3.1 Base-Case Forecast
- 11.3.2 Optimistic and Conservative Scenarios
- 11.3.3 Technology, Pricing and Policy Sensitivities
- 11.4 Market Attractiveness and Growth Outlook
Chapter 12 India AC Servicing Market Segmentation and Outlook
- 12.1 Segmentation Summary and Market Shares, 2025
- 12.2 Largest and Fastest-Growing Segments
- 12.3 By Service - Market Size and Forecast, 2025-2035
- 12.3.1 Segment Definition and Scope
- 12.3.2 Historical Market Size, 2018-2025
- 12.3.3 Revenue Forecast, 2025-2035
- 12.3.4 Volume Forecast, 2025-2035
- 12.3.5 Base-Year Market Share, 2025
- 12.3.6 Segment CAGR and Growth Drivers
- 12.3.7 Subsegment Market Size and Forecast
- 12.3.7.1 Routine Service
- 12.3.7.2 Repair
- 12.3.7.3 Gas Refill
- 12.3.7.4 Installation
- 12.3.8 Subsegment Pricing and Adoption Trends
- 12.3.9 Leading Suppliers and Competition
- 12.3.10 Regional Demand and Opportunities
- 12.4 By Customer - Market Size and Forecast, 2025-2035
- 12.4.1 Segment Definition and Scope
- 12.4.2 Historical Market Size, 2018-2025
- 12.4.3 Revenue Forecast, 2025-2035
- 12.4.4 Volume Forecast, 2025-2035
- 12.4.5 Base-Year Market Share, 2025
- 12.4.6 Segment CAGR and Growth Drivers
- 12.4.7 Subsegment Market Size and Forecast
- 12.4.7.1 Households
- 12.4.7.2 Small Offices
- 12.4.8 Subsegment Pricing and Adoption Trends
- 12.4.9 Leading Suppliers and Competition
- 12.4.10 Regional Demand and Opportunities
- 12.5 By Channel - Market Size and Forecast, 2025-2035
- 12.5.1 Segment Definition and Scope
- 12.5.2 Historical Market Size, 2018-2025
- 12.5.3 Revenue Forecast, 2025-2035
- 12.5.4 Volume Forecast, 2025-2035
- 12.5.5 Base-Year Market Share, 2025
- 12.5.6 Segment CAGR and Growth Drivers
- 12.5.7 Subsegment Market Size and Forecast
- 12.5.7.1 Local Technicians
- 12.5.7.2 Brand Service
- 12.5.7.3 Aggregators
- 12.5.8 Subsegment Pricing and Adoption Trends
- 12.5.9 Leading Suppliers and Competition
- 12.5.10 Regional Demand and Opportunities
- 12.6 Segment Growth Comparison
- 12.7 Segment Attractiveness and Priority Matrix
Chapter 13 India AC Servicing End-Use and Application Market Outlook
- 13.1 End-Use Industry and Customer Demand Structure
- 13.2 Leading Applications and Customer Groups
- 13.3 End-Use Market Size, Share and Forecast
- 13.4 Major End-Use Industry Deep Dives
- 13.4.1 Customer Requirements and Use Cases
- 13.4.2 Demand and Replacement Cycles
- 13.4.3 Technical and Regulatory Considerations
- 13.4.4 Purchasing and Procurement Models
- 13.4.5 Leading Vendors and Distribution Channels
- 13.4.6 Forecast and Commercial Opportunities
- 13.5 Emerging Applications and Cross-Segment Demand
- 13.6 End-Use Industry Investment Priorities
Chapter 14 India AC Servicing Geographic Market Outlook, 2025-2035
- 14.1 Domestic Market Distribution and Demand Clusters
- 14.2 State- or Province-Wise Market Size and Forecast, 2025-2035
- 14.3 City and Metropolitan Market Outlook
- 14.4 Industrial, Manufacturing and Commercial Clusters
- 14.5 Geographic Concentration of Key End Users
- 14.6 Local Pricing and Purchasing Differences
- 14.7 Domestic Production Facilities and Capacity Map
- 14.8 Local Infrastructure and Project Pipeline
- 14.9 State-Level Policy and Incentive Differences
- 14.10 Subnational Investment Hotspots and Opportunities
- 14.11 Distribution and Logistics Networks
- 14.12 Domestic Competitive Footprint
Chapter 15 India AC Servicing Technology, Innovation and Sustainability Outlook
- 15.1 Technology Landscape and Maturity
- 15.2 Product, Process and Service Innovation
- 15.3 AI, Automation and Digital Tools in the Industry
- 15.4 Technology Adoption and Performance Benchmarking
- 15.5 Innovation Pipeline and R&D Investment
- 15.6 Patent and Intellectual Property Trends
- 15.7 Energy Efficiency and Resource Management
- 15.8 Sustainability, Recycling and Circularity
- 15.9 Technology Roadmap, 2025-2035
- 15.10 Risks of Obsolescence and Technology Substitution
Chapter 16 India AC Servicing Market Key Strategic Imperatives
- 16.1 Growth and Market Entry Priorities
- 16.2 High-Return Products and Segments
- 16.3 Pricing, Profitability and Cost Optimization
- 16.4 Technology Investment and Product Differentiation
- 16.5 Supply Chain Localization and Resilience
- 16.6 Distribution and Customer Acquisition
- 16.7 Partnership, Acquisition and Capacity Strategy
- 16.8 Regional Expansion Priorities
- 16.9 Short-, Medium- and Long-Term Actions
Chapter 17 Competition Outlook
- 17.1 Industry Competition Characteristics
- 17.2 Market Structure and Concentration
- 17.3 Market Share and Competitive Positioning, 2025
- 17.4 Company-Wise Revenue and Product Benchmarking
- 17.5 Production and Service Capacity Benchmarking
- 17.6 Technology, Pricing and Differentiation
- 17.7 Regional Footprint and Distribution Strength
- 17.8 Mergers, Acquisitions and Strategic Alliances
- 17.9 New Entrants and Competitive Threats
- 17.10 Porter's Five Forces and Industry Attractiveness
- 17.11 Competitive Outlook, 2025-2035
Chapter 18 Company Profiles
- 18.1 Company Coverage and Selection Criteria
- 18.2 Urban Company
- 18.2.1 Business Description
- 18.2.2 Company Ownership and Geographic Presence
- 18.2.3 Product and Service Portfolio
- 18.2.4 Manufacturing and Operating Footprint
- 18.2.5 Production Capacity and Expansion Plans
- 18.2.6 Financial Performance and Investment
- 18.2.7 Market Share and Competitive Position
- 18.2.8 Technology and Innovation Capabilities
- 18.2.9 Strategic Alliances or Partnerships
- 18.2.10 Recent Developments
- 18.2.11 Growth Strategy and Outlook
- 18.3 Voltas
- 18.4 Daikin India
- 18.5 Blue Star
- 18.6 LG Electronics India
- 18.7 Other Relevant Market Participants
Note: Every listed company is profiled on the structure shown under the first company. The company list is preliminary and may change based on research findings, market developments, data availability and client requirements.
Chapter 19 Disclaimer
- 19.1 Research and Forecast Disclaimer
- 19.2 Data Source and Estimation Limitations
Note: The depth of individual sections depends on data availability for this market. Volume, capacity, trade and other unit-based metrics are included where applicable.