Recycled and PFAS-free kit reshapes outdoor buying
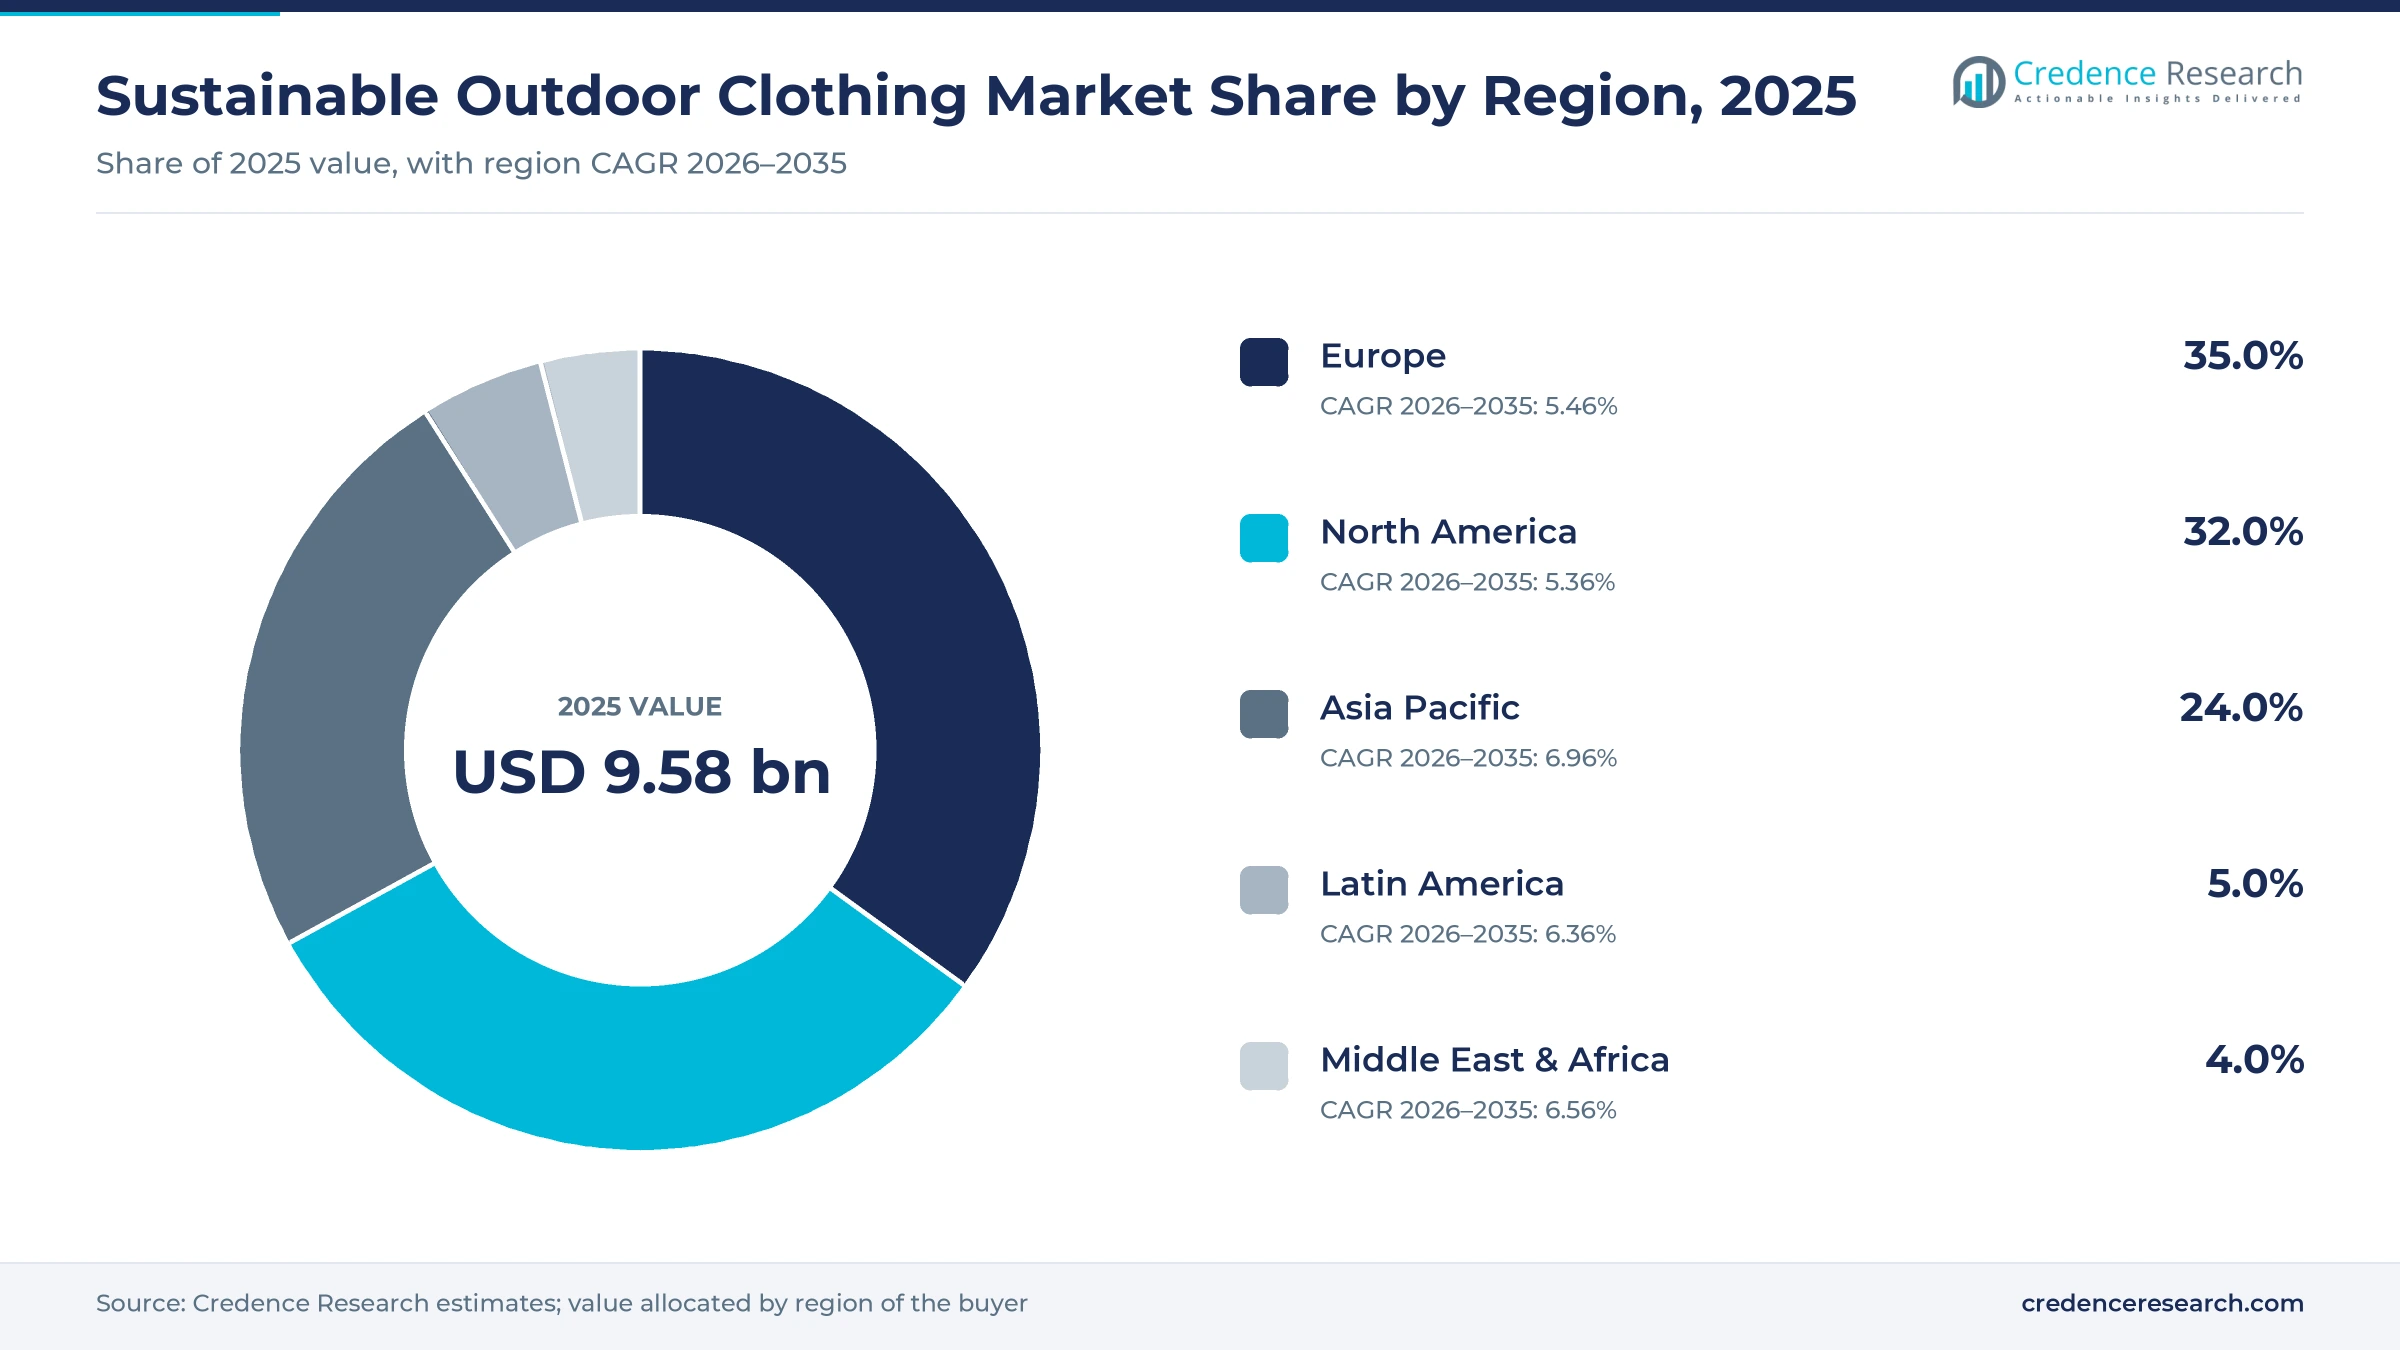
The global sustainable outdoor clothing market was valued at USD 9.58 billion in 2025 and is projected to increase from USD 10.14 billion in 2026 to USD 16.98 billion by 2035, registering a CAGR of 5.89% during 2026–2035. Demand comes from hikers, climbers, skiers and campers who replace shells, fleece and base layers with recycled, organic or bio-based versions, and from retailers that must meet new chemical rules. Europe held the largest regional share, 35.0% in 2025, because the EU restricts PFHxA in consumer clothing from Oct. 10, 2026 and has adopted producer responsibility for textile waste. Asia Pacific is the fastest-growing region at 7.0% a year, as Chinese outdoor participation has passed 400 million people. North America follows Europe closely, supported by record American participation in 2025. The main commercial change is the move to repair, trade-in and resale, which turns a single jacket sale into a longer relationship between brand and buyer.
What counts as sustainable outdoor clothing in this report?
The report counts jackets, hoodies, shirts, trousers, shorts, leggings and tights sold for hiking, climbing, skiing, camping and travel when most of the fabric by weight is recycled, organic, bio-based or third-party certified, or when the garment carries a PFAS-free performance finish. Sales are counted across specialty stores, sporting goods chains, marketplaces and brand-owned channels.
Footwear, packs, tents, sleeping bags and other hardgoods are excluded, as are conventional outdoor garments that carry no verified material content. The value chain runs from fiber recyclers and mills through finishing houses and garment factories to brands and retailers, and repaired or resold items enter the count when a brand sells them.
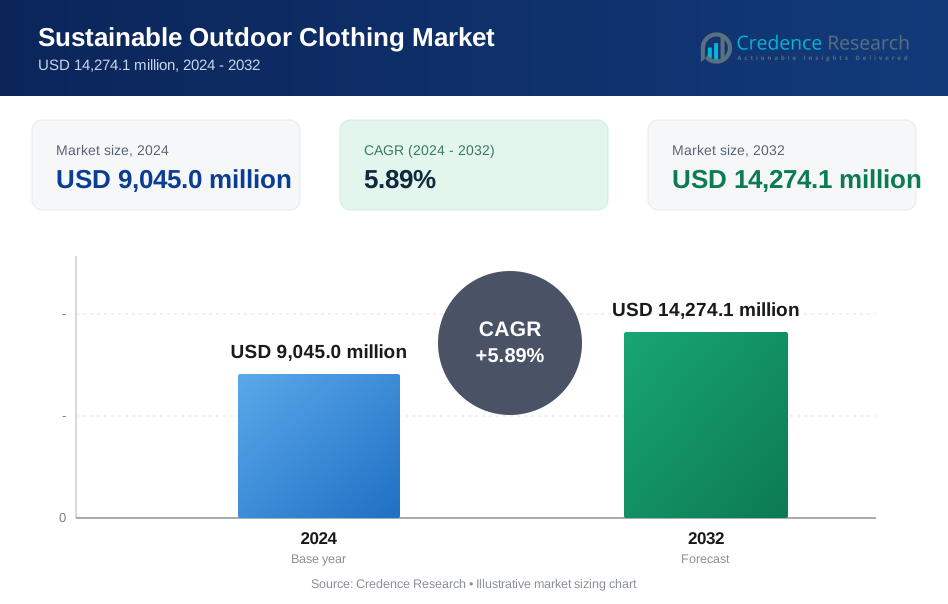
Sustainable Outdoor Clothing Market Insights
- The market reached USD 9.58 billion in 2025 and is projected to rise to USD 16.98 billion by 2035, growing at a 5.89% CAGR during 2026–2035 as recycled and PFAS-free garments replace conventional kit.
- Europe held 35.0% of global value in 2025, ahead of North America at 32.0%, because EU chemical and waste rules apply earliest there.
- Jackets and hoodies led product demand with 38.0% of 2025 value, while recycled polyester led materials with 40.0% of 2025 value.
- The EU PFHxA restriction applies to consumer clothing from Oct. 10, 2026, which makes fluorine-free water repellency a market-entry condition for shells.
- Repair, trade-in and resale programs at Patagonia and Arc'teryx are turning used garments into a second revenue stream and a reason to buy direct.
Jackets and recycled polyester carry the most value
Why do jackets and hoodies dominate sustainable outdoor product sales?
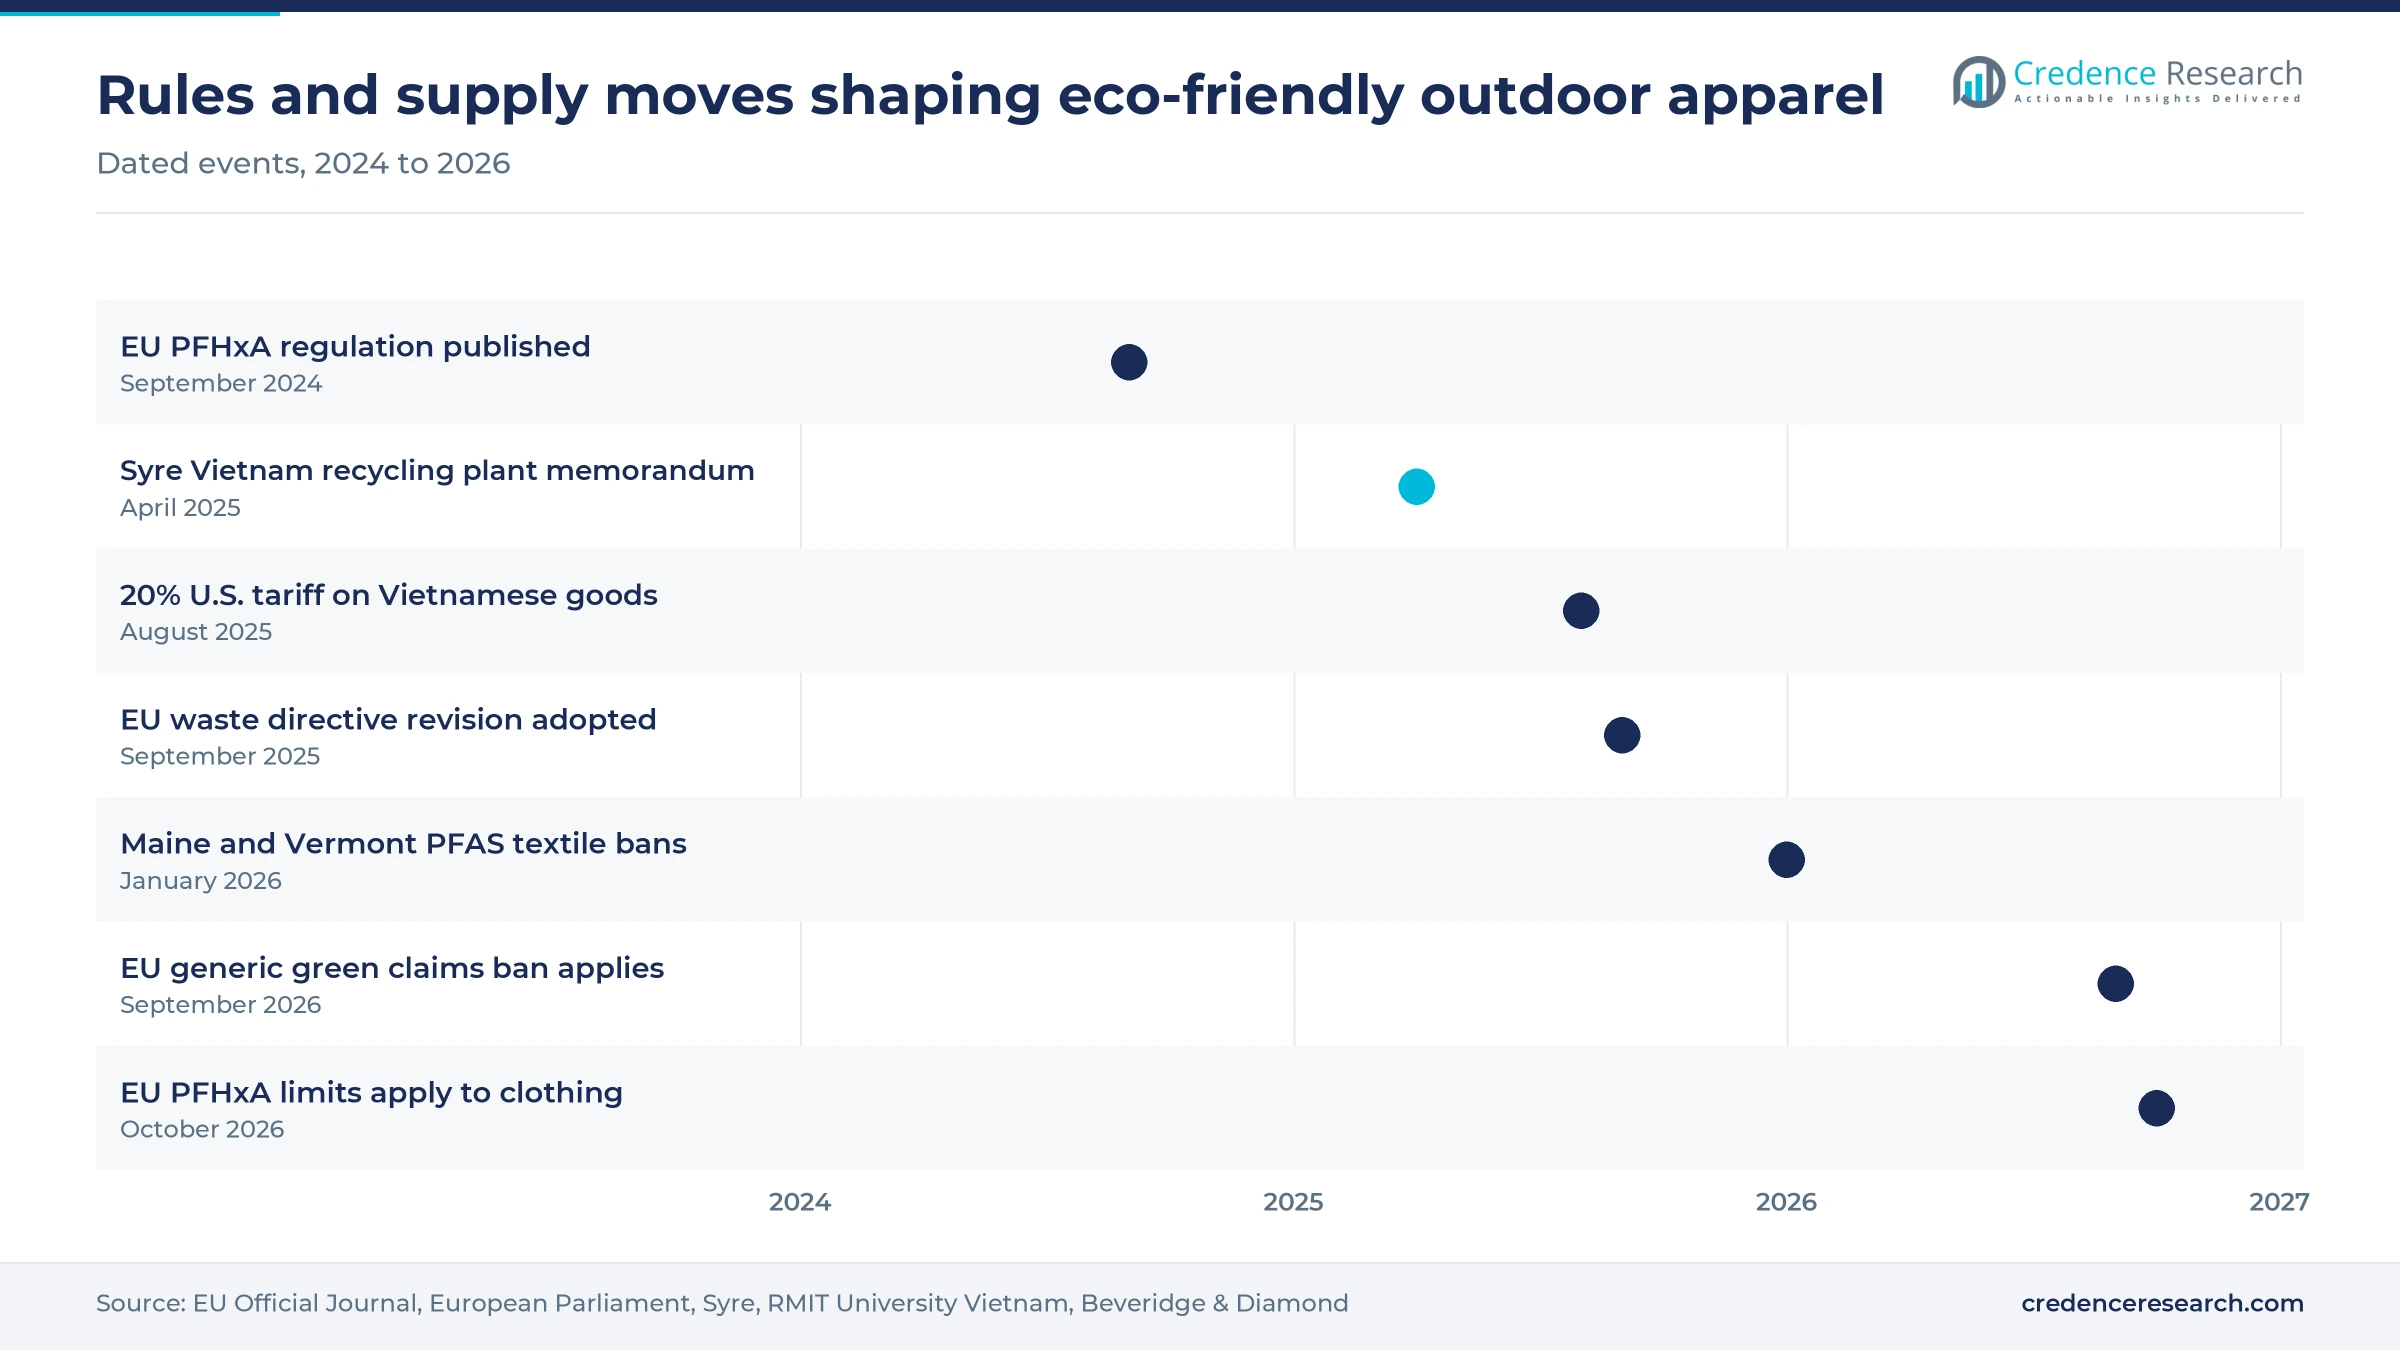
Based on product, the market is categorized into jackets and hoodies, shirts and T-shirts, trousers, shorts and leggings and tights. Jackets and Hoodies led with 38.0% of 2025 value because shells carry the highest price and face the strictest chemical rules. Blister Review reported that Patagonia moved all 61 of its waterproof shell styles to recycled materials sewn in Fair Trade Certified factories, which set a benchmark rivals now match. Shirts and T-Shirts grow fastest at 6.7% a year, as organic and blended fibers spread into base layers. Organic cotton reached about 706,000 metric tons in 2023/24, or 2.9% of world cotton, according to the Organic Trade Association citing Textile Exchange.
Which materials do brands use most in eco-friendly outdoor garments?
Based on material, the market is categorized into recycled polyester, natural and organic fibers, recycled nylon, other recycled materials and bio-based materials. Recycled Polyester led with 40.0% of 2025 value because it is the cheapest proven route to lower-impact fleece and shells. Textile Exchange counted about 9.3 million metric tons of recycled polyester in 2024, or roughly 12% of all polyester. Bio-based Materials grow fastest at 7.4% a year from a small base, as fermentation fibers reach retail. Spiber reported on Dec. 24, 2025 that The North Face Japan Collection released Nuptse Hanten jackets made with its Brewed Protein fiber, a material Goldwin also uses.
How do buyers purchase recycled and certified outdoor clothing?
Based on distribution channel, the market is categorized into offline retail, online retail and direct-to-consumer. Offline Retail led with 46.0% of 2025 value because buyers still want to try fit and layering in person. The U.S. Census Bureau put e-commerce at 17.1% of retail sales in the second quarter of 2026, so most spending still passes through stores. Direct-to-Consumer grows fastest at 6.5% a year, as brands sell repairs and resale directly. Arc'teryx said its ReBird program kept 47,152 items out of landfill in 2025 and opened permanent resale stores in Toronto and New York.
| Segment Group | Leading Sub-segment | Share, 2025 | Fastest-growing Sub-segment | CAGR, 2026–2035 |
|---|---|---|---|---|
| By Product | Jackets and Hoodies | 38.0% | Shirts and T-Shirts | 6.7% |
| By Material | Recycled Polyester | 40.0% | Bio-based Materials | 7.4% |
| By Distribution Channel | Offline Retail | 46.0% | Direct-to-Consumer | 6.5% |
Request a Free Sample
Fill in your details and we'll send you a free sample report.
- Sample data tables & charts
- Research methodology
Record participation and PFAS rules pull demand forward
Record outdoor participation widens the buyer base
Participation sets the floor for demand because every new hiker or camper needs a shell, fleece and base layer. The Outdoor Industry Association reported in June 2026 that 183.2 million Americans took part in outdoor recreation in 2025, a record 59% of people aged six and older. This activity has economic weight as well, since the Bureau of Economic Analysis valued the outdoor recreation economy at USD 696.7 billion in 2024, or 2.4% of U.S. GDP. In China, the General Administration of Sport said outdoor sports participants exceeded 400 million by April 2025. As a result, the buyer base is broadening across age groups, and core users who also purchase camping gear tend to replace apparel each season.
PFAS restrictions force fluorine-free water repellency
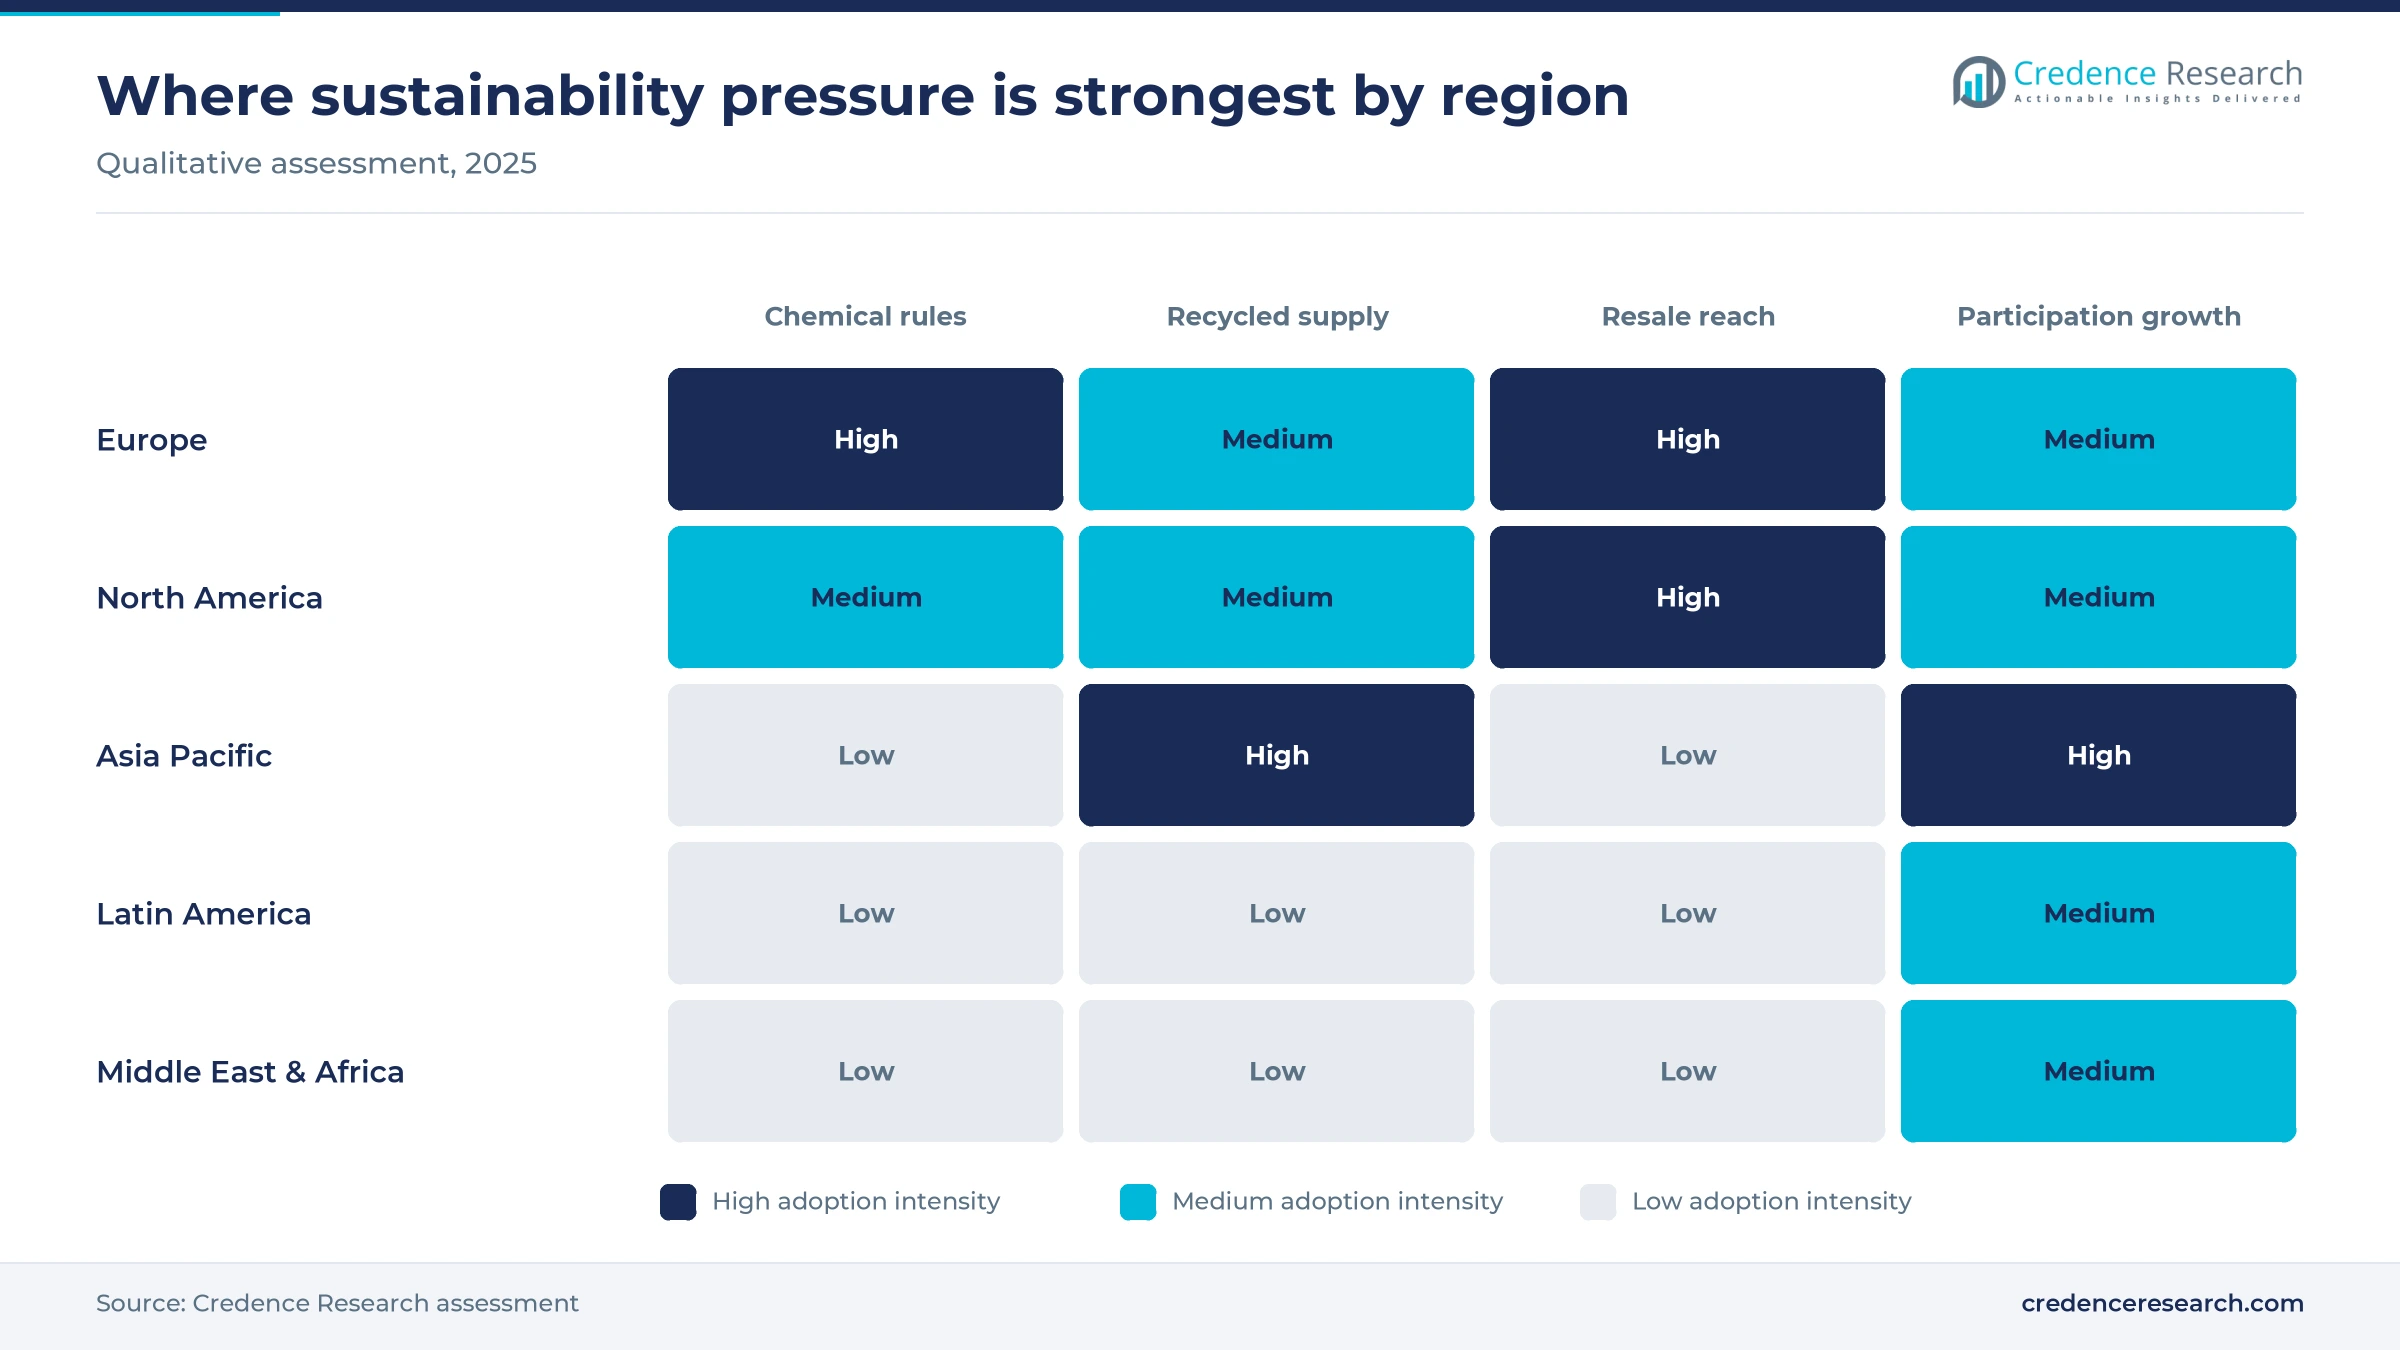
Chemical rules are pushing brands to replace fluorinated water repellents, which lifts the share of compliant shells in every collection. Commission Regulation (EU) 2024/2462 was published on Sept. 20, 2024, and its limits of 25 ppb for PFHxA apply to consumer clothing from Oct. 10, 2026, according to law firm Beveridge & Diamond. Maine and Vermont began banning textiles with intentionally added PFAS on Jan. 1, 2026, and California lowers its total organic fluorine threshold to 50 ppm on Jan. 1, 2027. Colorado adds outdoor apparel for severe wet conditions in 2028. Because suppliers such as Polartec already moved their full fabric line to non-PFAS DWR in July 2021, compliant fabric is available, and the change shifts spending toward newer jackets.
EU waste rules make producers pay for textile disposal
Producer responsibility for textile waste raises the cost of selling short-lived garments in Europe, which favors durable and recycled products. SGS reported that the European Parliament adopted the revised Waste Framework Directive on Sept. 9, 2025, giving member states 30 months to set up extended producer responsibility schemes. The same summary put EU clothing and footwear waste at about 5.2 million metric tons a year, or roughly 12 kg per person. Fees are expected to vary with durability and recyclability, so brands that design for repair and feed textile recycling streams should pay less. In turn, Europe holds the largest regional share in this report, because these fees apply there first.
Brand material commitments set a measurable standard
Leading outdoor brands now publish material and labor data, which gives buyers a way to compare claims and raises the bar for rivals. SGB Media reported in November 2025 that 84% of Patagonia fabrics and trims by purchased weight were preferred materials in fiscal 2025, and over 95% of its products came from Fair Trade Certified factories. Tentree said its sales had funded 100 million trees, using REPREVE recycled polyester, TENCEL lyocell, organic cotton and hemp in its fabrics. Arc'teryx tied its ReBird circularity program to a target of cutting emissions intensity by 65% by 2030, according to Outside Business Journal. These disclosures help explain why Recycled Polyester holds 40.0% of 2025 value.
Repair, resale and new fibers redefine product life
Repair and resale shift brands toward longer product life
Brands are shifting from one-time sales to repair, trade-in and resale, which keeps garments in use and returns customers to the brand. Patagonia repaired about 174,799 products in fiscal 2025, according to RetailBoss coverage of its impact report. Arc'teryx now pays trade-in credit worth 30% of the original retail price and accepts gear in stores across the U.S. and Canada. Its ReBird program also opened two permanent resale locations, in Toronto and New York, during 2025. This pattern matters for channel strategy, because Direct-to-Consumer grows at 6.5% a year. Retailers of premium technical apparel now treat this model as the benchmark for used-gear sales.
Bio-based and regenerated fibers emerge in technical layers
New fibers are emerging alongside recycled polyester, because brands need lower-impact options for insulation, shells and knitwear. Goldwin and Spiber built a full Regenerative Circle collection, from ski-inspired coats to tech pants, entirely from Brewed Protein, according to Apparel Resources. In December 2025, The North Face Japan Collection added Nuptse Hanten jackets using the same fiber. Aquafil, maker of ECONYL regenerated nylon, described a demonstration plant that chemically separates elastic fibers from nylon, a barrier to recycling stretch fabric. Prada said its Re-Nylon line has used ECONYL since 2019, and organic cotton output rose to about 706,000 metric tons in 2023/24 from 574,000 a season earlier. As a result, Bio-based Materials grow at 7.4% a year, the fastest material pace in this report.
Textile-to-textile recycling opens a new fiber supply
Recycling old garments into new polyester is an opening because most recycled fiber still comes from bottles rather than clothing. Textile Exchange put recycled material at about 7.6% of 2024 global fiber production, most of it bottle-based polyester. Syre, the H&M Group-backed recycler, signed a memorandum with Vietnam in April 2025 for a Binh Dinh plant producing up to 250,000 metric tons a year of PET chips from textile waste, according to the company. Costs are also moving in favor of recycled inputs, since S&P Global Commodity Insights reported that clear R-PET flake traded USD 459 per metric ton below virgin PET in Northwest Europe on May 13, 2026. Brands that secure contracts for recycled PET now could lock in cheaper supply.
Asia Pacific participation offers the largest growth opening
Asia Pacific is the largest growth opening because participation is rising from a large population base while sustainable ranges are still thin. China Daily reported that a General Administration of Sport report expected the Chinese outdoor sports sector to exceed 3 trillion yuan in 2025. Columbia Sportswear drew more than 3,000 participants to its Hike Party in Chongli, Hebei, in September 2025, an event it now runs every year. Japan adds a premium layer, as Goldwin operates The North Face there and sells Brewed Protein garments. Vietnam also supplies the region, with the Vietnam Textile and Apparel Association projecting USD 46 billion in 2025 textile and garment exports. Consequently, Asia Pacific is the fastest-growing region in this report over the forecast period.
Stalled recycled supply and claim rules raise costs
Recycled content gains have stalled across the industry
Recycled supply is not keeping pace with brand targets, which limits how quickly sustainable ranges can expand. Textile Exchange found that recycled polyester slipped to about 12% of polyester output in 2024 from 12.5% in 2023, even as total fiber hit 132 million metric tons. Patagonia sourced only 6% of its synthetic fabrics from secondary waste in fiscal 2025, against a 50% goal. Smaller brands with less buying power face the tightest supply, so many are turning to blended and natural fibers instead.
EU green claims rules raise the evidence burden
Marketing rules now penalize vague sustainability language, which raises the cost of selling in Europe. Directive (EU) 2024/825 applies from Sept. 27, 2026 and bans generic claims such as eco-friendly or green unless brands can prove recognized excellent performance, according to law firm Latham & Watkins. Self-declared sustainability labels that are not based on certification are also banned. Brands must therefore relabel stock, pay for certification and rewrite product pages, while those with audited data gain a clear advantage.
U.S. tariffs on Asian garment hubs squeeze margins
Trade costs are rising for brands that sew recycled garments in Asia, which narrows margins on premium sustainable lines. RMIT University Vietnam reported that a 20% U.S. tariff on most Vietnamese fashion and textile goods took effect on Aug. 7, 2025, with up to 40% for transshipped goods. Vietnamese textile exports to the U.S. fell 20% from August to September 2025. Brands are responding with price rises, factory shifts and smaller drops, which can slow the replacement of conventional kit.
Fragmented PFAS testing rules add compliance cost
Different PFAS thresholds across jurisdictions force brands to test the same jacket against several standards, which adds cost per style. Beveridge & Diamond reported in October 2026 that Washington presumes intentional PFAS above 50 ppm total fluorine from Jan. 1, 2027, while Connecticut requires labeling from July 1, 2026 and a full ban in 2028. Smaller labels without in-house labs carry the heaviest burden, so many consolidate suppliers and use pre-certified fabrics to cut test volumes.
Europe leads on rules while Asia Pacific grows fastest
| Region | Value, 2025 (USD billion) | Share, 2025 | CAGR, 2026–2035 |
|---|---|---|---|
| Europe | 3.35 | 35.0% | 5.5% |
| North America | 3.06 | 32.0% | 5.4% |
| Asia Pacific | 2.30 | 24.0% | 7.0% |
| Latin America | 0.48 | 5.0% | 6.4% |
| Middle East & Africa | 0.38 | 4.0% | 6.6% |
Europe leads because EU chemical and waste rules apply first
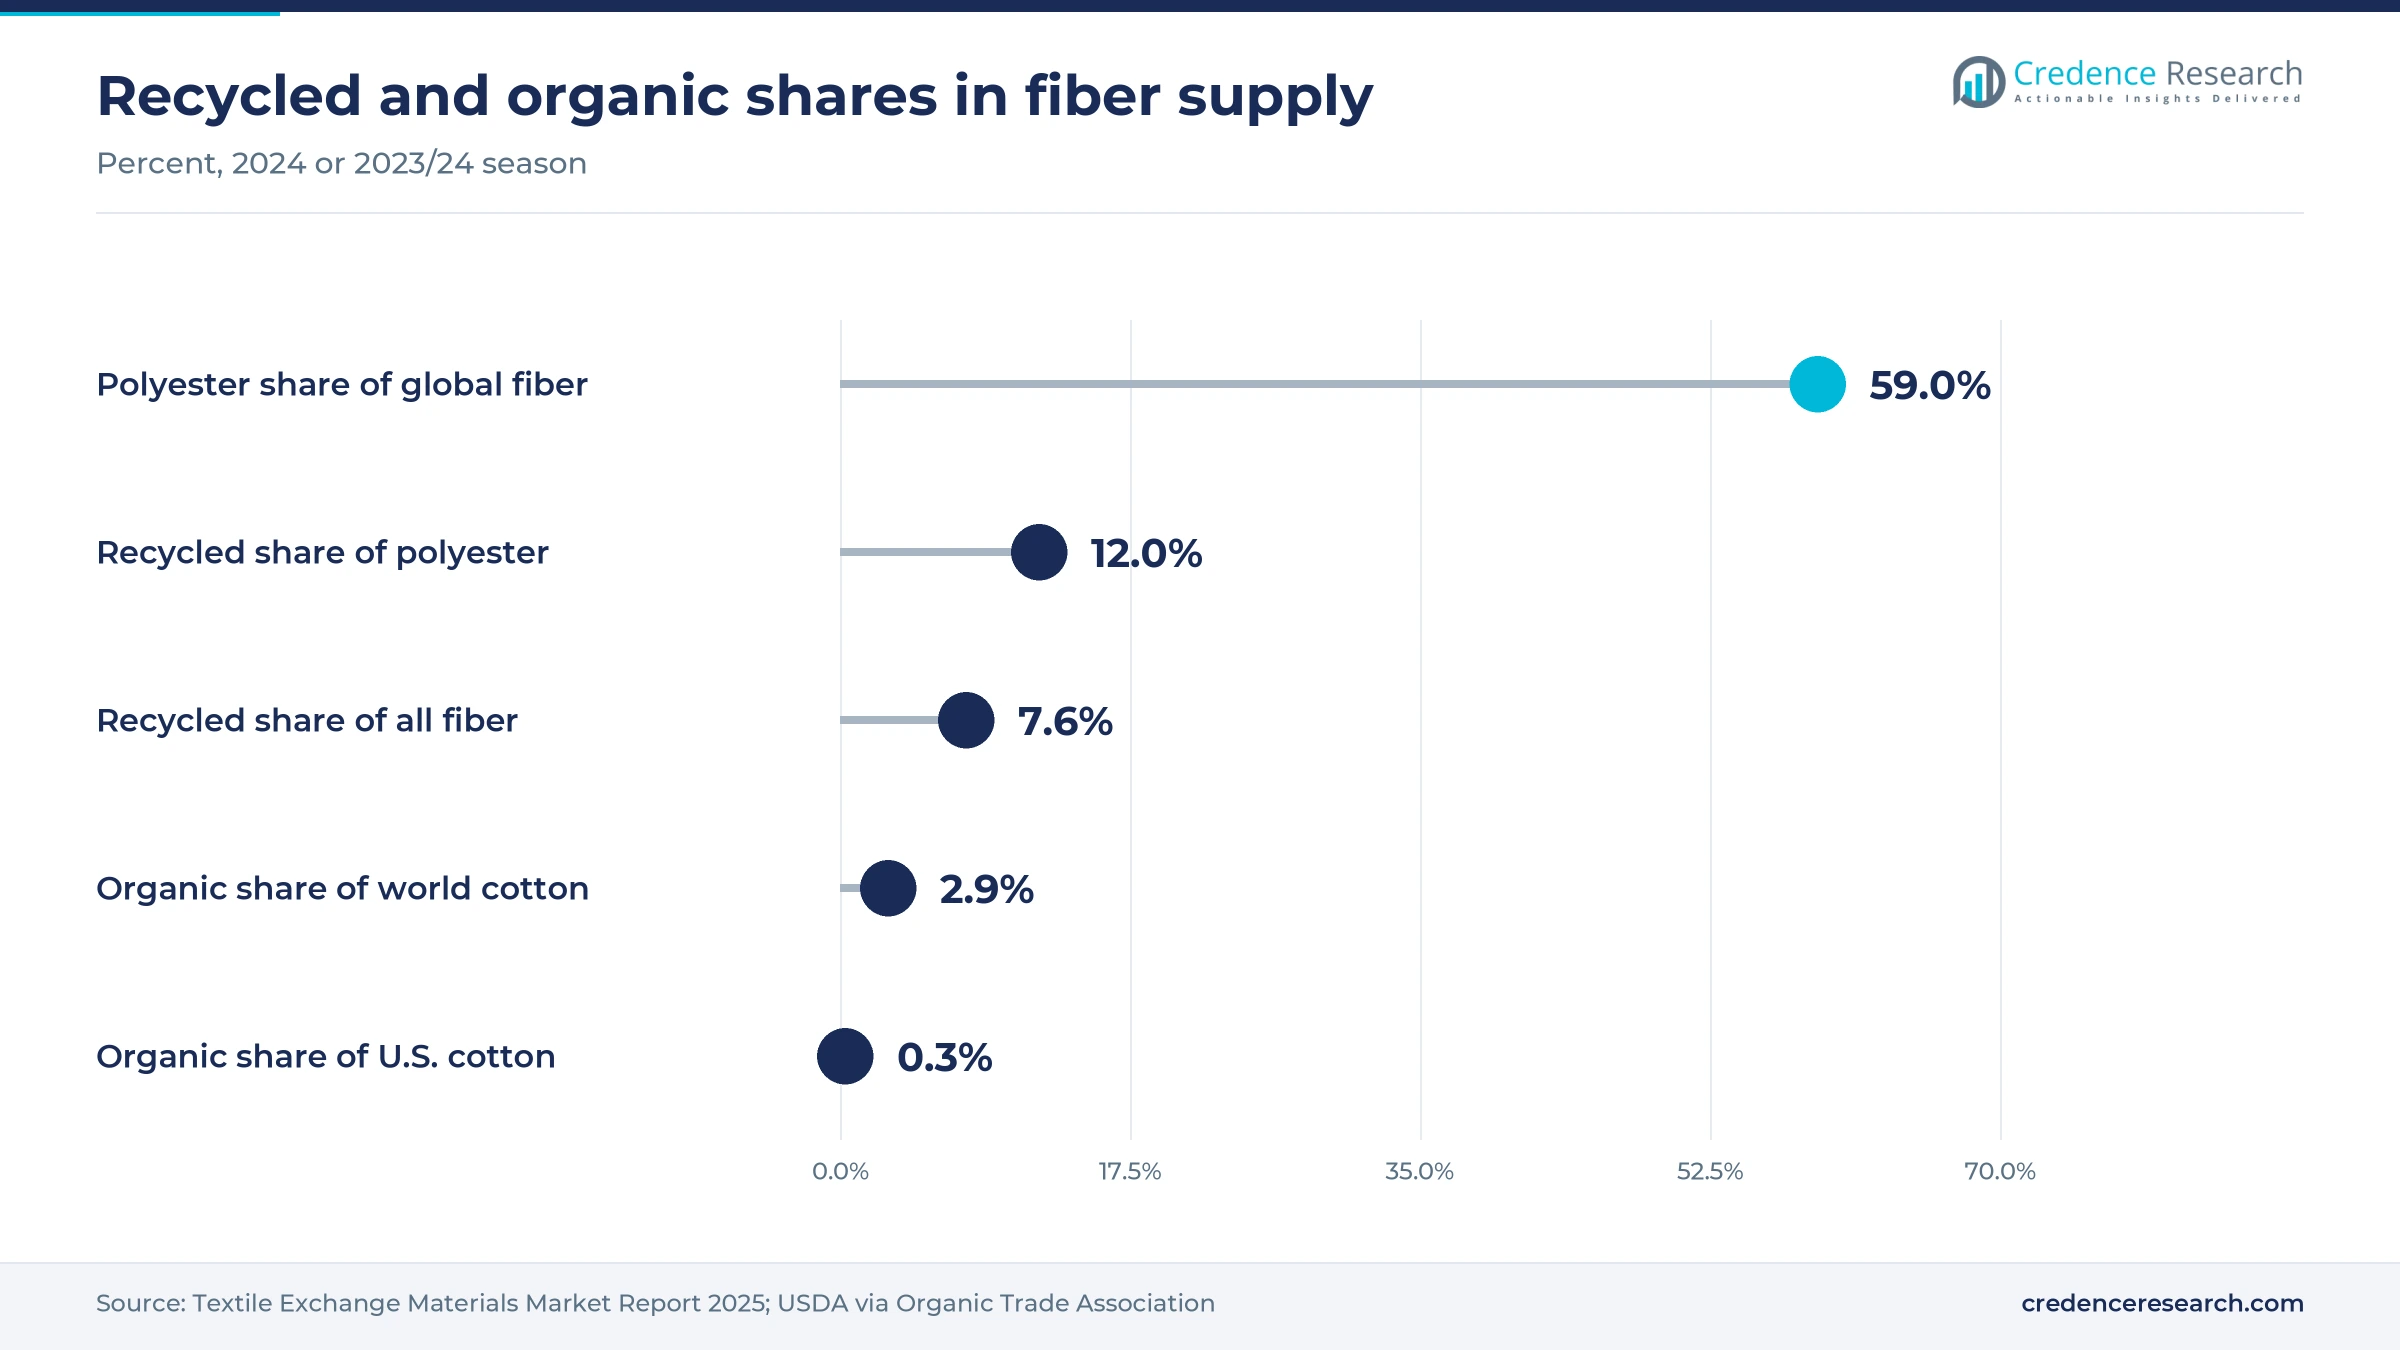
Europe held 35.0% of 2025 value and grows at 5.5% a year, the largest regional share in this report. The region is first to enforce PFHxA limits on consumer clothing and is building producer responsibility schemes for textiles after the Sept. 9, 2025 Parliament vote. Generic environmental claims also become illegal from Sept. 27, 2026, which favors brands with certified data. As a result, brands selling in Germany, France and the Nordic countries need fluorine-free shells and documented material data on their shelves this year.
North America grows on record participation and resale stores
North America held 32.0% of 2025 value and grows at 5.4% a year. Demand rests on a record outdoor base, and the outdoor recreation economy equaled 2.4% of U.S. GDP in 2024 on Bureau of Economic Analysis data. State PFAS laws in Maine, Vermont, California, Washington and Colorado create a patchwork that rewards early compliance. Arc'teryx opened permanent resale stores in Toronto and New York in 2025, showing how brands now use used gear to win buyers.
Asia Pacific grows fastest as Chinese participation surges
Asia Pacific held 24.0% of 2025 value and grows at 7.0% a year, the fastest pace among the five regions. More than 400 million people in China take part in outdoor sports, according to the General Administration of Sport. Japan supplies some of the most advanced materials, including Brewed Protein garments sold by Goldwin. Vietnam and the wider region also host the cut-and-sew base and new recycling plants such as Syre's planned Binh Dinh facility.
Latin America builds demand around nature tourism
Latin America held 5.0% of 2025 value and grows at 6.4% a year. Brazil's protected areas recorded a record 25.5 million visits in 2024, according to Agência Gov in May 2025, which widens the base of hikers who need weatherproof layers. Mexico is also adding recycled-content legislation that supports R-PET demand, according to S&P Global Commodity Insights. Credence Research estimates that imported premium brands account for most of this value, which keeps volumes concentrated in large cities.
Middle East & Africa grows from a small retail base
Middle East & Africa held 4.0% of 2025 value and grows at 6.6% a year from the smallest base. Retail access is improving because Azadea said Decathlon operated eight Middle East stores in September 2021, including a 4,000 square meter flagship at The Dubai Mall. Hot climates favor light shirts, sun layers and trousers over heavy shells. Demand is concentrated in the Gulf states and South Africa, where mountain, desert and travel buyers are most numerous.
Brands and recyclers scale circular supply in 2025
| Development | Status and market relevance |
|---|---|
| In April 2025, Syre signed a memorandum with Vietnam for a Binh Dinh plant able to make up to 250,000 metric tons a year of PET chips from textile waste. | Planned; adds garment-derived polyester supply in Asia |
| In September 2025, Columbia Sportswear hosted its second Hike Party in Chongli, Hebei, drawing more than 3,000 outdoor participants over two days. | Completed; builds brand reach in China |
| In November 2025, Patagonia reported that over 95% of its products were made in Fair Trade Certified factories and that it had eliminated intentionally applied PFAS. | Published; sets a disclosure benchmark |
| In December 2025, The North Face Japan Collection released Nuptse Hanten jackets made with Spiber Brewed Protein fiber. | Launched; brings bio-based insulation shells to retail |
| In June 2026, the Outdoor Industry Association reported 183.2 million U.S. outdoor participants for 2025, a record. | Published; confirms a widening buyer base |
Fluorine-free finishes and new fibers lead innovation
- Fluorine-free DWR finishes replace PFAS water repellents, and Polartec reported no loss of durability after moving its whole fabric line in 2021.
- Regenerated nylon such as ECONYL from Aquafil is made from fishing nets, carpet and industrial waste and is regenerated into new yarn for garments.
- Brewed Protein fiber from Spiber is produced by fermentation and now appears in Goldwin and The North Face Japan jackets.
- Chemical separation of elastic fibers lets recyclers recover nylon from stretch fabric, which Aquafil is testing at a demonstration plant.
- Textile-to-textile depolymerization breaks worn polyester back into PET chips, the route Syre plans to scale in Vietnam and North Carolina.
Need a Custom Version of This Report?
Tailor the scope, geography, or segments to your exact requirements.
- Custom geography or segment scope
- Direct access to our analyst team
Specialist brands compete on proof rather than slogans
Competition in this market increasingly centers on verifiable proof of impact. Patagonia, Arc'teryx and The North Face compete with published material shares, repair counts and certified supply chains, while Tentree differentiates through tree planting tied to each sale. Columbia Sportswear competes on reach and events in China, and Goldwin uses its Japanese license and Spiber partnership to sell fermentation-fiber garments at premium prices. Material suppliers shape the field as much as brands do. Polartec supplies non-PFAS fleece and shell fabrics to many labels, Aquafil sells ECONYL regenerated nylon, and recyclers such as Syre are building garment-to-garment polyester capacity. Mass retailers such as Decathlon widen access through store networks in the Middle East and elsewhere, while European specialists such as Fjällräven, VAUDE and Picture Organic Clothing compete on recycled, organic and bio-based materials. Because EU rules ban generic green claims from Sept. 27, 2026, the advantage is shifting toward companies with audited data and away from those relying on marketing language.
Companies profiled and their roles in this market
| Company | Type | Role in the market |
|---|---|---|
| Patagonia | Specialist brand | Reports 84% preferred materials and over 95% Fair Trade Certified production in fiscal 2025 |
| The North Face (VF Corporation) | Global brand | Outdoor jackets, fleece and trousers, with its Japan lines run by licensee Goldwin |
| Arc'teryx (Amer Sports) | Premium brand | Runs ReBird trade-in, repair and resale with stores in Toronto and New York |
| Columbia Sportswear | Global brand | Builds China reach through the annual Hike Party in Chongli |
| Decathlon | Sports retailer and brand owner | Sells own-brand hiking and ski clothing through its global store network |
| Fjällräven (Fenix Outdoor) | Specialist brand | Swedish outdoor clothing brand using recycled polyester, organic cotton and traceable wool |
| Goldwin | Brand and licensee | Sells Regenerative Circle garments made entirely of Brewed Protein |
| Tentree | Specialist brand | Funds tree planting per item and uses REPREVE, TENCEL, organic cotton and hemp |
| VAUDE | Specialist brand | German outdoor clothing maker that labels products under its Green Shape standard |
| Picture Organic Clothing | Specialist brand | French maker of ski and outdoor jackets from organic, recycled and bio-sourced materials |
Verified material claims will decide brand share
Credence Research's view is that verified material data, not general sustainability messaging, will decide which brands gain share to 2035. The EU green claims ban and PFHxA limits both take effect in autumn 2026, so brands without certified content or fluorine-free finishes risk losing shelf space in the largest regional market. At the same time, recycled polyester supply has stalled since slipping from 12.5% of polyester output in 2023, which means brands that sign early contracts with textile-to-textile recyclers will control the scarcest input. Repair and resale also deserve investment, because they deepen the direct customer relationship and lift margins on garments already sold once.
How Credence Research sized the market
The report uses 2025 as the base year and forecasts to 2035, with the growth rate stated for 2026–2035. Market values come from the Credence Research model, which converts the earlier published base with its own growth rate and checks the result against the size of the wider outdoor apparel category and the share of garments with verified recycled, organic, bio-based or certified content. Regional, product, material and channel splits are Credence Research estimates. Inputs include official statistics from the Bureau of Economic Analysis and the U.S. Census Bureau, EU legislation, industry association data, fiber production data from Textile Exchange and company disclosures.
Circular supply sets the pace to 2035
To 2035, growth will depend on how quickly garment-derived fiber replaces bottle-based polyester and how strictly regulators enforce chemical and claim rules. Europe should stay the largest region as producer responsibility fees start to vary with durability, while Asia Pacific gains share on participation and local manufacturing. Jackets will remain the core product, but shirts and base layers will spread the category to everyday outdoor buyers. Brands that combine certified materials, fluorine-free finishes and resale should capture most of the value growth, reaching USD 16.98 billion by 2035.
Frequently Asked Questions
How big is the sustainable outdoor clothing market?
What are the main outdoor apparel industry trends?
Which materials are used in high-end expedition clothing?
How does recycled content in outdoor jackets compare across leading brands?
How do fair trade practices influence outdoor brands?
Which region leads the sustainable outdoor clothing market?
How are global outdoor brands growing in Asia?
What challenges does the sustainable outdoor clothing market face?
Table of Content
Chapter 1 Market Segmentation
- 1.1 Segmentation Framework
- 1.1.1 Product and Service Classification
- 1.1.2 Application and End-Use Classification
- 1.1.3 Technology and Solution Classification
- 1.1.4 Customer and Distribution Channel Classification
- 1.1.5 Geographic Segmentation
- 1.1.6 Market Segment Definitions and Boundaries
- 1.2 By Product
- 1.2.1 Jackets and Hoodies
- 1.2.2 Shirts and T-Shirts
- 1.2.3 Trousers
- 1.2.4 Leggings and Tights
- 1.2.5 Shorts
- 1.3 By Material
- 1.3.1 Recycled Polyester
- 1.3.2 Natural and Organic Fibers
- 1.3.3 Recycled Nylon
- 1.3.4 Other Recycled Materials
- 1.3.5 Bio-based Materials
Chapter 2 Introduction
- 2.1 Report Objectives and Scope
- 2.2 Product Definition and Industry Terminology
- 2.3 Market Inclusions and Exclusions
- 2.4 Research Process
- 2.4.1 Primary Research and Expert Interviews
- 2.4.2 Secondary Research and Source Review
- 2.4.3 Top-Down and Bottom-Up Estimation
- 2.4.4 Data Triangulation and Verification
- 2.5 Market Size Measurement Basis
- 2.5.1 2025: USD 9.58 billion → 2035: USD 16.98 billion
- 2.6 Historical and Forecast Reference Periods
- 2.6.1 Historical Period: 2018-2025
- 2.6.2 Base Year: 2025
- 2.6.3 Forecast Period: 2025-2035
- 2.7 Research Assumptions and Limitations
Chapter 3 Executive Summary
- 3.1 Market Snapshot and Key Findings
- 3.2 Base-Year Market Size, 2025
- 3.3 Forecast Market Size, 2035
- 3.4 Revenue and Volume Growth Outlook
- 3.5 Key Demand and Supply Indicators
- 3.6 Leading Market Segments
- 3.7 Fastest-Growing Market Opportunities
- 3.8 Regional Performance Highlights
- 3.9 Technology and Industry Transformation
- 3.10 Competitive Landscape Summary
- 3.11 Analyst View and Strategic Implications
Chapter 4 Global Sustainable Outdoor Clothing Market Trends and Developments
- 4.1 Historical Industry Development, 2018-2025
- 4.2 Recent Market Trends and Developments
- 4.3 Demand and Customer Behavior Trends
- 4.4 Technology and Product Innovation
- 4.5 Artificial Intelligence, Automation and Digitalization
- 4.6 Local Manufacturing and Supply Chain Realignment
- 4.7 Industry Partnerships, Mergers and Acquisitions
- 4.8 Sustainability and Circular Economy Developments
- 4.9 Government and Private Sector Investment Trends
- 4.10 Emerging Business Models and Commercialization
- 4.11 Industry Developments and Announcements
Chapter 5 Global Sustainable Outdoor Clothing Market Production, Supply and Demand Analysis
- 5.1 Demand Trend and Consumption Analysis, 2018-2025
- 5.2 Demand Forecast, 2025-2035
- 5.3 Production and Output Trend, 2018-2025
- 5.4 Production and Output Forecast, 2025-2035
- 5.5 Installed Capacity and Capacity Utilization
- 5.6 Company-Wise Production Plants and Statistics
- 5.6.1 Installed Production Capacity
- 5.6.2 Actual Production
- 5.6.3 Planned Capacity and Expansion Targets
- 5.7 Supply Chain Structure and Procurement Trends
- 5.8 Supply-Demand Gap and Bottlenecks
- 5.9 Import Dependence and Sourcing Structure
- 5.10 Contract Manufacturing and Outsourcing
- 5.11 Regional Supply and Demand Concentration
Chapter 6 Global Sustainable Outdoor Clothing Market Pricing Analysis
- 6.1 Pricing Structure and Measurement
- 6.2 Historical Pricing Trends, 2018-2025
- 6.3 Pricing Outlook, 2025-2035
- 6.4 Average Selling Price and Unit Economics
- 6.5 Pricing by Product and Market Segment
- 6.6 Geographic Pricing Differences
- 6.7 Key Input, Energy, Labor and Logistics Costs
- 6.8 Contract Pricing and Purchasing Models
- 6.9 Pricing Sensitivity and Competitive Positioning
- 6.10 Price, Margin and Profitability Implications
Chapter 7 Global Sustainable Outdoor Clothing Market Dynamics
- 7.1 Market Growth Drivers
- 7.1.1 Demand-Side Drivers
- 7.1.2 Technology and Innovation Drivers
- 7.1.3 Infrastructure and Investment Drivers
- 7.1.4 Regulatory and Policy Drivers
- 7.2 Market Restraints
- 7.2.1 Cost and Affordability Constraints
- 7.2.2 Technology and Adoption Barriers
- 7.2.3 Supply Chain and Operational Constraints
- 7.3 Market Challenges
- 7.3.1 Competitive Pressure and Margin Erosion
- 7.3.2 Skills, Infrastructure and Implementation Gaps
- 7.4 Emerging Market Opportunities
- 7.5 Market Dynamics Impact and Time-Horizon Assessment
Chapter 8 Global Sustainable Outdoor Clothing Value Chain Analysis
- 8.1 Industry Value Chain Overview
- 8.2 Upstream Suppliers and Critical Inputs
- 8.3 Technology and Component Providers
- 8.4 Manufacturing or Service Delivery
- 8.5 Distribution, Channel Partners and Integrators
- 8.6 Downstream Applications and End Users
- 8.7 Value Addition and Profit Pools
- 8.8 Vertical Integration and Outsourcing
- 8.9 Supplier Concentration and Risk
- 8.10 Supply Chain Localization and Resilience
Chapter 9 Global Sustainable Outdoor Clothing Market Regulations and Policies
- 9.1 Relevant Laws, Standards and Compliance Frameworks
- 9.2 Product, Service, Safety and Quality Requirements
- 9.3 Government Policies, Incentives and Subsidies
- 9.4 Imports, Exports and Trade Barriers
- 9.5 Public Procurement and Local Content Requirements
- 9.6 Environmental and Sustainability Compliance
- 9.7 Upcoming Policy Changes and Market Implications
Chapter 10 Global Sustainable Outdoor Clothing Market Hotspots and Opportunities
- 10.1 Market Opportunity Mapping and Growth Hotspots
- 10.2 High-Growth Applications and Customer Groups
- 10.3 Underserved Markets and White-Space Opportunities
- 10.4 Emerging Technology and Product Opportunities
- 10.5 New Capacity and Investment Hotspots
- 10.6 Market Entry and Expansion Opportunities
- 10.7 Distribution and Partnership Opportunities
- 10.8 Near-Term and Long-Term Commercial Potential
- 10.9 Opportunity Attractiveness and Execution Risks
Chapter 11 Global Sustainable Outdoor Clothing Market Outlook, 2025-2035
- 11.1 Market Size and Analysis
- 11.1.1 Revenue (Market Measurement: 2025: USD 9.58 billion → 2035: USD 16.98 billion)
- 11.1.2 Market Volume and Quantity Sold
- 11.1.3 Historical Market Size, 2018-2025
- 11.1.4 Base-Year Market Size, 2025
- 11.2 Market Forecast, 2025-2035
- 11.2.1 Revenue Forecast to 2035
- 11.2.2 Volume Forecast to 2035
- 11.2.3 CAGR and Year-on-Year Growth
- 11.2.4 Incremental Revenue Opportunity
- 11.3 Forecast Assumptions and Scenario Analysis
- 11.3.1 Base-Case Forecast
- 11.3.2 Optimistic and Conservative Scenarios
- 11.3.3 Technology, Pricing and Policy Sensitivities
- 11.4 Market Attractiveness and Growth Outlook
Chapter 12 Global Sustainable Outdoor Clothing Market Segmentation and Outlook
- 12.1 Segmentation Summary and Market Shares, 2025
- 12.2 Largest and Fastest-Growing Segments
- 12.3 By Product - Market Size and Forecast, 2025-2035
- 12.3.1 Segment Definition and Scope
- 12.3.2 Historical Market Size, 2018-2025
- 12.3.3 Revenue Forecast, 2025-2035
- 12.3.4 Volume Forecast, 2025-2035
- 12.3.5 Base-Year Market Share, 2025
- 12.3.6 Segment CAGR and Growth Drivers
- 12.3.7 Subsegment Market Size and Forecast
- 12.3.7.1 Jackets and Hoodies
- 12.3.7.2 Shirts and T-Shirts
- 12.3.7.3 Trousers
- 12.3.7.4 Leggings and Tights
- 12.3.7.5 Shorts
- 12.3.8 Subsegment Pricing and Adoption Trends
- 12.3.9 Leading Suppliers and Competition
- 12.3.10 Regional Demand and Opportunities
- 12.4 By Material - Market Size and Forecast, 2025-2035
- 12.4.1 Segment Definition and Scope
- 12.4.2 Historical Market Size, 2018-2025
- 12.4.3 Revenue Forecast, 2025-2035
- 12.4.4 Volume Forecast, 2025-2035
- 12.4.5 Base-Year Market Share, 2025
- 12.4.6 Segment CAGR and Growth Drivers
- 12.4.7 Subsegment Market Size and Forecast
- 12.4.7.1 Recycled Polyester
- 12.4.7.2 Natural and Organic Fibers
- 12.4.7.3 Recycled Nylon
- 12.4.7.4 Other Recycled Materials
- 12.4.7.5 Bio-based Materials
- 12.4.8 Subsegment Pricing and Adoption Trends
- 12.4.9 Leading Suppliers and Competition
- 12.4.10 Regional Demand and Opportunities
- 12.5 Segment Growth Comparison
- 12.6 Segment Attractiveness and Priority Matrix
Chapter 13 Global Sustainable Outdoor Clothing Geographic Market Outlook, 2025-2035
- 13.1 Regional Market Size and Share, 2025
- 13.2 Regional Market Forecast, 2025-2035
- 13.3 Regional Pricing, Production and Demand Differences
- 13.4 North America
- 13.4.1 United States
- 13.4.2 Canada
- 13.4.3 Mexico
- 13.5 Europe
- 13.5.1 Germany
- 13.5.2 France
- 13.5.3 Italy
- 13.5.4 United Kingdom
- 13.5.5 Spain
- 13.5.6 Poland
- 13.5.7 Russia
- 13.5.8 Netherlands
- 13.5.9 Belgium
- 13.5.10 Sweden
- 13.5.11 Denmark
- 13.5.12 Norway
- 13.5.13 Rest of Europe
- 13.6 Asia Pacific
- 13.6.1 China
- 13.6.2 India
- 13.6.3 Japan
- 13.6.4 South Korea
- 13.6.5 Thailand
- 13.6.6 Indonesia
- 13.6.7 Vietnam
- 13.6.8 Malaysia
- 13.6.9 Australia
- 13.6.10 Rest of Asia Pacific
- 13.7 Latin America
- 13.7.1 Brazil
- 13.7.2 Argentina
- 13.7.3 Colombia
- 13.7.4 Chile
- 13.7.5 Rest of Latin America
- 13.8 Middle East
- 13.8.1 Saudi Arabia
- 13.8.2 United Arab Emirates
- 13.8.3 Turkey
- 13.8.4 Israel
- 13.8.5 Iran
- 13.8.6 Rest of the Middle East
- 13.9 Africa
- 13.9.1 South Africa
- 13.9.2 Egypt
- 13.9.3 Nigeria
- 13.9.4 Morocco
- 13.9.5 Rest of Africa
- 13.10 Regional Investment, Policy and Supply Chain Differences
- 13.11 Regional Competitive Landscape
- 13.12 Geographic Growth Hotspots
Chapter 14 Global Sustainable Outdoor Clothing Technology, Innovation and Sustainability Outlook
- 14.1 Technology Landscape and Maturity
- 14.2 Product, Process and Service Innovation
- 14.3 AI, Automation and Digital Tools in the Industry
- 14.4 Technology Adoption and Performance Benchmarking
- 14.5 Innovation Pipeline and R&D Investment
- 14.6 Patent and Intellectual Property Trends
- 14.7 Energy Efficiency and Resource Management
- 14.8 Sustainability, Recycling and Circularity
- 14.9 Technology Roadmap, 2025-2035
- 14.10 Risks of Obsolescence and Technology Substitution
Chapter 15 Global Sustainable Outdoor Clothing Market Key Strategic Imperatives
- 15.1 Growth and Market Entry Priorities
- 15.2 High-Return Products and Segments
- 15.3 Pricing, Profitability and Cost Optimization
- 15.4 Technology Investment and Product Differentiation
- 15.5 Supply Chain Localization and Resilience
- 15.6 Distribution and Customer Acquisition
- 15.7 Partnership, Acquisition and Capacity Strategy
- 15.8 Regional Expansion Priorities
- 15.9 Short-, Medium- and Long-Term Actions
Chapter 16 Competition Outlook
- 16.1 Industry Competition Characteristics
- 16.2 Market Structure and Concentration
- 16.3 Market Share and Competitive Positioning, 2025
- 16.4 Company-Wise Revenue and Product Benchmarking
- 16.5 Production and Service Capacity Benchmarking
- 16.6 Technology, Pricing and Differentiation
- 16.7 Regional Footprint and Distribution Strength
- 16.8 Mergers, Acquisitions and Strategic Alliances
- 16.9 New Entrants and Competitive Threats
- 16.10 Porter's Five Forces and Industry Attractiveness
- 16.11 Competitive Outlook, 2025-2035
Chapter 17 Company Profiles
- 17.1 Company Coverage and Selection Criteria
- 17.2 Patagonia
- 17.2.1 Business Description
- 17.2.2 Company Ownership and Geographic Presence
- 17.2.3 Product and Service Portfolio
- 17.2.4 Manufacturing and Operating Footprint
- 17.2.5 Production Capacity and Expansion Plans
- 17.2.6 Financial Performance and Investment
- 17.2.7 Market Share and Competitive Position
- 17.2.8 Technology and Innovation Capabilities
- 17.2.9 Strategic Alliances or Partnerships
- 17.2.10 Recent Developments
- 17.2.11 Growth Strategy and Outlook
- 17.3 The North Face (VF Corporation)
- 17.4 Arc'teryx (Amer Sports)
- 17.5 Columbia Sportswear
- 17.6 Decathlon
- 17.7 Fjällräven (Fenix Outdoor)
- 17.8 Goldwin
- 17.9 Tentree
- 17.10 VAUDE
- 17.11 Picture Organic Clothing
- 17.12 Other Relevant Market Participants
Note: Every listed company is profiled on the structure shown under the first company. The company list is preliminary and may change based on research findings, market developments, data availability and client requirements.
Chapter 18 Disclaimer
- 18.1 Research and Forecast Disclaimer
- 18.2 Data Source and Estimation Limitations
Note: The depth of individual sections depends on data availability for this market. Volume, capacity, trade and other unit-based metrics are included where applicable.