Tariffs and resale reshape how American women buy clothes
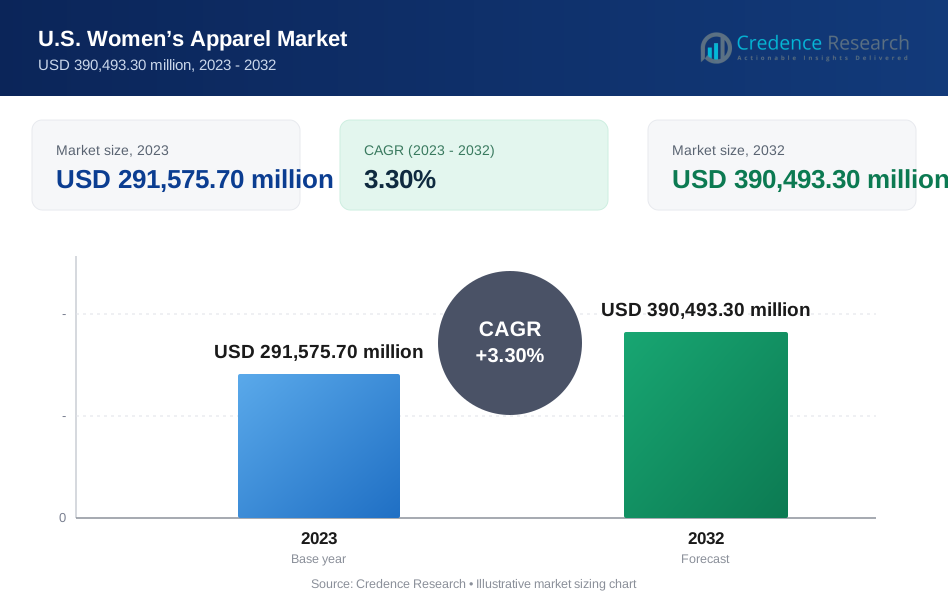
The U.S. women’s apparel market was valued at USD 255.00 billion in 2025 and is projected to increase from USD 263.42 billion in 2026 to USD 352.81 billion by 2035, registering a CAGR of 3.30% during 2026–2035. Demand comes from 76.9 million employed women, a growing group of shoppers aged 65 and over, and a steady move toward online checkout. South held the largest regional share, 37.5% in 2025, because it has the largest population and gained the most residents of the four census regions since 2020. South is also the fastest-growing region at 3.6% a year. Trade policy is the main commercial change, since duty-free treatment for low-value parcels ended for all countries on Aug. 29, 2025. In addition, Section 301 duties of 12.5% on goods from China and Vietnam took effect on July 24, 2026, which raises landed costs for brands that still source heavily from Asia.
What does the U.S. women’s apparel market count, and how do women buy clothing?
The value counts new casual wear, formal wear, sportswear, night wear and inner wear bought by and for women and girls aged five and over in the United States. Purchases run through department stores, specialty chains, off-price stores, mass merchants, brand websites and marketplaces, and most spending happens at full or promoted retail prices.
The 2025 value is anchored on Bureau of Economic Analysis data, which put household spending on women’s and girls’ clothing at USD 254.8 billion in 2025. Footwear, handbags, jewelry, secondhand garments and clothing rentals are excluded from the value, although resale and rental compete for the same budget. The value chain runs from brand owners through contract factories, mainly in Vietnam, Bangladesh, China, India and Cambodia, to importers and retailers that set most shelf prices.
U.S. Women’s Apparel Market Insights
- The market moves from USD 255.00 billion in 2025 to USD 352.81 billion by 2035 at a 3.30% CAGR, a slower pace than the 2021 to 2025 recovery.
- The South led with 37.5% of 2025 value, as it added 7.6 million residents from 2020 to 2025, according to the Census Bureau.
- Casual Wear led types with 41.0% of 2025 value, because everyday tops, denim and dresses remain the core of most wardrobes.
- Duty-free de minimis entry ended on Aug. 29, 2025, and Section 301 duties of 12.5% on Vietnam and China began on July 24, 2026.
- Saks Global filed for Chapter 11 on Jan. 14, 2026, while Macy’s plans to close about 150 stores by the end of 2026.
Casual lines lead while intimates and online gain ground
Which clothing types lead the casual wear market for U.S. women?
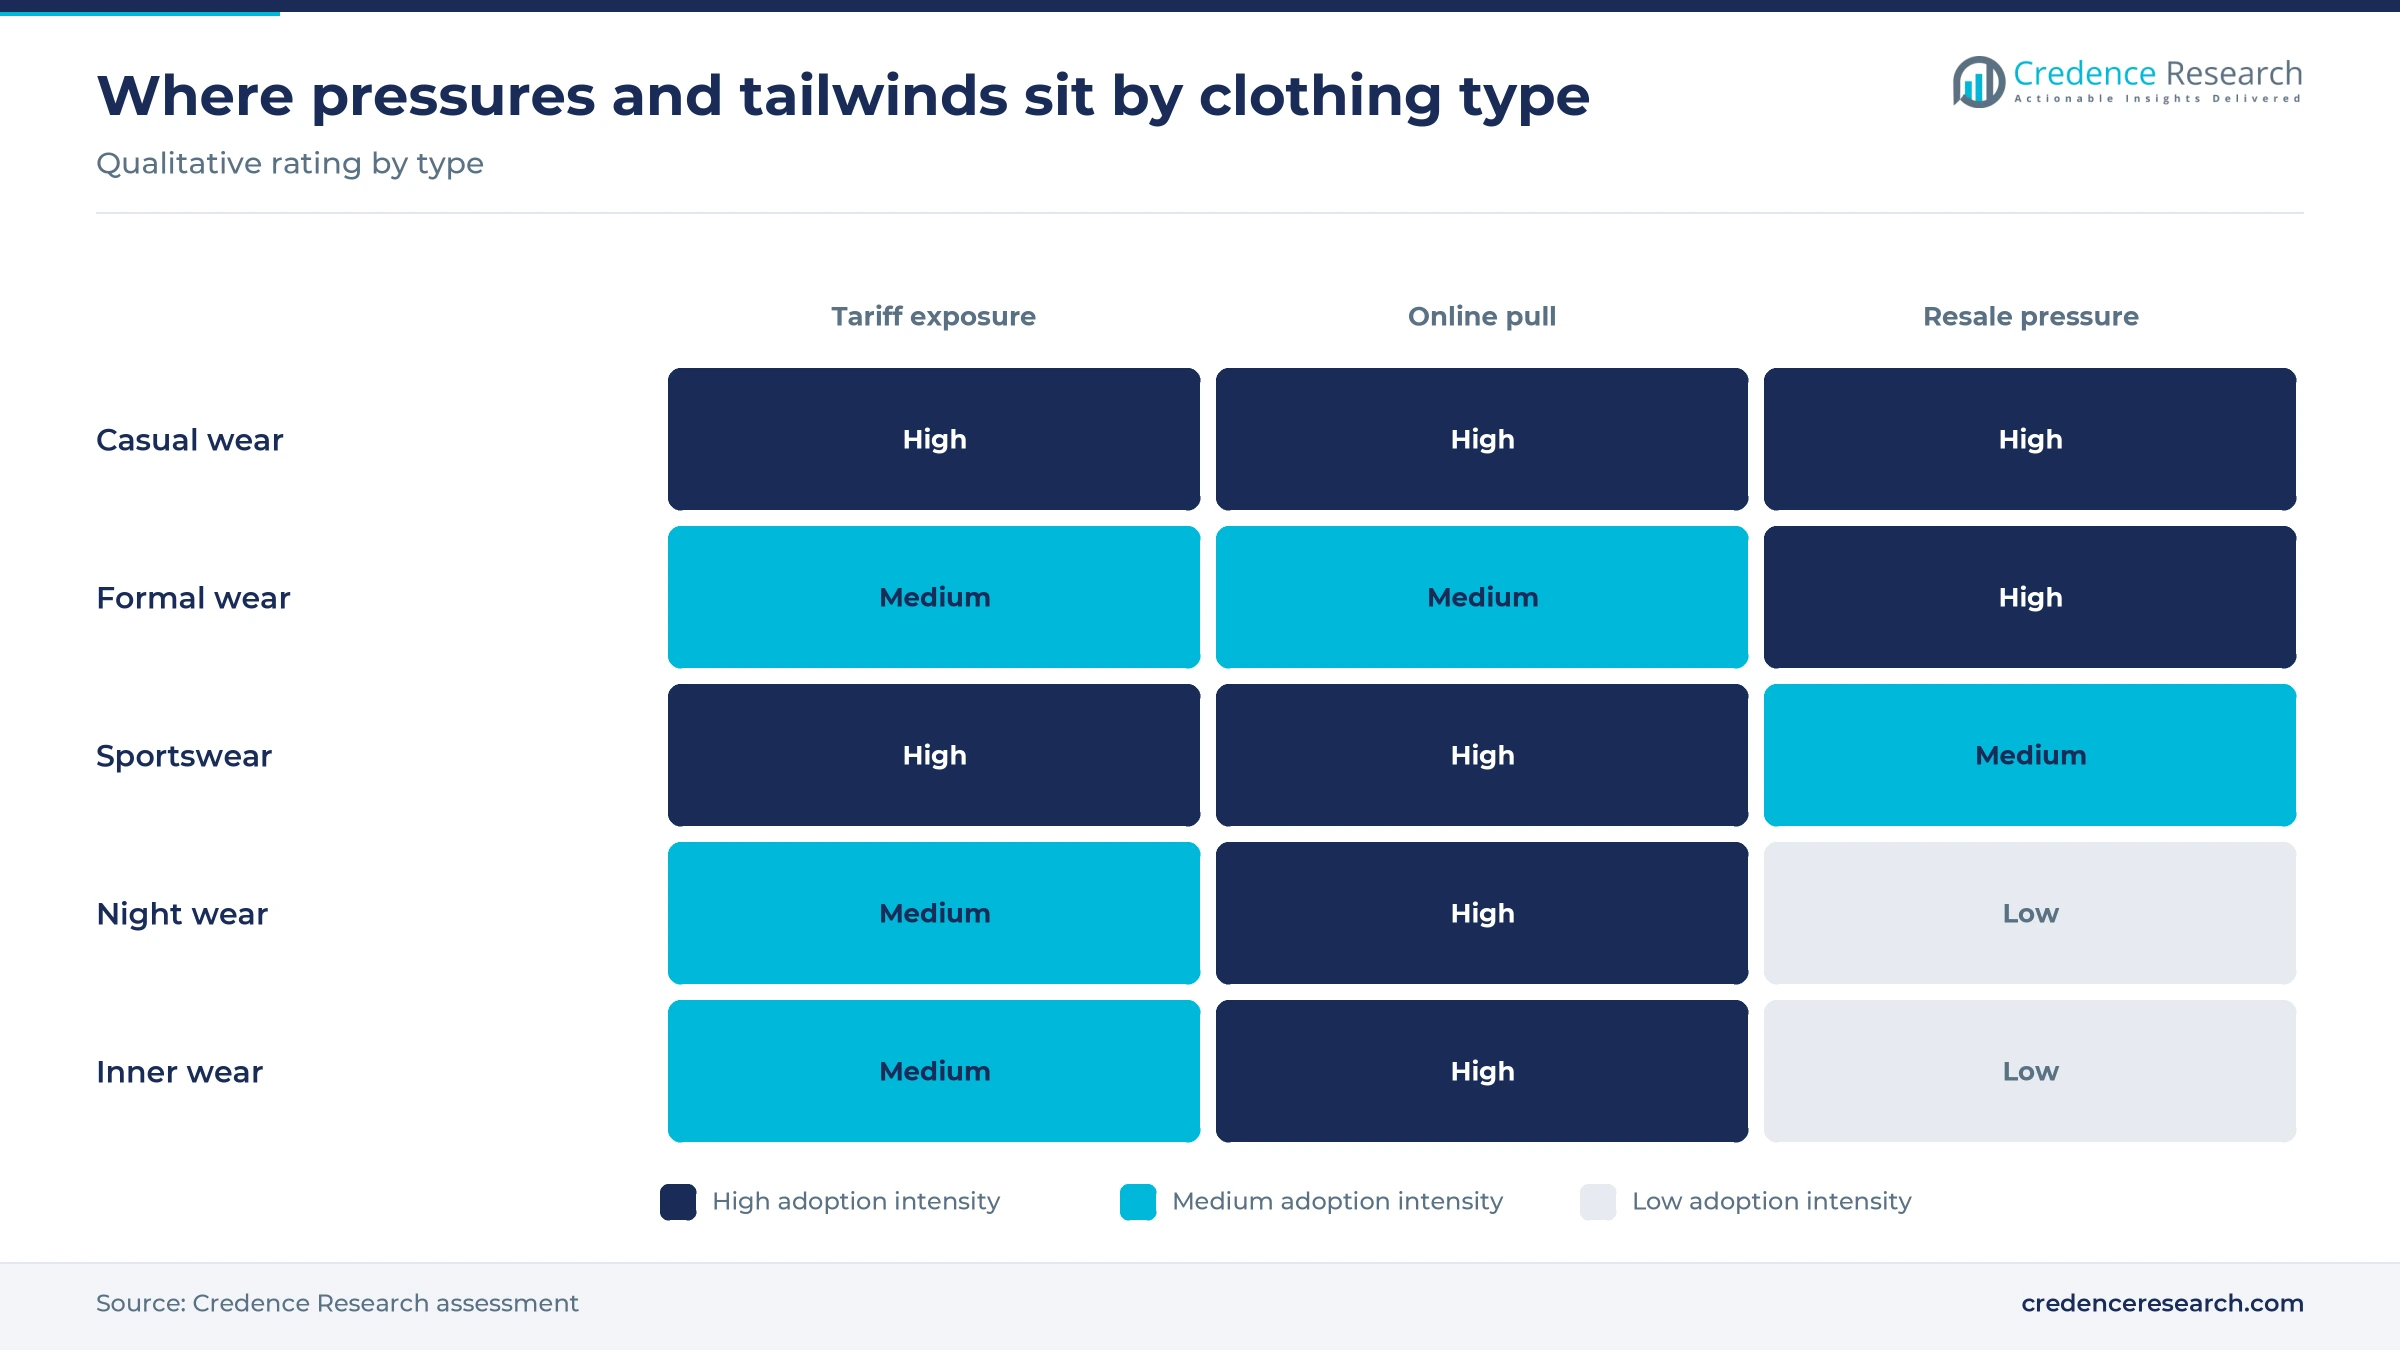
Based on type, the market is categorized into casual wear, formal wear, sportswear, night wear and inner wear. Casual Wear led with 41.0% of 2025 value because everyday denim, tops and dresses drive specialty chains, and the Gap brand posted comparable sales up 10% in the quarter ended Aug. 1, 2026, according to Gap Inc. Inner Wear grows fastest at 4.0% a year, as Victoria’s Secret reported a third straight quarter of comparable sales gains, up 8% in the period ended Jan. 31, 2026, on a renewed focus on bras. Sportswear demand is mixed, since Lululemon’s Americas comparable sales fell 5% in early 2026 while activewear launches continued.
Do mass, premium or luxury labels capture most spending?
Based on price range, the market is categorized into mass, premium and luxury. Mass led with 58.0% of 2025 value because off-price, mall and value chains reach the most shoppers, although Old Navy comparable sales slipped 4% in the quarter ended Aug. 1, 2026, according to Gap Inc. Premium grows fastest at 3.8% a year, as the Gap and Banana Republic brands both posted comparable sales gains in that same quarter, according to the company’s release of Aug. 27, 2026. In contrast, luxury clothing retail came under strain when Saks Global, owner of Saks Fifth Avenue and Neiman Marcus, filed for Chapter 11 on Jan. 14, 2026.
Which age groups of women spend the most on clothing?
Based on age group, the market is categorized into 5-16 years, 16-45 years, 45-70 years and 70 and above. 16-45 Years led with 50.0% of 2025 value because this band covers most working women, and the Bureau of Labor Statistics counted 76.9 million employed women in 2025. Their workwear, casual and athletic needs keep purchase frequency high. 70 and Above grows fastest at 4.6% a year, as the Census Bureau reported that the population aged 65 and over rose 16.2% to 64.6 million from 2020 to 2025. Meanwhile, the under-18 population fell 2.4% over those years, which limits growth for girls’ ranges.
How are apparel market distribution channels shifting online?
Based on distribution channel, the market is categorized into offline and online. Offline led with 64.0% of 2025 value because clothing and accessory stores still sold USD 26.50 billion in August 2026, up 4.1% from a year earlier, according to Census Bureau estimates reported by FashionUnited. Department chains, off-price stores and specialty boutiques keep fitting and same-day returns in their favor. Online grows fastest at 4.3% a year, as total U.S. e-commerce rose 12.2% in the second quarter of 2026, according to the Census Bureau, and Gap Inc. already books 35% of its net sales online.
| Segment Group | Leading Sub-segment | Share, 2025 | Fastest-growing Sub-segment | CAGR, 2026–2035 |
|---|---|---|---|---|
| By Type | Casual Wear | 41.0% | Inner Wear | 4.0% |
| By Price Range | Mass | 58.0% | Premium | 3.8% |
| By Age Group | 16-45 Years | 50.0% | 70 and Above | 4.6% |
| By Distribution Channel | Offline | 64.0% | Online | 4.3% |
Request a Free Sample
Fill in your details and we'll send you a free sample report.
- Sample data tables & charts
- Research methodology
Working women, older buyers and digital checkout lift value
Female employment keeps workwear and casual purchases steady
Paid work sets a high floor for spending on blazers, trousers, casual layers and commuting outerwear for women’s apparel retailers. The Bureau of Labor Statistics counted 76.9 million employed women aged 16 and over in 2025, with a labor force participation rate of 57.3%. Women also made up 50.9% of the population and outnumbered men by 6.3 million, according to the Census Bureau in June 2026. In turn, the Bureau of Economic Analysis reported that household spending on women’s and girls’ clothing rose 6.0% in 2025, faster than total clothing at 5.8%. As a result, Credence Research expects the 16-45 Years band to keep 50.0% of value while it absorbs most new work and occasion purchases.
Older shoppers become a dependable growth base
The population aged 65 and over is rising faster than any other age group, and this widens a buyer base once seen as static. The Census Bureau reported in June 2026 that this group grew 16.2% from 2020 to 2025, reaching 64.6 million, and every region added at least 14%. In contrast, the under-18 population fell 2.4% over the same years, which narrows the base for girls’ ranges. Older shoppers also favor comfort fits, easy-care fabrics and repeat purchases from trusted brands. Consequently, the oldest band gains share over the forecast, while the 45-70 band benefits as baby boomers and Generation X stay in work longer than earlier cohorts.
How much does online checkout add to clothing sales?
Online checkout adds reach, because shoppers now compare sizes, prices and return terms across many brands within minutes. U.S. e-commerce reached USD 340.2 billion in the second quarter of 2026, or 17.1% of total retail sales, according to the Census Bureau. That figure rose 12.2% from a year earlier, while nonstore retailers grew 7.9% in August 2026, as FashionUnited reported from Census data. Gap Inc. said in August 2026 that online sales made up 35% of its net sales. Therefore, Credence Research expects online to keep gaining share, although store networks remain important for returns, fitting and fast replenishment.
Volume, not only price, carried spending in 2025
Inflation-adjusted purchases outpaced dollar outlays in 2025, so more garments were bought even as average tickets eased. The Bureau of Economic Analysis put real spending on women’s and girls’ clothing up 6.9% in 2025, ahead of the nominal gain, so average prices eased that year. Prices then turned up, since the women’s and girls’ apparel index rose 3.5% in the 12 months to August 2026, according to BLS data reported by FashionUnited. Clothing store sales also rose 4.1% in August 2026 from a year earlier. Credence Research therefore expects price to carry more of the growth in 2026 as tariff costs reach shelves.
Sourcing shifts, resale and new athletic brands emerge
Sourcing shifts from China to Vietnam and South Asia
Sourcing is shifting away from China as brands spread duty and supply risk across several Asian countries. In 2025, China supplied only 8.2% of U.S. cotton-dominant apparel imports by value, 5.6 points below its 2020 to 2024 average, according to a Texas Tech University briefing using OTEXA data. Its share of man-made fiber apparel fell 11.2 points to 18.2%, while Vietnam rose to 26.6% of that category. Total cotton and man-made fiber apparel imports reached USD 72.7 billion in 2025, slightly below 2024. Because Section 301 duties now apply at the higher rate to both China and Vietnam, Bangladesh, India and Cambodia may gain further at their lower rate.
Resale rises faster than new clothing retail
Resale is rising faster than new clothing sales and now competes directly for the same wardrobe budget. ThredUp’s 2026 Resale Report, covered by Retail Dive on April 3, 2026, found that resale grew about four times faster than general clothing retail in 2025. The report projects U.S. secondhand apparel at about USD 78.8 billion by 2030, growing about 7.3% a year. As a result, secondhand clothing gains pressure full-price casual lines most. California’s textile recovery law adds a policy push, since producers had to join Landbell USA, the approved stewardship body, by July 1, 2026.
Opportunity in new athletic brands designed for women
Athletic brands designed around women’s bodies offer an opening, because incumbents have lost momentum and shoppers are testing new labels. NikeSKIMS, a brand created by Nike and Skims, launched its first collection on Sept. 26, 2025, according to Sole Retriever. At the same time, Lululemon’s Americas comparable sales fell 5% in the quarter reported in June 2026, after negative social commentary about fabric content. Gap Inc. reported that Athleta comparable sales fell 12% in the quarter ended Aug. 1, 2026. Consequently, brands that pair clear fiber labeling with new fits can win share in a category where shoppers are already switching labels.
Opportunity in extended sizes and comfort-led ranges
Extended sizes and comfort-led ranges offer an opening because the buyer base is aging and spending more per visit on fit. The Census Bureau counted 64.6 million residents aged 65 and over in 2025, and every region added at least 14% to that group since 2020. Victoria’s Secret credited new customer acquisition and higher average unit retail for its 8% comparable sales gain in the quarter ended Jan. 31, 2026, according to Chain Store Age. In turn, retailers can expand plus-size clothing ranges, soft bras and relaxed workwear. Because these shoppers repeat purchases with trusted brands, early range depth could support loyalty through 2035.
Duties, store closures and waste rules raise costs
How do new duties affect clothing prices and planning?
Duty changes make seasonal buying hard, because orders are placed months before landed costs are known. Section 301 duties took effect on July 24, 2026, at 12.5% for China and Vietnam and 10% for Bangladesh, India and Cambodia, according to Baker Donelson. These rates stack on regular duties, although DR-CAFTA apparel is exempt. Smaller importers carry the most risk, while larger brands can shift factories toward Central America.
Why are department and fast-fashion stores closing?
Store-heavy chains face closures as traffic moves online and to off-price rivals. Forever 21 filed for bankruptcy on March 16, 2025, and began liquidating more than 350 U.S. stores, citing Shein and Temu’s use of the de minimis exemption, according to NBC. Macy’s is closing 66 stores in 2025 within a plan for about 150 closures by the end of 2026. Mall landlords and brands that rely on department-store wholesale lose shelf space as a result.
Textile recovery rules add new stewardship costs
Producer funding for collection and recycling adds a new cost risk for brands that sell into California. The EPA estimated 17 million tons of textile waste in 2018, with 11.3 million tons landfilled and only 13% of clothing and footwear recycled. California producers had to join Landbell USA by July 1, 2026, and later penalties can reach USD 10,000 a day. Brands selling into California must therefore track volumes and fiber content by product.
Is the end of de minimis hurting low-price online sellers?
Low-price marketplaces lost their cost edge when duty-free parcel entry ended, and their user numbers fell quickly. CNBC reported in June 2025, citing app-usage data, that Temu’s U.S. daily active users fell 52% in May from March, while Shein’s fell 25%. The exemption then ended for all countries on Aug. 29, 2025. Budget shoppers may face higher prices as a result, while domestic mass chains gain a chance to recapture them.
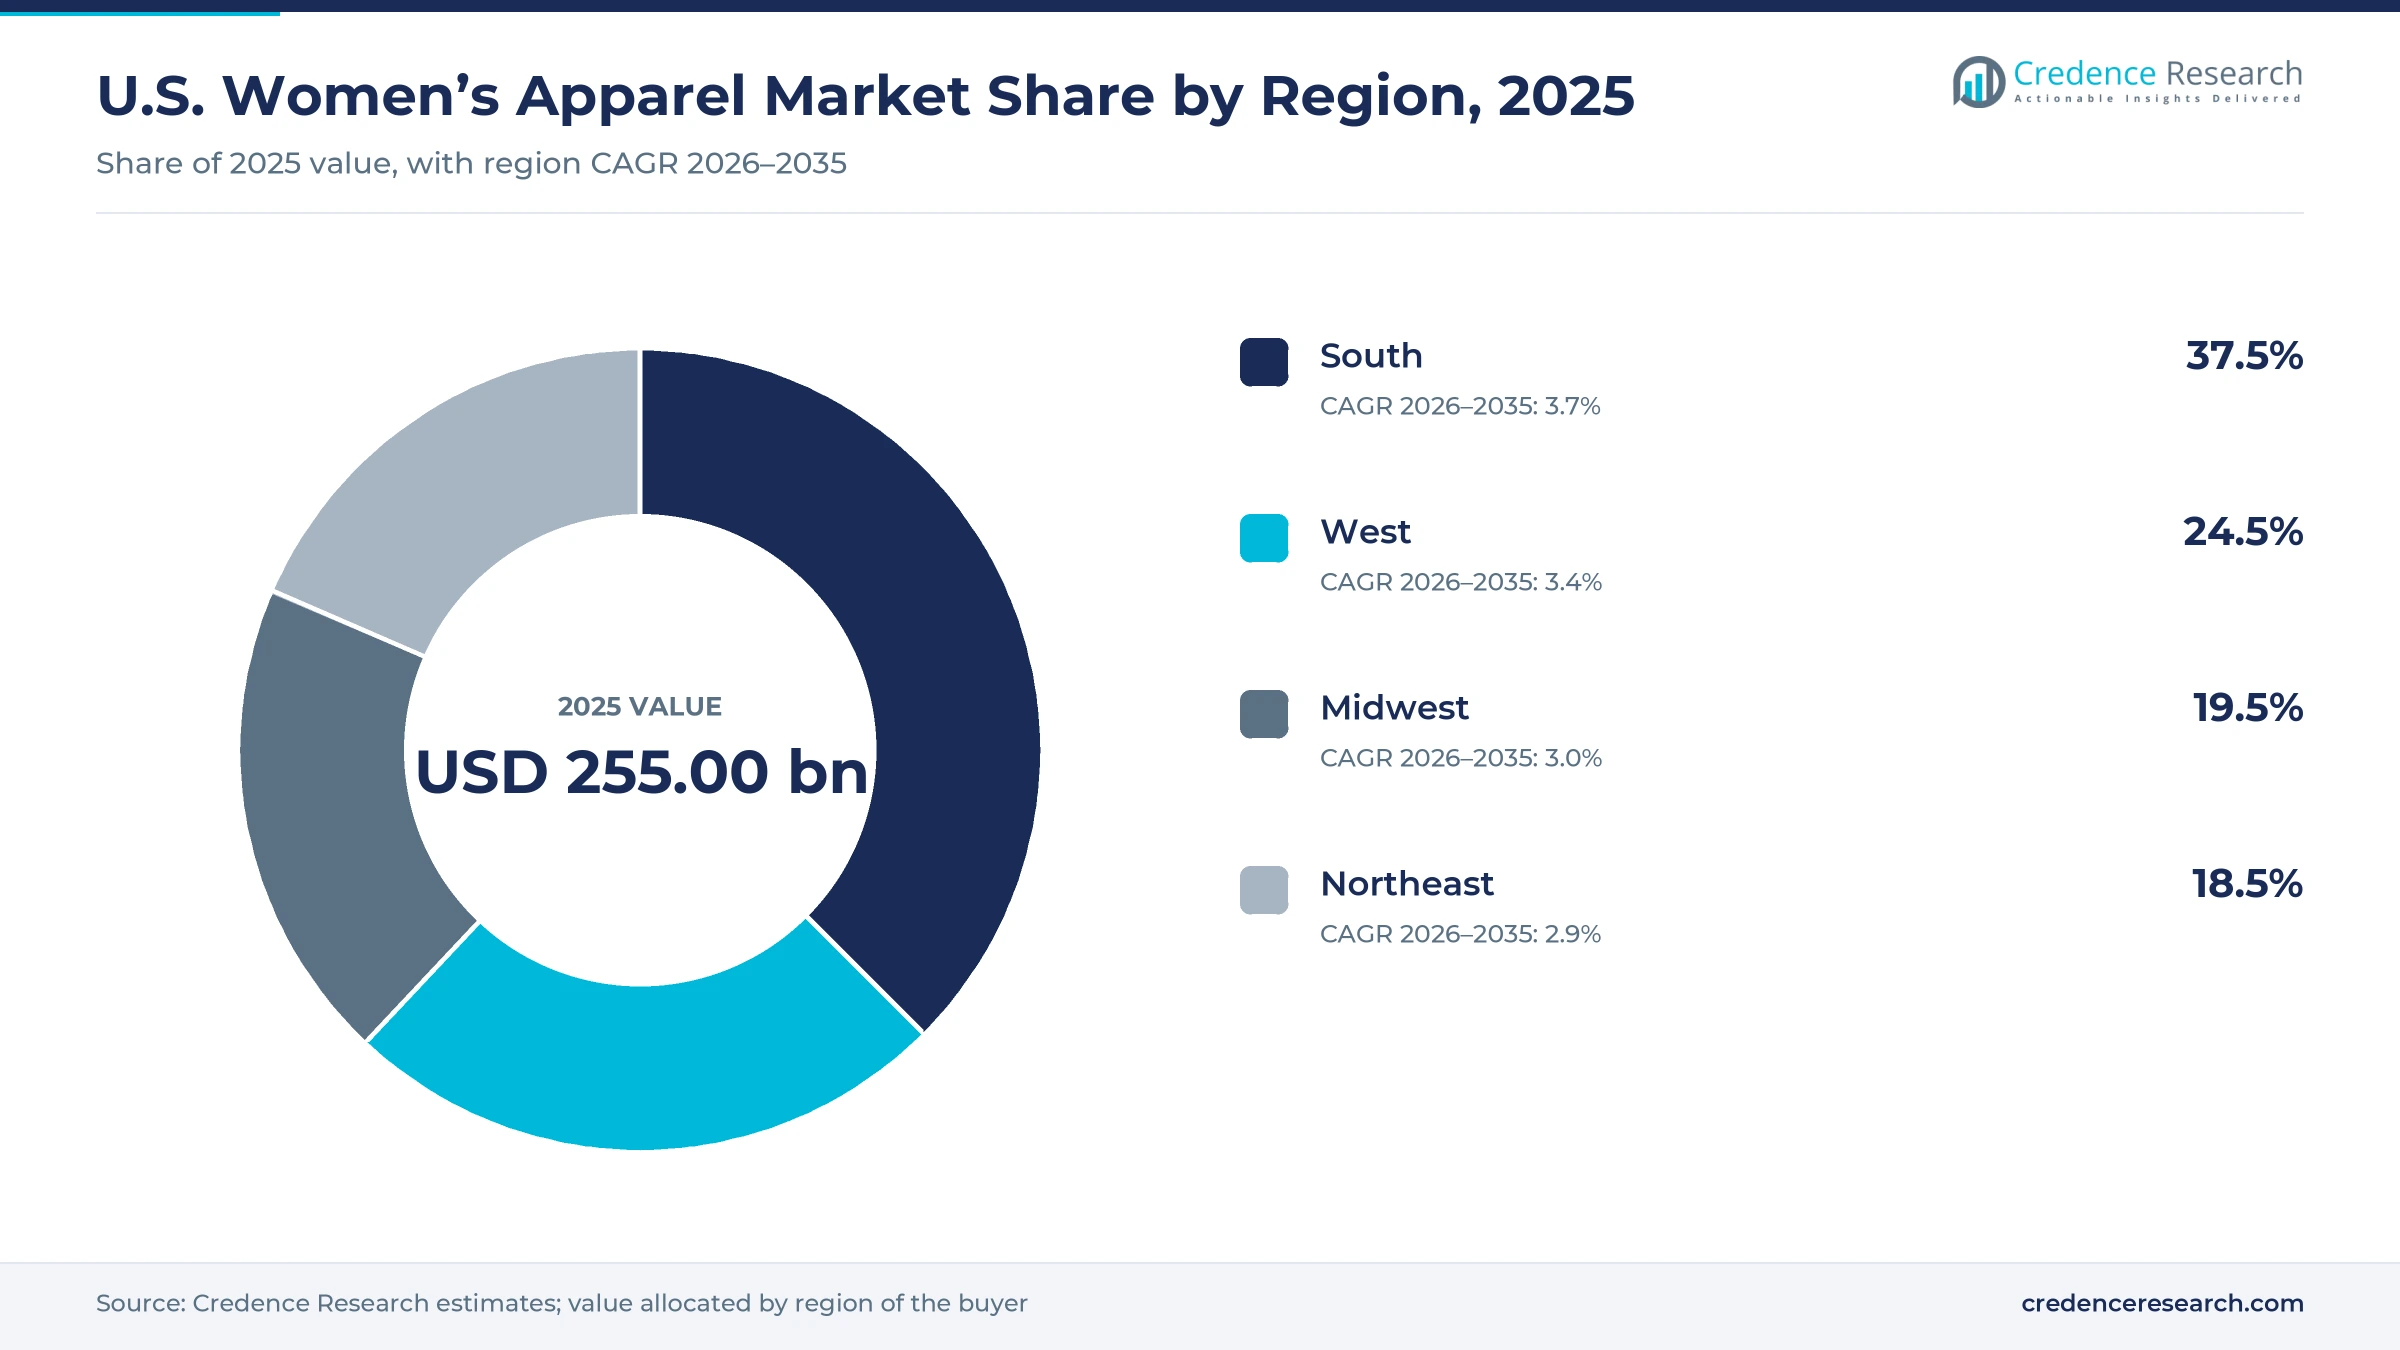
The South gains share on faster population growth
| Region | Value, 2025 (USD billion) | Share, 2025 | CAGR, 2026–2035 |
|---|---|---|---|
| South | 95.62 | 37.5% | 3.6% |
| West | 62.48 | 24.5% | 3.4% |
| Midwest | 49.73 | 19.5% | 3.0% |
| Northeast | 47.17 | 18.5% | 2.9% |
South leads on population growth and retail expansion
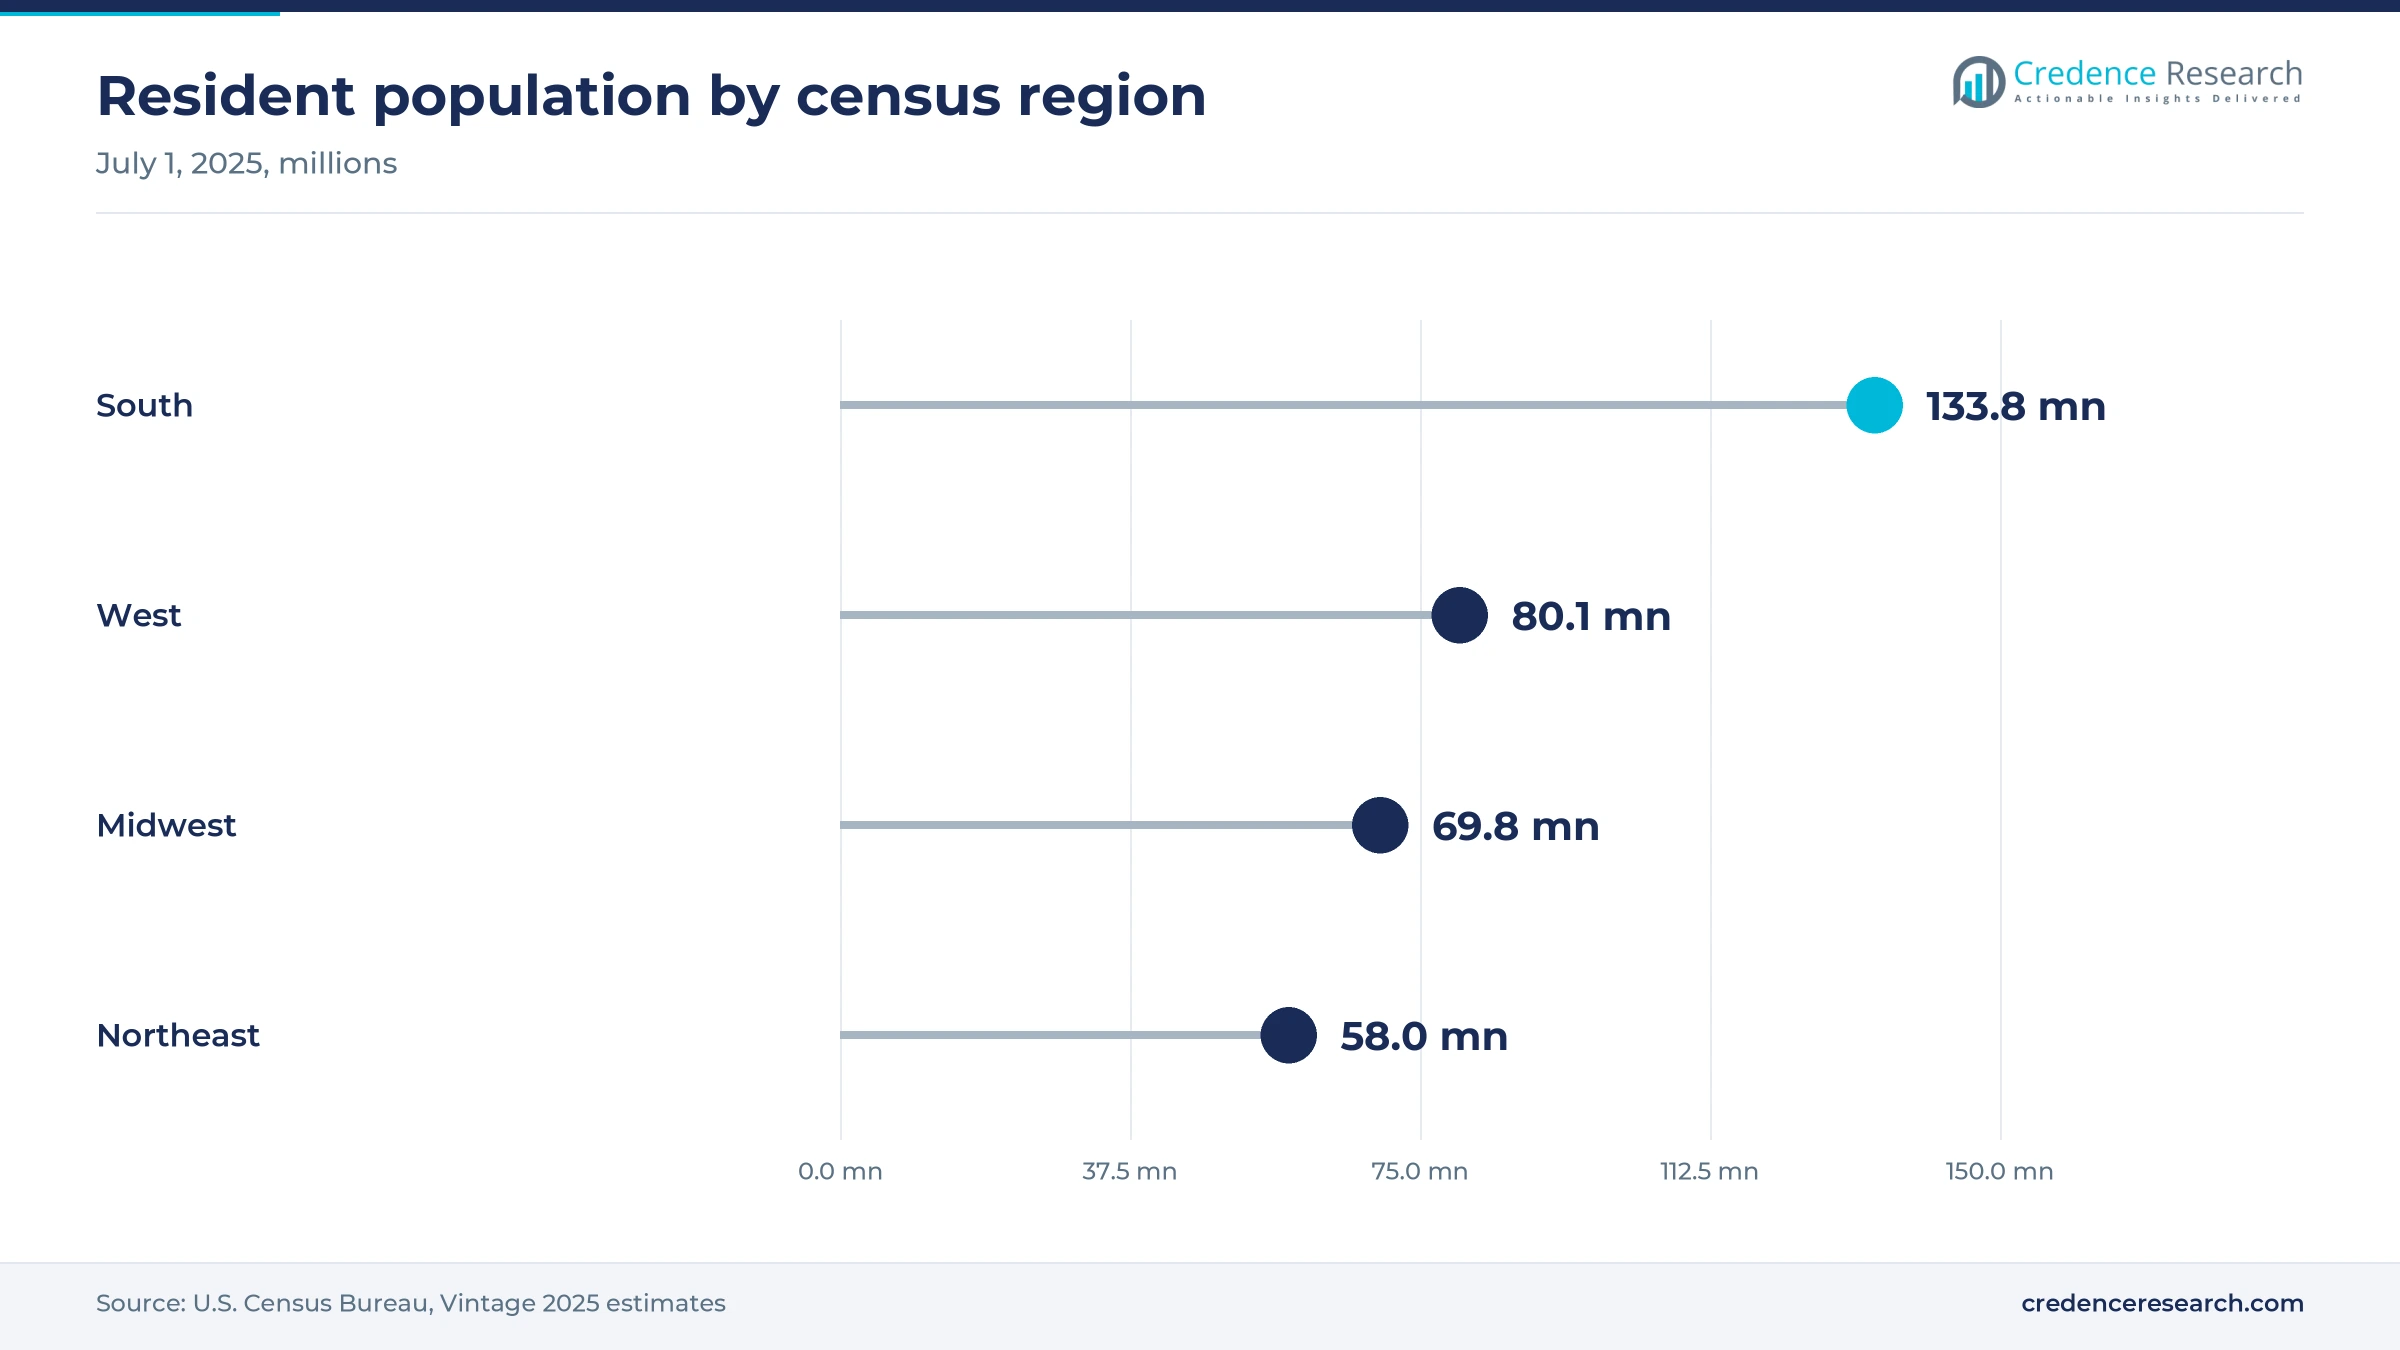
The South held 37.5% of 2025 value and grows at 3.6% a year, the fastest pace of the four regions. The Census Bureau counted 133.8 million residents there on July 1, 2025, after a 6.0% gain since 2020, and it was the only region whose under-18 population grew. Its population aged 65 and over also rose 17.5% to 24.8 million over those years, which supports both girls’ ranges and comfort-led adult lines.
West pairs high spending with new textile recovery rules
The West held 24.5% of 2025 value and grows at 3.4% a year, supported by 80.1 million residents, according to the Census Bureau. Its under-18 population fell 5.7% from 2020 to 2025, so adult and older buyers carry more of its growth. California’s textile recovery law also required producers to join Landbell USA by July 1, 2026, which makes the region the first test of clothing stewardship costs.
Midwest relies on value chains and steady workwear demand
The Midwest held 19.5% of 2025 value and grows at 3.0% a year, a little below the national rate. The Census Bureau estimated 69.8 million residents there in July 2025, up only 1.1% since 2020. Its under-18 population fell 3.9% over the same years, and Credence Research assumes a larger role for mass and off-price chains, so it tilts growth below the U.S. average.
Northeast keeps fashion visibility but grows slowly
The Northeast held 18.5% of 2025 value and grows at 2.9% a year, the slowest of the four regions. It had 58.0 million residents in July 2025, up 0.7% since 2020, according to the Census Bureau. New York remains the home of many brands and of Saks Global, whose Chapter 11 filing on Jan. 14, 2026 shows the pressure on full-price department stores in the region.
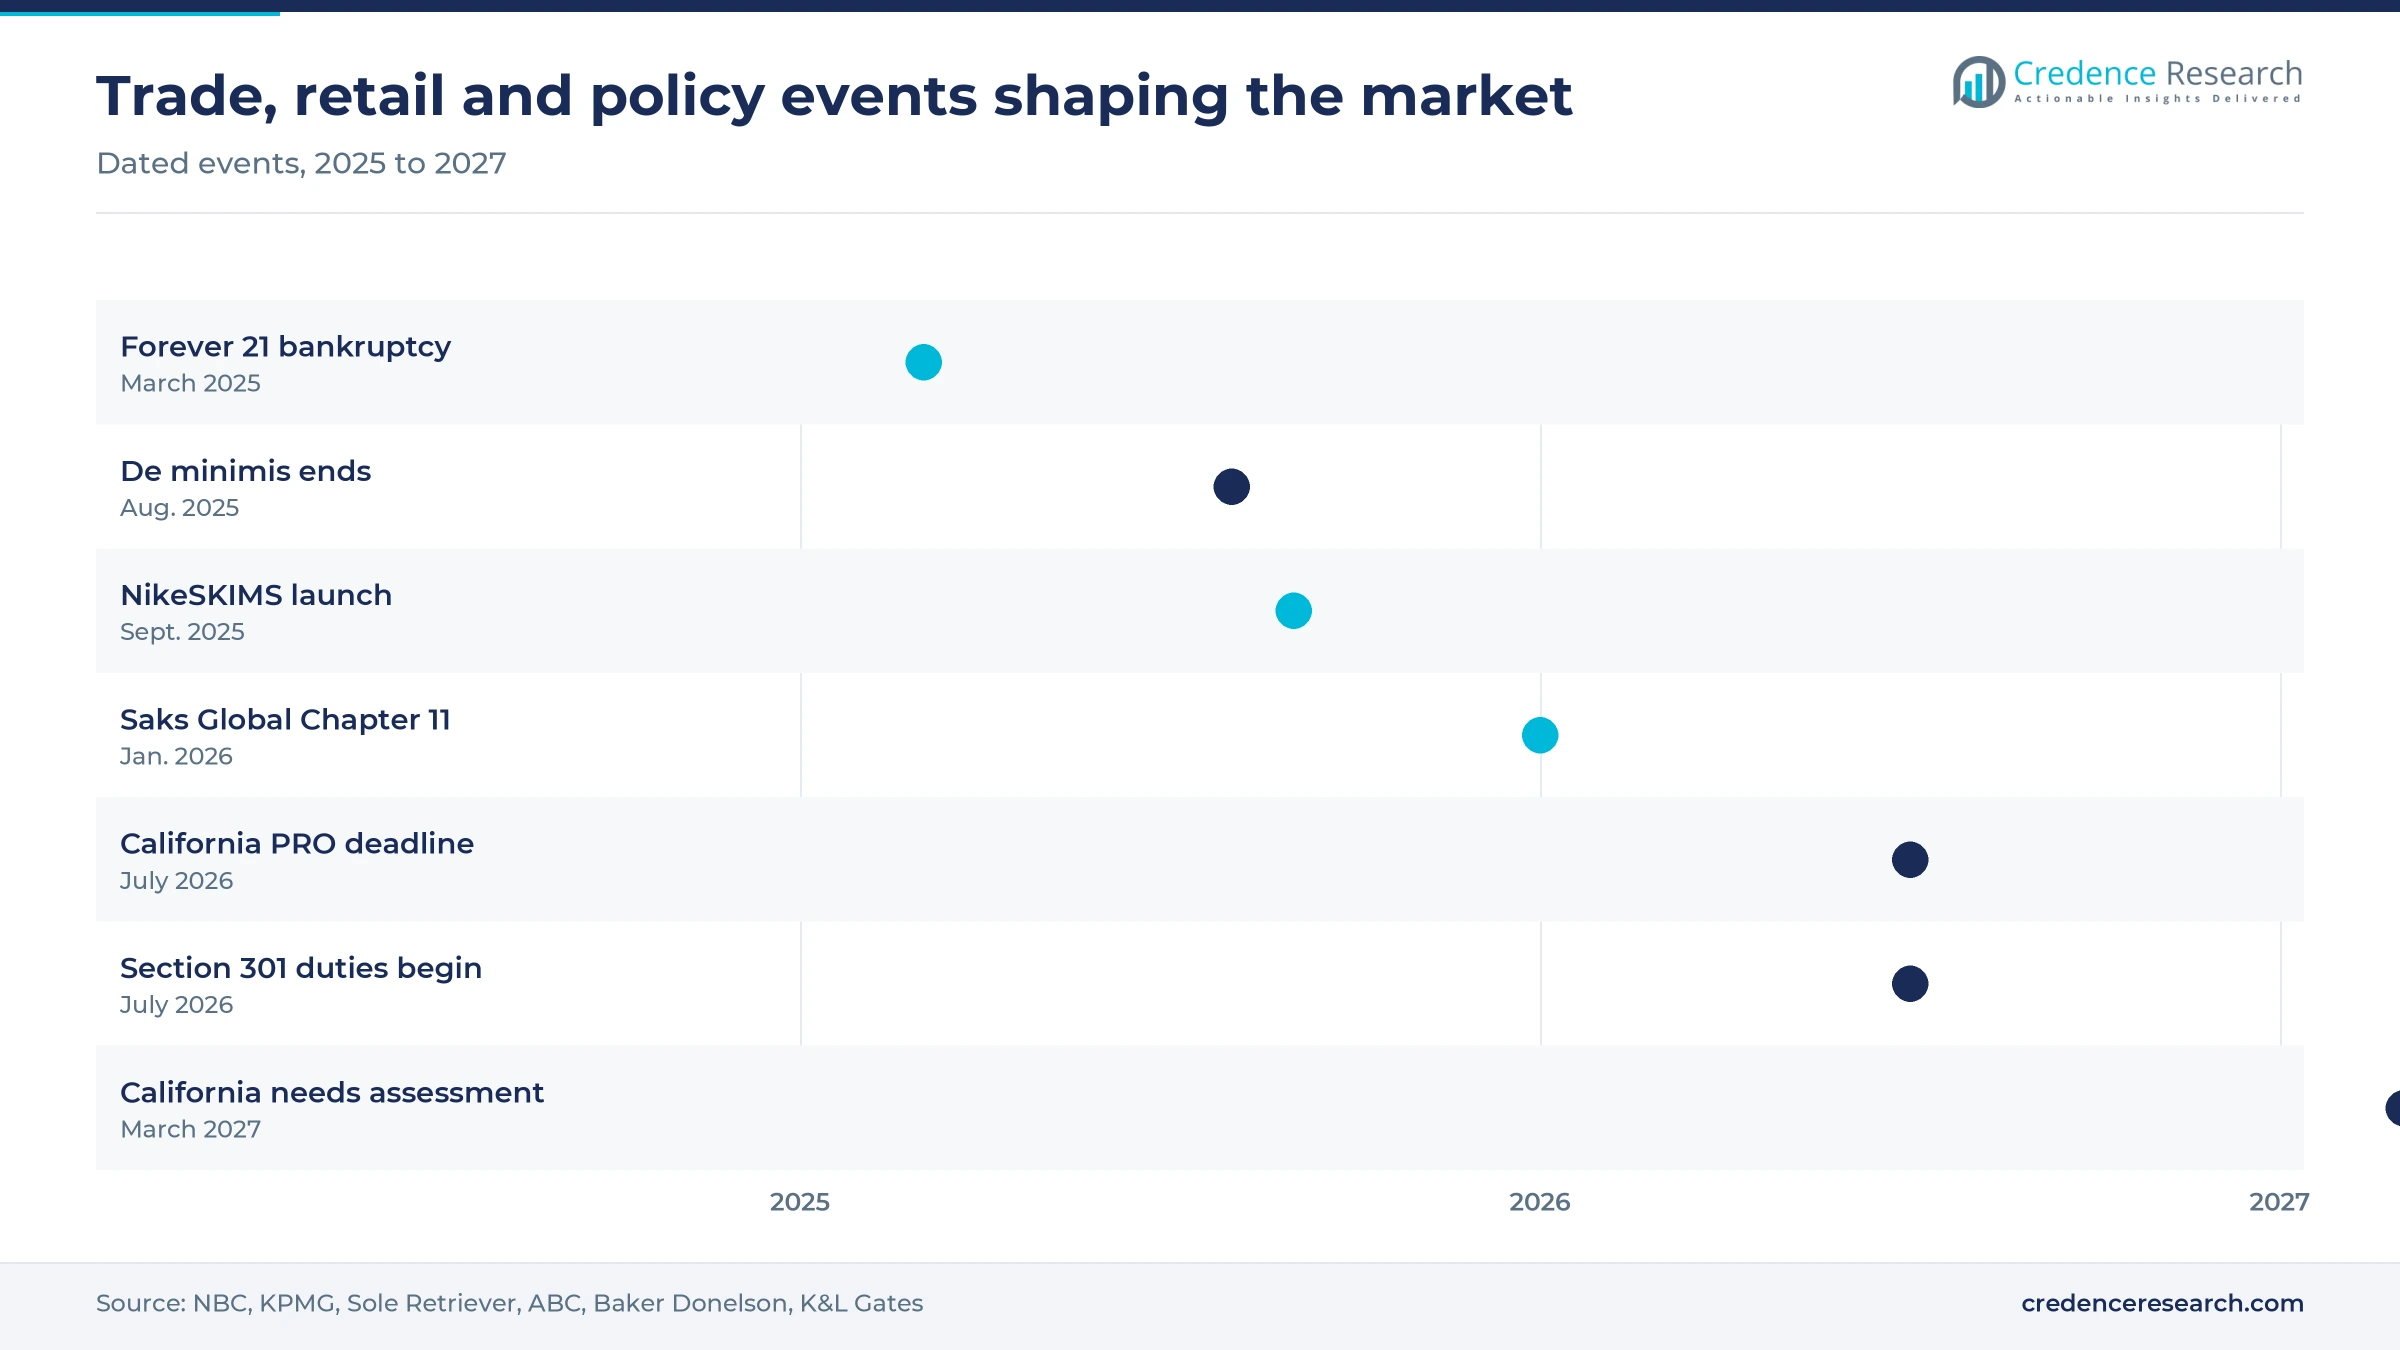
Bankruptcies, launches and new duties mark 2025–2026
| Development | Status and market relevance |
|---|---|
| In March 2025, Forever 21 filed for bankruptcy and began liquidating more than 350 U.S. stores. | The company blamed low-price rivals that used the de minimis exemption. |
| In August 2025, duty-free de minimis treatment ended for low-value shipments from all countries. | Parcels valued at USD 800 or less now pay applicable duties, taxes and fees. |
| In September 2025, Nike and Skims released the first NikeSKIMS collection for women. | The launch added a new athletic label in a category where incumbents are slowing. |
| In January 2026, Saks Global, owner of Saks Fifth Avenue and Neiman Marcus, filed for Chapter 11. | The filing signals strain on full-price luxury department stores. |
| In July 2026, Section 301 duties of 10% to 12.5% took effect on goods from 60 economies. | DR-CAFTA apparel entering duty-free is exempt, which favors Central American supply. |
Fiber labels, faster reorders and recycling rules matter
- Fiber content disclosure has become a reputational issue, since Lululemon announced in June 2026 that it linked lower traffic in early 2026 to negative social commentary about product composition.
- Chase buying lets brands reorder winning styles within a season, and Lululemon said it is speeding up these capabilities by 20%.
- Textile recycling programs now need producer funding in California, where the statewide needs assessment is due on March 1, 2027.
- Customs data systems matter more after de minimis ended, because every low-value parcel now needs duty, tax and fee treatment at entry.
Need a Custom Version of This Report?
Tailor the scope, geography, or segments to your exact requirements.
- Custom geography or segment scope
- Direct access to our analyst team
Specialty chains compete with athletic and resale brands
Competition in women’s apparel splits into mass and online sellers such as Amazon and Walmart, off-price chains led by TJX, specialty chains, athletic brands, department stores and low-price marketplaces, while resale platforms compete for the same budget. Gap Inc. announced in August 2026 that it operates nearly 3,500 locations worldwide, and its brands moved in different directions in mid-2026, with the Gap brand rising while Old Navy and Athleta fell. Credence Research views Nike and Lululemon as the leaders in performance clothing, although Lululemon is reworking product after weaker Americas sales, and Nike has added NikeSKIMS. Victoria’s Secret leads intimates, operates 1,420 stores in about 70 countries and plans to open a standalone Pink pop-up in SoHo in 2026. Macy’s is shrinking its fleet, and Saks Global is restructuring its luxury stores through Chapter 11. Shein and Temu lost their parcel duty advantage in 2025, which narrows their price gap with domestic chains. ThredUp and other resale sites now compete for the same budget, and clothing rental services add another alternative for occasion wear.
Companies profiled and their roles in this market
| Company | Type | Role in the market |
|---|---|---|
| Amazon | Online marketplace | Sells women’s clothing from brands and its own Amazon Essentials label |
| Walmart | Mass merchant | Sells women’s apparel under its own Time and Tru and Free Assembly brands |
| The TJX Companies | Off-price retailer | Sells branded women’s apparel at discounts through T.J. Maxx and Marshalls stores |
| Gap Inc. | Specialty retailer | Owner of Old Navy, Gap, Banana Republic and Athleta with 35% of sales online |
| Nike | Athletic brand | Launched the NikeSKIMS women’s line in September 2025 |
| Lululemon | Athletic brand | Premium activewear brand reworking product after weaker 2026 Americas sales |
| Victoria’s Secret & Co. | Intimates retailer | Bra and Pink brand owner with 1,420 stores in about 70 countries |
| Macy’s | Department store | Closing about 150 stores by the end of 2026 |
| Shein | Online fast-fashion seller | Low-price marketplace affected by the end of de minimis entry |
| Saks Global | Luxury department store | Owner of Saks Fifth Avenue and Neiman Marcus, in Chapter 11 since January 2026 |
Why Credence Research expects price to do more work
Credence Research’s view is that price will do more of the work from 2026 than it did in 2025. Real spending on women’s and girls’ clothing grew faster than nominal spending in 2025, according to the Bureau of Economic Analysis, so average prices eased. However, the women’s and girls’ apparel price index then rose 3.5% in the year to August 2026, as new duties reached shelves. The women’s apparel forecast therefore keeps a moderate 3.30% CAGR, because higher prices and resale substitution could slow the number of new garments bought.
How the 2025 value was updated and checked
The report uses 2025 as the base year and 2026 to 2035 as the forecast period. The earlier Credence Research estimate was brought to 2025 with its own growth rate, then corrected to a Credence Research estimate anchored on Bureau of Economic Analysis household spending on women’s and girls’ clothing of USD 254.8 billion in 2025, with the earlier growth rate kept. Regional splits are Credence Research estimates from Census Bureau population data, and segment splits are estimates anchored to company, trade and labor data. Sources include government statistics, trade data, company filings and trade press, and no interviews or surveys were conducted.
A slower, more online clothing market through 2035
Through 2035, Credence Research expects value to grow slowly but steadily as working women and older shoppers sustain demand. Online channels should narrow the gap with stores, while the South keeps adding share on population growth. Tariff policy remains the largest swing factor, especially whether Section 301 rates on Vietnam and China change again. Resale and recycling rules will also reshape product life cycles, so brands that track fiber content and offer repair or take-back services should be better placed than those that depend only on new volume.
Frequently Asked Questions
What is the 2025 apparel market size for U.S. women?
Is U.S. women’s clothing spending still growing?
Which clothing type is the largest in this market?
Which American clothing brands lead women’s fashion?
How do 2026 tariffs affect women’s clothing prices?
How much of women’s clothing is sold online?
Is resale taking share from new clothing?
Which U.S. region buys the most women’s clothing?
Table of Content
Chapter 1 Market Segmentation
- 1.1 Segmentation Framework
- 1.1.1 Product and Service Classification
- 1.1.2 Application and End-Use Classification
- 1.1.3 Technology and Solution Classification
- 1.1.4 Customer and Distribution Channel Classification
- 1.1.5 Geographic Segmentation
- 1.1.6 Market Segment Definitions and Boundaries
- 1.2 By Type
- 1.2.1 Casual Wear
- 1.2.2 Sportswear
- 1.2.3 Formal Wear
- 1.2.4 Inner Wear
- 1.2.5 Night Wear
- 1.3 By Price Range
- 1.3.1 Mass
- 1.3.2 Premium
- 1.3.3 Luxury
- 1.4 By Age Group
- 1.4.1 5-16 Years
- 1.4.2 16-45 Years
- 1.4.3 45-70 Years
- 1.4.4 70 and Above
Chapter 2 Introduction
- 2.1 Report Objectives and Scope
- 2.2 Product Definition and Industry Terminology
- 2.3 Market Inclusions and Exclusions
- 2.4 Research Process
- 2.4.1 Primary Research and Expert Interviews
- 2.4.2 Secondary Research and Source Review
- 2.4.3 Top-Down and Bottom-Up Estimation
- 2.4.4 Data Triangulation and Verification
- 2.5 Market Size Measurement Basis
- 2.5.1 2025: USD 255.00 billion → 2035: USD 352.81 billion
- 2.6 Historical and Forecast Reference Periods
- 2.6.1 Historical Period: 2018-2025
- 2.6.2 Base Year: 2025
- 2.6.3 Forecast Period: 2025-2035
- 2.7 Research Assumptions and Limitations
Chapter 3 Executive Summary
- 3.1 Market Snapshot and Key Findings
- 3.2 Base-Year Market Size, 2025
- 3.3 Forecast Market Size, 2035
- 3.4 Revenue and Volume Growth Outlook
- 3.5 Key Demand and Supply Indicators
- 3.6 Leading Market Segments
- 3.7 Fastest-Growing Market Opportunities
- 3.8 Regional Performance Highlights
- 3.9 Technology and Industry Transformation
- 3.10 Competitive Landscape Summary
- 3.11 Analyst View and Strategic Implications
Chapter 4 U.S. Women’s Apparel Market Trends and Developments
- 4.1 Historical Industry Development, 2018-2025
- 4.2 Recent Market Trends and Developments
- 4.3 Demand and Customer Behavior Trends
- 4.4 Technology and Product Innovation
- 4.5 Artificial Intelligence, Automation and Digitalization
- 4.6 Local Manufacturing and Supply Chain Realignment
- 4.7 Industry Partnerships, Mergers and Acquisitions
- 4.8 Sustainability and Circular Economy Developments
- 4.9 Government and Private Sector Investment Trends
- 4.10 Emerging Business Models and Commercialization
- 4.11 Industry Developments and Announcements
Chapter 5 U.S. Women’s Apparel Market Production, Supply and Demand Analysis
- 5.1 Demand Trend and Consumption Analysis, 2018-2025
- 5.2 Demand Forecast, 2025-2035
- 5.3 Production and Output Trend, 2018-2025
- 5.4 Production and Output Forecast, 2025-2035
- 5.5 Installed Capacity and Capacity Utilization
- 5.6 Company-Wise Production Plants and Statistics
- 5.6.1 Installed Production Capacity
- 5.6.2 Actual Production
- 5.6.3 Planned Capacity and Expansion Targets
- 5.7 Supply Chain Structure and Procurement Trends
- 5.8 Supply-Demand Gap and Bottlenecks
- 5.9 Import Dependence and Sourcing Structure
- 5.10 Contract Manufacturing and Outsourcing
- 5.11 Regional Supply and Demand Concentration
Chapter 6 U.S. Women’s Apparel Market Pricing Analysis
- 6.1 Pricing Structure and Measurement
- 6.2 Historical Pricing Trends, 2018-2025
- 6.3 Pricing Outlook, 2025-2035
- 6.4 Average Selling Price and Unit Economics
- 6.5 Pricing by Product and Market Segment
- 6.6 Geographic Pricing Differences
- 6.7 Key Input, Energy, Labor and Logistics Costs
- 6.8 Contract Pricing and Purchasing Models
- 6.9 Pricing Sensitivity and Competitive Positioning
- 6.10 Price, Margin and Profitability Implications
Chapter 7 U.S. Women’s Apparel Market Dynamics
- 7.1 Market Growth Drivers
- 7.1.1 Demand-Side Drivers
- 7.1.2 Technology and Innovation Drivers
- 7.1.3 Infrastructure and Investment Drivers
- 7.1.4 Regulatory and Policy Drivers
- 7.2 Market Restraints
- 7.2.1 Cost and Affordability Constraints
- 7.2.2 Technology and Adoption Barriers
- 7.2.3 Supply Chain and Operational Constraints
- 7.3 Market Challenges
- 7.3.1 Competitive Pressure and Margin Erosion
- 7.3.2 Skills, Infrastructure and Implementation Gaps
- 7.4 Emerging Market Opportunities
- 7.5 Market Dynamics Impact and Time-Horizon Assessment
Chapter 8 U.S. Women’s Apparel Value Chain Analysis
- 8.1 Industry Value Chain Overview
- 8.2 Upstream Suppliers and Critical Inputs
- 8.3 Technology and Component Providers
- 8.4 Manufacturing or Service Delivery
- 8.5 Distribution, Channel Partners and Integrators
- 8.6 Downstream Applications and End Users
- 8.7 Value Addition and Profit Pools
- 8.8 Vertical Integration and Outsourcing
- 8.9 Supplier Concentration and Risk
- 8.10 Supply Chain Localization and Resilience
Chapter 9 U.S. Women’s Apparel Market Regulations and Policies
- 9.1 Relevant Laws, Standards and Compliance Frameworks
- 9.2 Product, Service, Safety and Quality Requirements
- 9.3 Government Policies, Incentives and Subsidies
- 9.4 Imports, Exports and Trade Barriers
- 9.5 Public Procurement and Local Content Requirements
- 9.6 Environmental and Sustainability Compliance
- 9.7 Upcoming Policy Changes and Market Implications
Chapter 10 U.S. Women’s Apparel Market Hotspots and Opportunities
- 10.1 Market Opportunity Mapping and Growth Hotspots
- 10.2 High-Growth Applications and Customer Groups
- 10.3 Underserved Markets and White-Space Opportunities
- 10.4 Emerging Technology and Product Opportunities
- 10.5 New Capacity and Investment Hotspots
- 10.6 Market Entry and Expansion Opportunities
- 10.7 Distribution and Partnership Opportunities
- 10.8 Near-Term and Long-Term Commercial Potential
- 10.9 Opportunity Attractiveness and Execution Risks
Chapter 11 U.S. Women’s Apparel Market Outlook, 2025-2035
- 11.1 Market Size and Analysis
- 11.1.1 Revenue (Market Measurement: 2025: USD 255.00 billion → 2035: USD 352.81 billion)
- 11.1.2 Market Volume and Quantity Sold
- 11.1.3 Historical Market Size, 2018-2025
- 11.1.4 Base-Year Market Size, 2025
- 11.2 Market Forecast, 2025-2035
- 11.2.1 Revenue Forecast to 2035
- 11.2.2 Volume Forecast to 2035
- 11.2.3 CAGR and Year-on-Year Growth
- 11.2.4 Incremental Revenue Opportunity
- 11.3 Forecast Assumptions and Scenario Analysis
- 11.3.1 Base-Case Forecast
- 11.3.2 Optimistic and Conservative Scenarios
- 11.3.3 Technology, Pricing and Policy Sensitivities
- 11.4 Market Attractiveness and Growth Outlook
Chapter 12 U.S. Women’s Apparel Market Segmentation and Outlook
- 12.1 Segmentation Summary and Market Shares, 2025
- 12.2 Largest and Fastest-Growing Segments
- 12.3 By Type - Market Size and Forecast, 2025-2035
- 12.3.1 Segment Definition and Scope
- 12.3.2 Historical Market Size, 2018-2025
- 12.3.3 Revenue Forecast, 2025-2035
- 12.3.4 Volume Forecast, 2025-2035
- 12.3.5 Base-Year Market Share, 2025
- 12.3.6 Segment CAGR and Growth Drivers
- 12.3.7 Subsegment Market Size and Forecast
- 12.3.7.1 Casual Wear
- 12.3.7.2 Sportswear
- 12.3.7.3 Formal Wear
- 12.3.7.4 Inner Wear
- 12.3.7.5 Night Wear
- 12.3.8 Subsegment Pricing and Adoption Trends
- 12.3.9 Leading Suppliers and Competition
- 12.3.10 Regional Demand and Opportunities
- 12.4 By Price Range - Market Size and Forecast, 2025-2035
- 12.4.1 Segment Definition and Scope
- 12.4.2 Historical Market Size, 2018-2025
- 12.4.3 Revenue Forecast, 2025-2035
- 12.4.4 Volume Forecast, 2025-2035
- 12.4.5 Base-Year Market Share, 2025
- 12.4.6 Segment CAGR and Growth Drivers
- 12.4.7 Subsegment Market Size and Forecast
- 12.4.7.1 Mass
- 12.4.7.2 Premium
- 12.4.7.3 Luxury
- 12.4.8 Subsegment Pricing and Adoption Trends
- 12.4.9 Leading Suppliers and Competition
- 12.4.10 Regional Demand and Opportunities
- 12.5 By Age Group - Market Size and Forecast, 2025-2035
- 12.5.1 Segment Definition and Scope
- 12.5.2 Historical Market Size, 2018-2025
- 12.5.3 Revenue Forecast, 2025-2035
- 12.5.4 Volume Forecast, 2025-2035
- 12.5.5 Base-Year Market Share, 2025
- 12.5.6 Segment CAGR and Growth Drivers
- 12.5.7 Subsegment Market Size and Forecast
- 12.5.7.1 5-16 Years
- 12.5.7.2 16-45 Years
- 12.5.7.3 45-70 Years
- 12.5.7.4 70 and Above
- 12.5.8 Subsegment Pricing and Adoption Trends
- 12.5.9 Leading Suppliers and Competition
- 12.5.10 Regional Demand and Opportunities
- 12.6 Segment Growth Comparison
- 12.7 Segment Attractiveness and Priority Matrix
Chapter 13 U.S. Women’s Apparel Geographic Market Outlook, 2025-2035
- 13.1 Domestic Market Distribution and Demand Clusters
- 13.2 State- or Province-Wise Market Size and Forecast, 2025-2035
- 13.3 City and Metropolitan Market Outlook
- 13.4 Industrial, Manufacturing and Commercial Clusters
- 13.5 Geographic Concentration of Key End Users
- 13.6 Local Pricing and Purchasing Differences
- 13.7 Domestic Production Facilities and Capacity Map
- 13.8 Local Infrastructure and Project Pipeline
- 13.9 State-Level Policy and Incentive Differences
- 13.10 Subnational Investment Hotspots and Opportunities
- 13.11 Distribution and Logistics Networks
- 13.12 Domestic Competitive Footprint
Chapter 14 U.S. Women’s Apparel Technology, Innovation and Sustainability Outlook
- 14.1 Technology Landscape and Maturity
- 14.2 Product, Process and Service Innovation
- 14.3 AI, Automation and Digital Tools in the Industry
- 14.4 Technology Adoption and Performance Benchmarking
- 14.5 Innovation Pipeline and R&D Investment
- 14.6 Patent and Intellectual Property Trends
- 14.7 Energy Efficiency and Resource Management
- 14.8 Sustainability, Recycling and Circularity
- 14.9 Technology Roadmap, 2025-2035
- 14.10 Risks of Obsolescence and Technology Substitution
Chapter 15 U.S. Women’s Apparel Market Key Strategic Imperatives
- 15.1 Growth and Market Entry Priorities
- 15.2 High-Return Products and Segments
- 15.3 Pricing, Profitability and Cost Optimization
- 15.4 Technology Investment and Product Differentiation
- 15.5 Supply Chain Localization and Resilience
- 15.6 Distribution and Customer Acquisition
- 15.7 Partnership, Acquisition and Capacity Strategy
- 15.8 Regional Expansion Priorities
- 15.9 Short-, Medium- and Long-Term Actions
Chapter 16 Competition Outlook
- 16.1 Industry Competition Characteristics
- 16.2 Market Structure and Concentration
- 16.3 Market Share and Competitive Positioning, 2025
- 16.4 Company-Wise Revenue and Product Benchmarking
- 16.5 Production and Service Capacity Benchmarking
- 16.6 Technology, Pricing and Differentiation
- 16.7 Regional Footprint and Distribution Strength
- 16.8 Mergers, Acquisitions and Strategic Alliances
- 16.9 New Entrants and Competitive Threats
- 16.10 Porter's Five Forces and Industry Attractiveness
- 16.11 Competitive Outlook, 2025-2035
Chapter 17 Company Profiles
- 17.1 Company Coverage and Selection Criteria
- 17.2 Amazon
- 17.2.1 Business Description
- 17.2.2 Company Ownership and Geographic Presence
- 17.2.3 Product and Service Portfolio
- 17.2.4 Manufacturing and Operating Footprint
- 17.2.5 Production Capacity and Expansion Plans
- 17.2.6 Financial Performance and Investment
- 17.2.7 Market Share and Competitive Position
- 17.2.8 Technology and Innovation Capabilities
- 17.2.9 Strategic Alliances or Partnerships
- 17.2.10 Recent Developments
- 17.2.11 Growth Strategy and Outlook
- 17.3 Walmart
- 17.4 The TJX Companies
- 17.5 Gap Inc.
- 17.6 Nike
- 17.7 Lululemon
- 17.8 Victoria’s Secret & Co.
- 17.9 Macy’s
- 17.10 Shein
- 17.11 Saks Global
- 17.12 Other Relevant Market Participants
Note: Every listed company is profiled on the structure shown under the first company. The company list is preliminary and may change based on research findings, market developments, data availability and client requirements.
Chapter 18 Disclaimer
- 18.1 Research and Forecast Disclaimer
- 18.2 Data Source and Estimation Limitations
Note: The depth of individual sections depends on data availability for this market. Volume, capacity, trade and other unit-based metrics are included where applicable.