Floodlit city boxes turn short games into paid slots
The India box cricket turf market was valued at USD 357.1 million in 2025 and is projected to increase from USD 400.0 million in 2026 to USD 1.11 billion by 2035, registering a CAGR of 12.00% during 2026–2035. Demand comes from office workers, students and friend groups who book floodlit boxes for short evening games, along with companies that hire venues for leagues and team events. South India held the largest regional share, 34.0% in 2025, because Kerala, Tamil Nadu, Karnataka and Telangana combine dense football and cricket turf networks with heavy app use. Northeast India is the fastest-growing region at 13.17% a year, from a small base as gateway cities add their first venues. Box cricket remains the anchor sport, while operators add futsal and pickleball courts to fill quiet hours. The main commercial change is formal regulation, as civic bodies in Mumbai and Ahmedabad move turfs onto licensing rules and app-based registration.
Which turf bookings and venue income are counted here?
The market counts revenue that commercial and public pay-and-play venues earn from enclosed box cricket, 5-a-side football and multi-sport turfs in India. It covers hourly slot rentals sold at the counter or through booking apps, league and tournament fees, and food and beverage sales made at the venue during games.
The scope excludes the sale and installation of artificial grass, stadium cricket, coaching academy fees and equipment retail. Booking platforms are counted through the slot value they sell, not their own commissions, so revenue is measured once at the venue level.
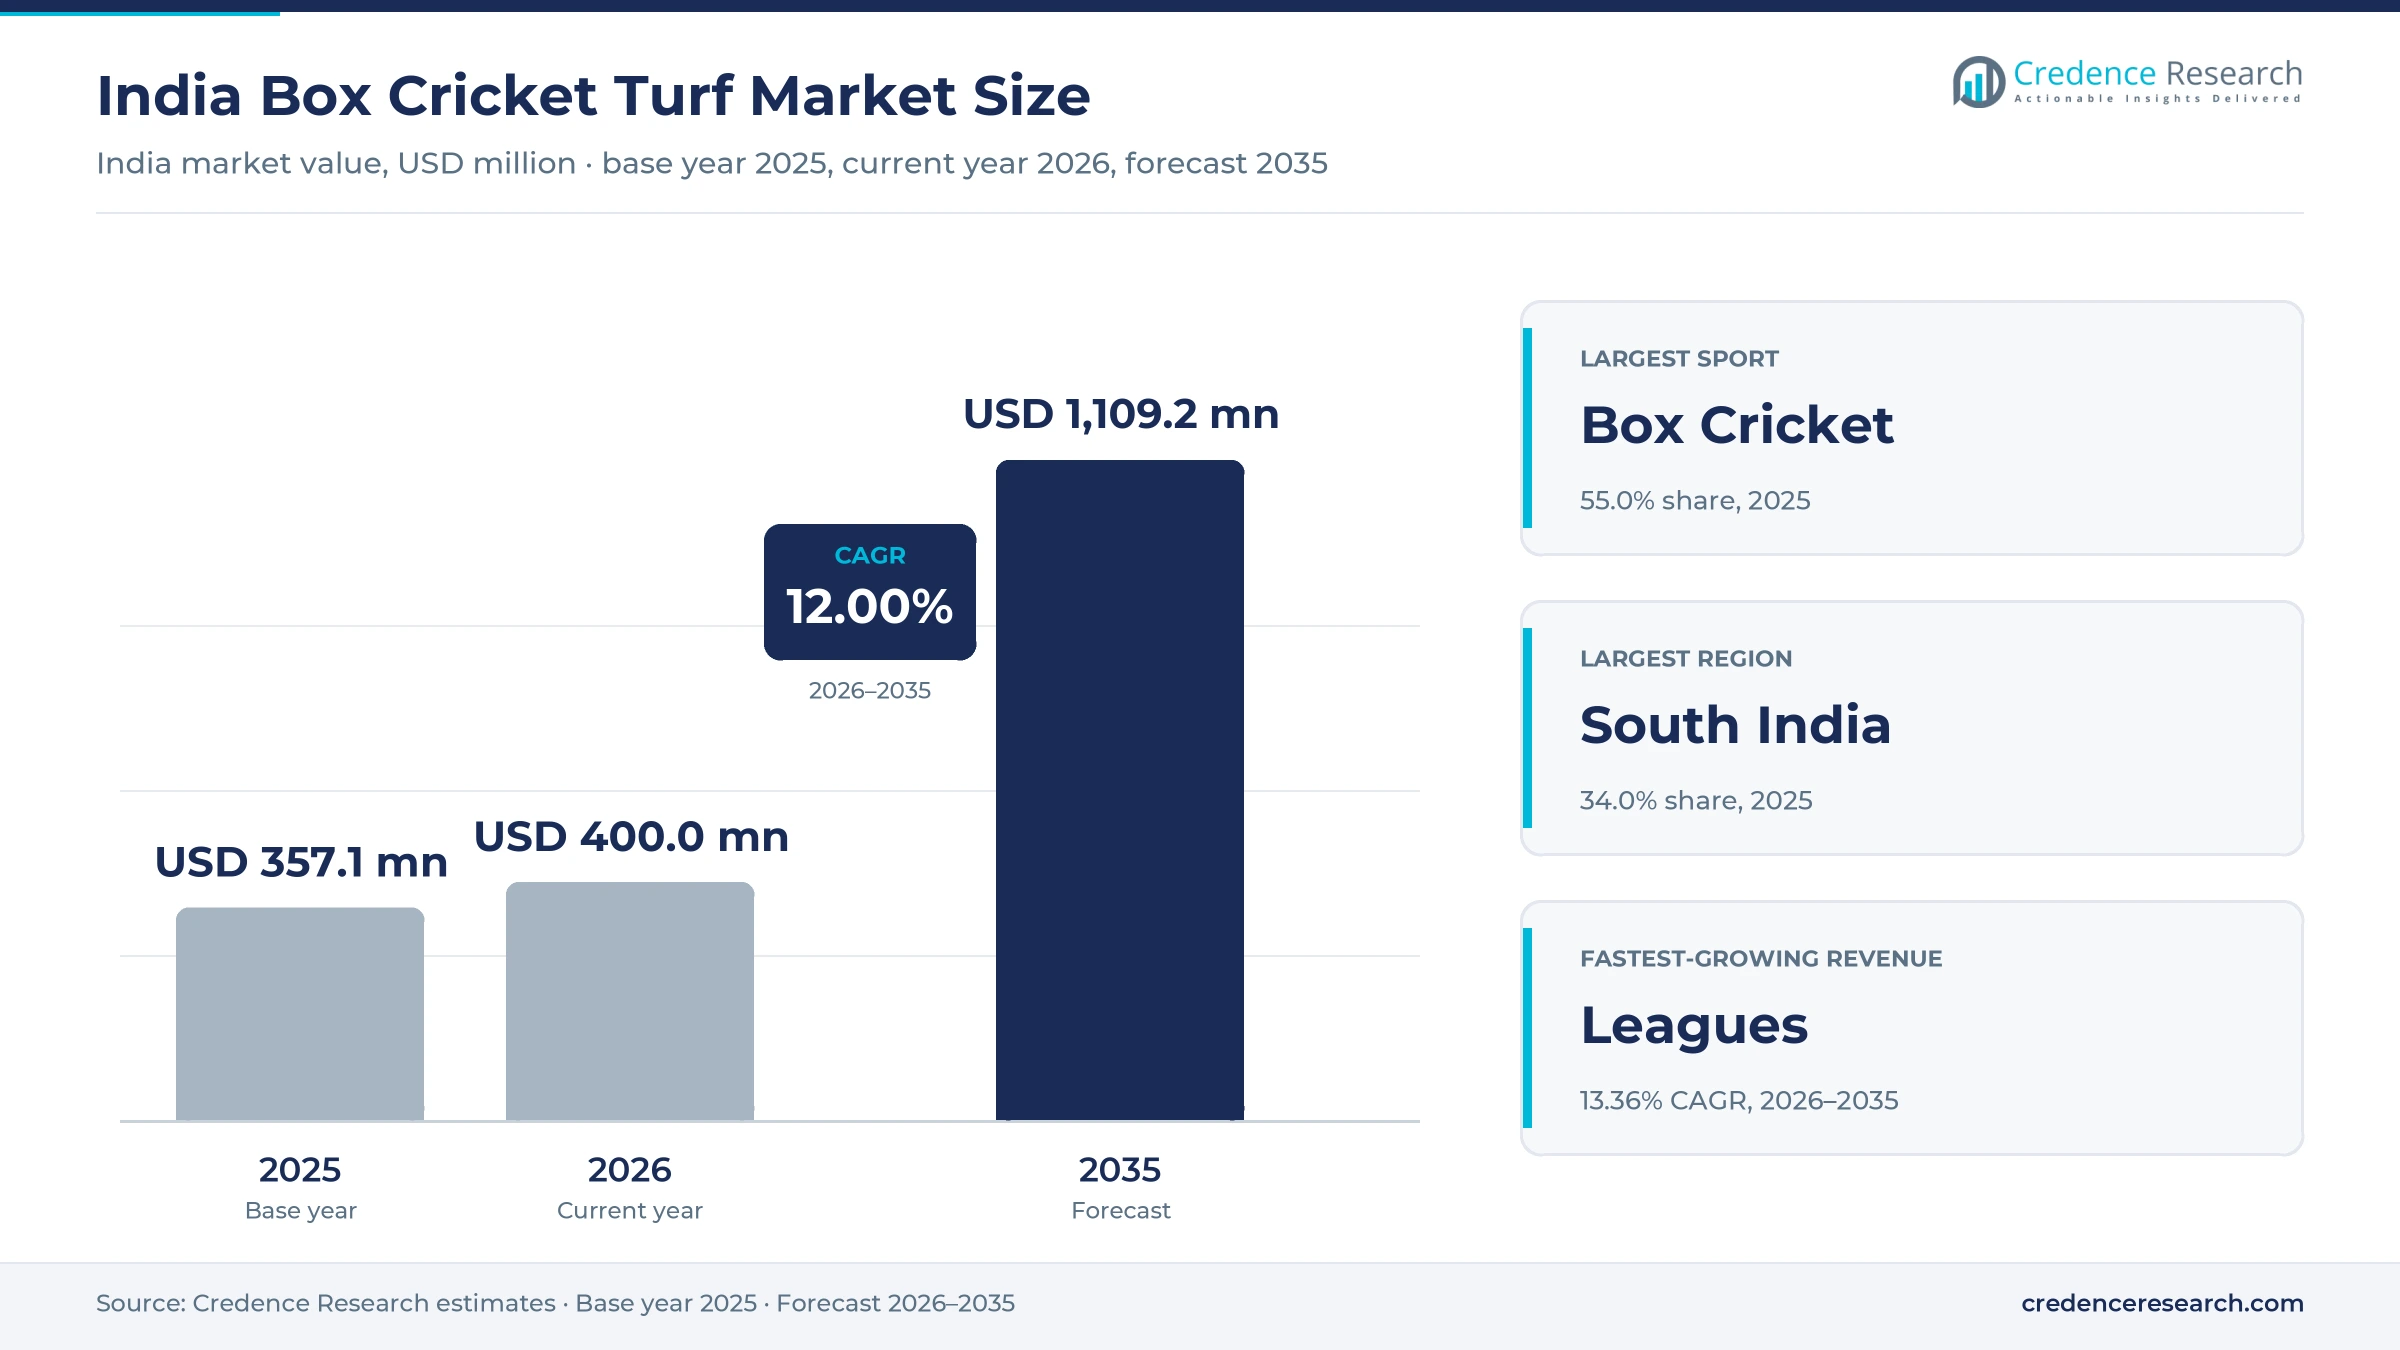
India Box Cricket Turf Market Insights
- The market grows from USD 357.1 million in 2025 to USD 1.11 billion by 2035 at a 12.00% CAGR, as Playo bookings rose 87.5% between the first eight months of 2024 and 2026.
- South India held 34.0% of 2025 value, because Kerala alone passed 1,000 turfs by November 2024 and Tamil Nadu is adding 38 public turfs.
- Box cricket led the sport split with 55.0% in 2025, as cricket turf searches on Justdial rose 69% in the year to April 2024.
- The Brihanmumbai Municipal Corporation passed a smart turf resolution on Aug. 21, 2026, covering more than 1,500 private turfs in Mumbai.
- Hudle raised USD 2.5 million in July 2025 to expand a network of more than 2,000 venues in 60 cities.
Box cricket, open plots and hourly slots lead revenue
Why does box cricket earn the largest share of turf revenue?
Based on sport, the market is categorized into box cricket, 5-a-side football and multi-sport. Box Cricket led with 55.0% of 2025 value because cricket is the most searched turf category, and Justdial reported in July 2024 that cricket turf searches rose 69% against 26% for football turfs. Five-a-side football holds a strong second place in Kerala, where Dhanam Online counted more than 1,000 turfs in November 2024. Multi-Sport grows fastest at 13.24% a year as operators add courts beside cricket boxes, and Hudle said in July 2025 that it adds more than 300 pickleball courts every month.
How do open plots, rooftops and malls compare?
Based on location, the market is categorized into rooftops, open plots and malls. Open Plots led with 63.0% of 2025 value because peri-urban land still offers the largest pitches, although ThePrint reported in October 2026 that Gurugram landowners now charge Rs 1 lakh to Rs 1.5 lakh per acre a month. Retail sites add footfall-led venues, and Decathlon India runs 76 leased playgrounds at its stores. Rooftops grow fastest at 12.78% a year as owners use idle roofs in dense districts, with Big Bash Rooftop Box Cricket in Hyderabad's Balanagar industrial estate listed on Playo as open 24 hours.
Why do hourly bookings dominate venue income?
Based on revenue, the market is categorized into hourly bookings, leagues and F&B. Hourly Bookings led with 74.0% of 2025 value because most groups rent slots by the hour, at Rs 1,200 to Rs 2,000 at Gurugram venues and Rs 700 at the civic hub in Ahmedabad. F&B adds spend at sites with lounges and refreshment counters during evening games. Leagues grow fastest at 13.36% a year as companies book tournaments, and the iKeva Box Bash League in Hyderabad fielded 32 teams from 27 companies, Deccan Chronicle reported in July 2025.
| Segment Group | Leading Sub-segment | Share, 2025 | Fastest-growing Sub-segment | CAGR, 2026–2035 |
|---|---|---|---|---|
| By Sport | Box Cricket | 55.0% | Multi-Sport | 13.24% |
| By Location | Open Plots | 63.0% | Rooftops | 12.78% |
| By Revenue | Hourly Bookings | 74.0% | Leagues | 13.36% |
Request a Free Sample
Fill in your details and we'll send you a free sample report.
- Sample data tables & charts
- Research methodology
City players, idle land and office leagues fill slots
Urban recreational play lifts box cricket bookings
Recreational play in cities is the main source of demand, because working adults and students want short, floodlit games close to home. Playo bookings rose from 4.62 lakh in January to August 2024 to 8.66 lakh in the same months of 2026, an 87.5% increase reported by ThePrint in October 2026. The MoSPI Time Use Survey 2024 found that 95.8% of urban residents aged six and above took part in culture, leisure and sports activities, spending 183 minutes a day on them. Justdial reported in July 2024 that turf searches rose 57% nationally and 78% in non-metro cities. In the Credence Research model this adds about 4.4 percentage points to annual growth to 2035.
Operators turn idle rooftops and small plots into income
Owners of underused roofs and small plots build boxes because a venue needs little land and can pay back within a year. ThePrint reported that a box cricket turf costs Rs 15 lakh to Rs 50 lakh to build, and The Box Cage invested about Rs 50 lakh in Noida in 2024 and broke even within a year. Builder Black Stallion Sports and Infra has put up about 300 box cricket turfs across India since 2020, according to the same report. Civic land is also being used, as Ahmedabad Municipal Corporation opened a Rs 3.5 crore multi-sport hub under the Hebatpur railway overbridge in January 2025, Knocksense reported. In the Credence Research model this adds about 3.2 percentage points to annual growth to 2035.
Corporate leagues and tournaments fill weekday slots
Corporate leagues raise occupancy because companies book several hours at once, often on weekday evenings that walk-in players leave empty. The iKeva Box Bash League in Hyderabad ran 31 six-over matches among 32 teams from 27 companies, Deccan Chronicle reported in July 2025. Euronics said in April 2026 that more than 200 companies played its corporate cricket league across Hyderabad, Bengaluru, Delhi NCR and Mumbai, with 48 teams in Delhi NCR alone. In Gurugram, Urban Sports Adda hosted more than 20 corporate events within a year, and Fluxon Sports prices corporate packages at Rs 2,000 per person, ThePrint reported. In the Credence Research model this adds about 2.4 percentage points to annual growth to 2035.
Booking apps widen the reach of small turf owners
Booking platforms let single-site owners sell slots to players they could not reach through walk-ins or word of mouth. Playo listed more than 5,000 partner venues in over 100 cities when it began selling prepaid credits on Amazon in October 2025, according to a PR Newswire release. Hudle raised USD 2.5 million in July 2025 and serves more than 2,000 venues in 60 cities. Decathlon India put 36 of its playgrounds on Playo in December 2025, with slots open up to 20 days ahead. Eternal's District also planned a Play feature for court bookings in Delhi NCR, Mumbai and Bengaluru, Mint reported in November 2025. As a result, hourly bookings remain the core income, holding 74.0% of 2025 value.
Multi-sport courts and civic licensing reshape venues
Rise of multi-sport boxes with pickleball courts
Operators are shifting from single cricket boxes to multi-sport sites, because a pickleball or futsal court earns from groups that do not play cricket. Hudle said in July 2025 that it was adding more than 300 pickleball courts every month to its network. ThePrint counted nearly 150 pickleball venues in Delhi NCR in July 2025, with rooftop sites such as PickleJoy in Lajpat Nagar renting courts at about Rs 1,100 an hour. Public venues follow the same mix, as the AMC sports center at Ranip was set to open on Dec. 5, 2025, with box cricket at Rs 700 an hour and pickleball at Rs 500, DeshGujarat reported. Multi-sport venues therefore grow fastest at 13.24% a year in the Credence Research model.
Shift toward licensed and app-registered venues
Cities are moving turfs from informal setups to licensed venues, which raises fixed costs but gives operators clearer rights to trade. The Brihanmumbai Municipal Corporation passed a smart turf resolution on Aug. 21, 2026, covering more than 1,500 private turfs, with registration and payments through the Khelo Mumbai app and a ban on rubber crumb infill. Ahmedabad Municipal Corporation drafted rules in July 2025 that require plots above 500 square meters, half the area for parking and a license fee of Rs 100 per square meter. In Kerala, turfs are now licensed like auditoriums, Dhanam Online reported in November 2024. Licensed sites can then sign corporate and school contracts with less risk.
Public pay-and-play turfs open operating contracts
Public turf programs create an opening for private operators that can run sites under maintenance contracts. The Sports Development Authority of Tamil Nadu said in June 2025 that it would build 38 futsal and box cricket turfs at Rs 60 lakh each, charging Rs 800 to Rs 1,000 an hour against about Rs 1,500 at private venues. Ahmedabad's Ranip center is run under an annual operation and maintenance contract of Rs 2,11,111 plus 18% GST, DeshGujarat reported in November 2025. At national level, the Union Cabinet approved a Rs 36,441 crore outlay for Khelo India and national sports federations for 2026-27 to 2030-31, according to News On AIR. Operators with booking systems and staff can bid for these sites.
Tier-2 and tier-3 towns offer room for new boxes
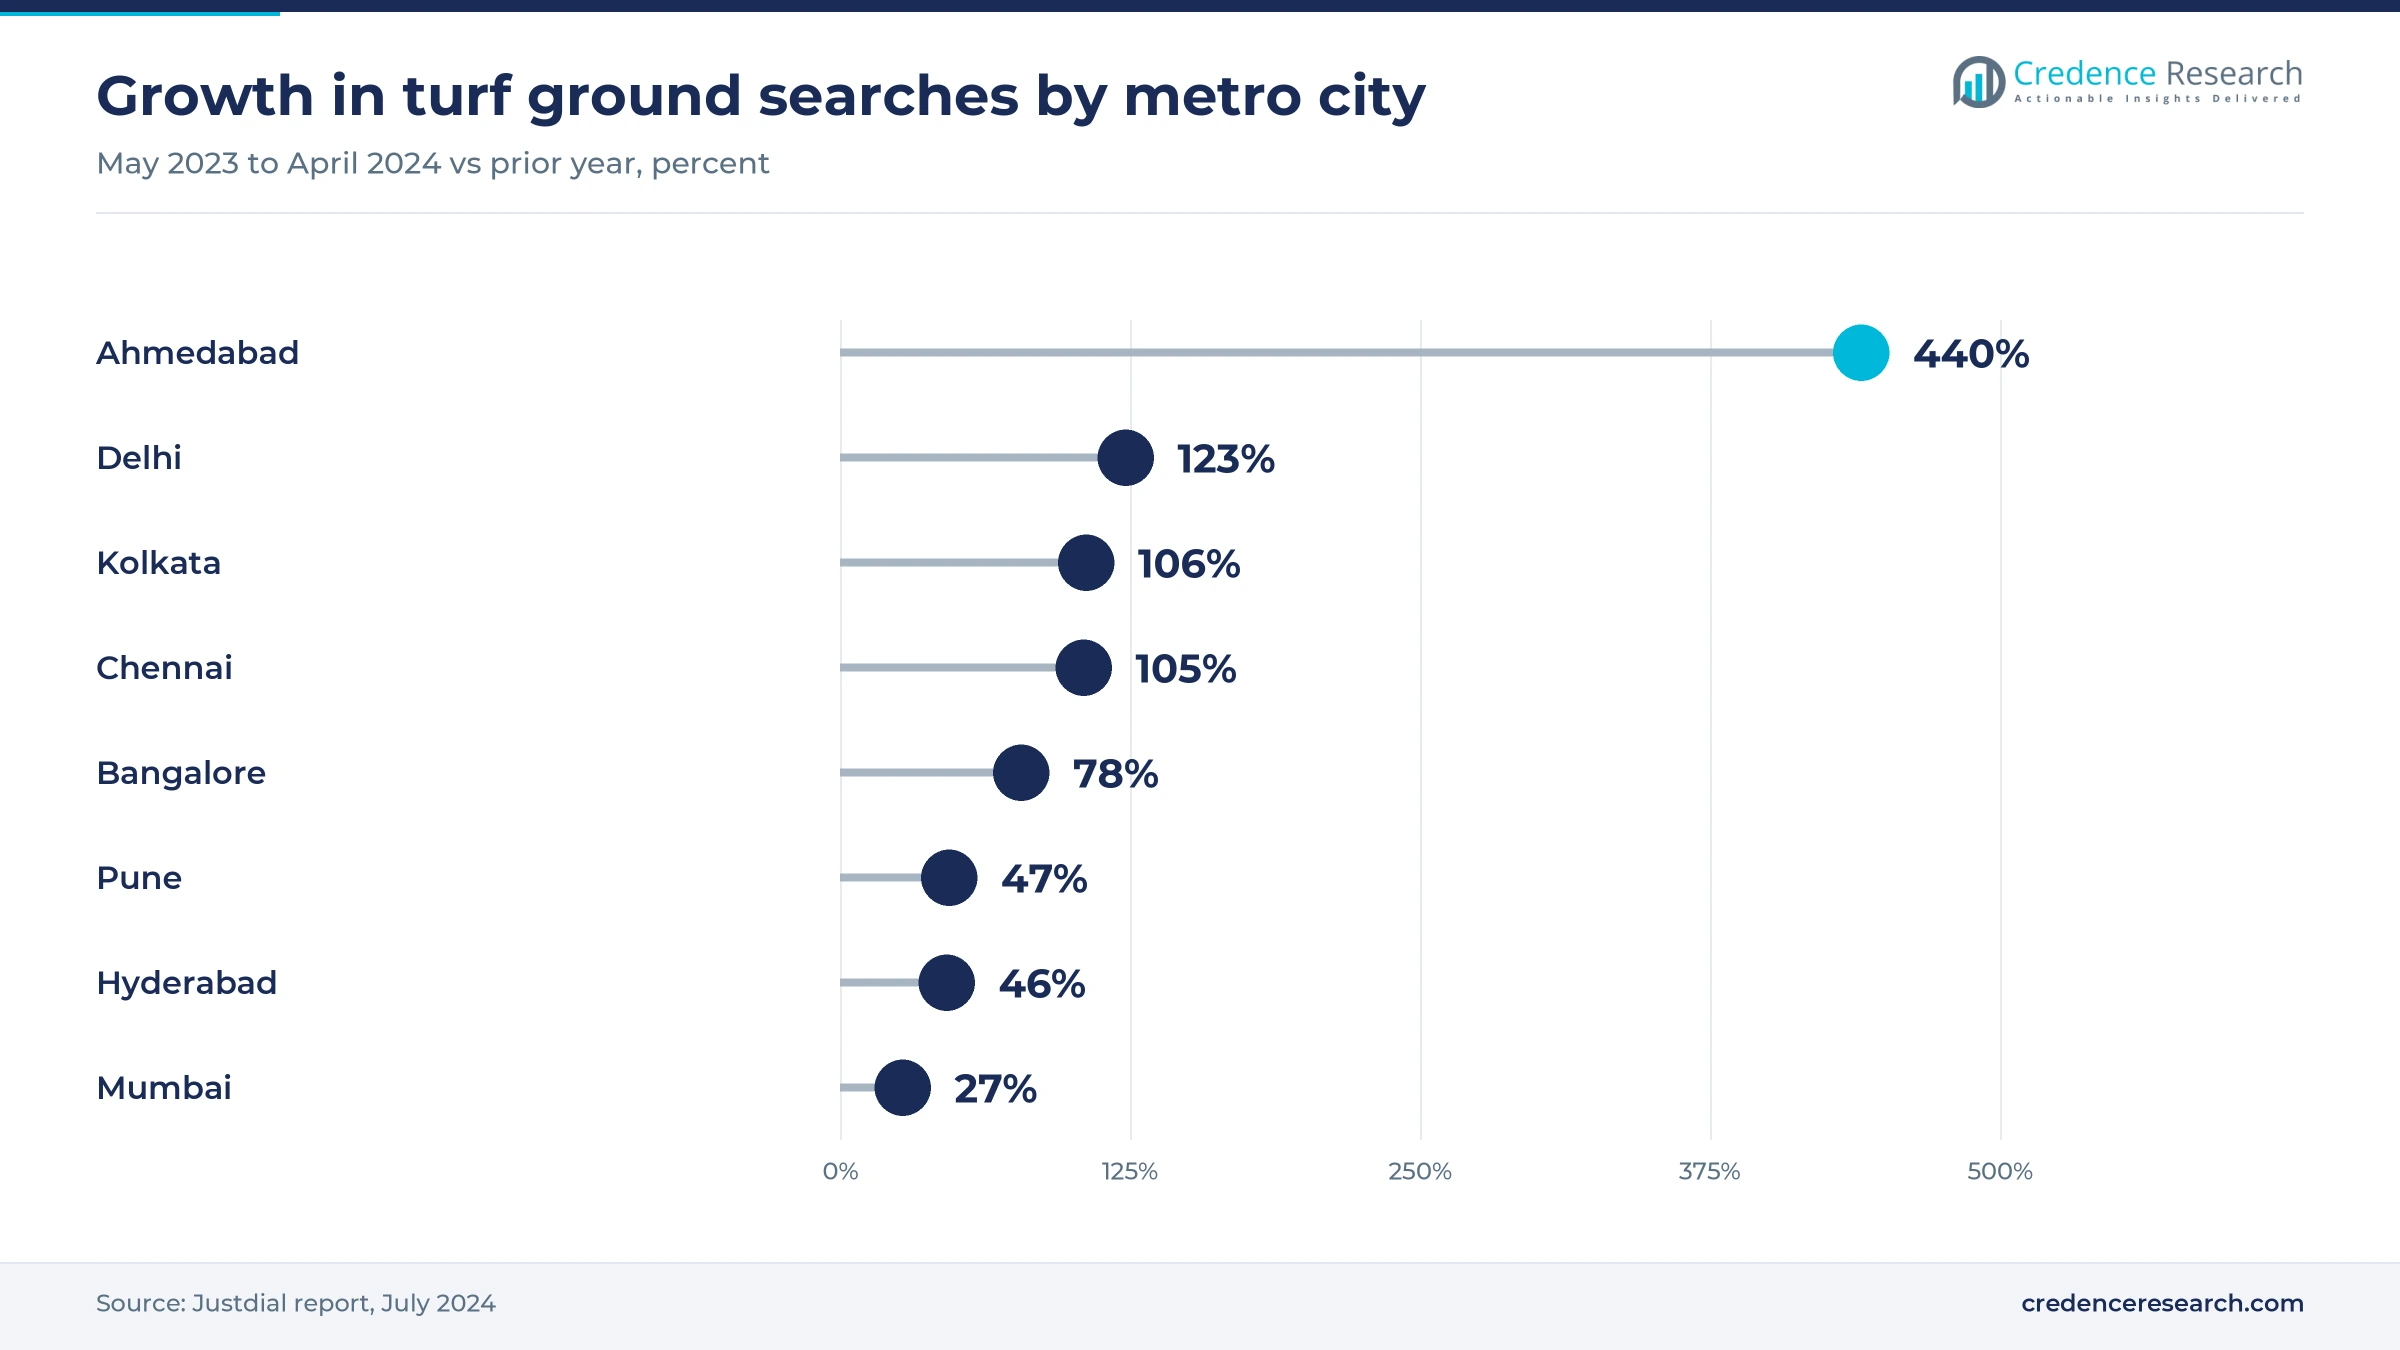
Smaller cities offer the clearest opening for new venues, because search demand is rising faster there than in metros with dense supply. Justdial reported in July 2024 that turf searches rose 1,775% in Vadodara, 958% in Rajkot and 923% in Bhopal, against 27% in Mumbai. In Mirzapur, Uttar Pradesh, the district's first cricket box was built for about Rs 20 lakh to Rs 25 lakh with a Rs 5 lakh CM YUVA loan, YourStory reported in March 2026. Playo's network already covers more than 100 cities, which gives new owners a booking channel from launch. In turn, Northeast, Central and East India grow faster than the national rate in the Credence Research model.
Sealing drives, rents and price cuts test operators
Safety sealing drives raise compliance costs
Unapproved structures expose operators to sudden closure, which wipes out booking income during peak months. Surat Municipal Corporation sealed 18 box cricket venues between July 1 and Aug. 1, 2025, after a shed collapsed at The Dot Ball Box in Katargam and injured one person, DeshGujarat reported. Many of these sites lacked civic fire and customer safety approvals. Owners now need structural engineers, fire clearances and stronger frames, which raises setup budgets before the first booking.
Land lease costs squeeze margins near big cities
Land is the largest running cost for open-plot venues, and rents near growth corridors have climbed sharply. ThePrint reported in October 2026 that Gurugram landowners charge Rs 1 lakh to Rs 1.5 lakh per acre a month, and up to Rs 3 lakh near main roads, against a few thousand rupees a decade earlier. Dhanam Online called land the biggest hurdle for new Kerala entrepreneurs. Higher rents force operators to raise hourly rates or move to rooftops, which limits growth in price-sensitive towns.
Oversupply pushes hourly rates down in Kerala
Rapid building has created more slots than players in some cities, which pushes owners into steep discounting. Dhanam Online reported in November 2024 that Kerala hourly rates fell from Rs 2,000 to Rs 3,000 to as low as Rs 600, as the state passed 1,000 turfs. About six turfs in Kochi closed because of falling bookings, the same report said. Weekday occupancy suffers most, so operators rely on weekend peaks and league packages to cover their fixed costs.
Noise and late-night curbs limit peak hours
Evening and late-night slots earn the most, yet neighbors and police increasingly restrict them in residential areas. Dhanam Online reported in November 2024 that Kerala police crack down on games after 11 p.m. and that noise disputes with residents persist. The Mumbai civic resolution of August 2026 also calls for norms on operating hours, noise, floodlights and traffic, plus roof nets at every site. Shorter hours cut the number of saleable slots, so operators invest in netting and push earlier bookings.
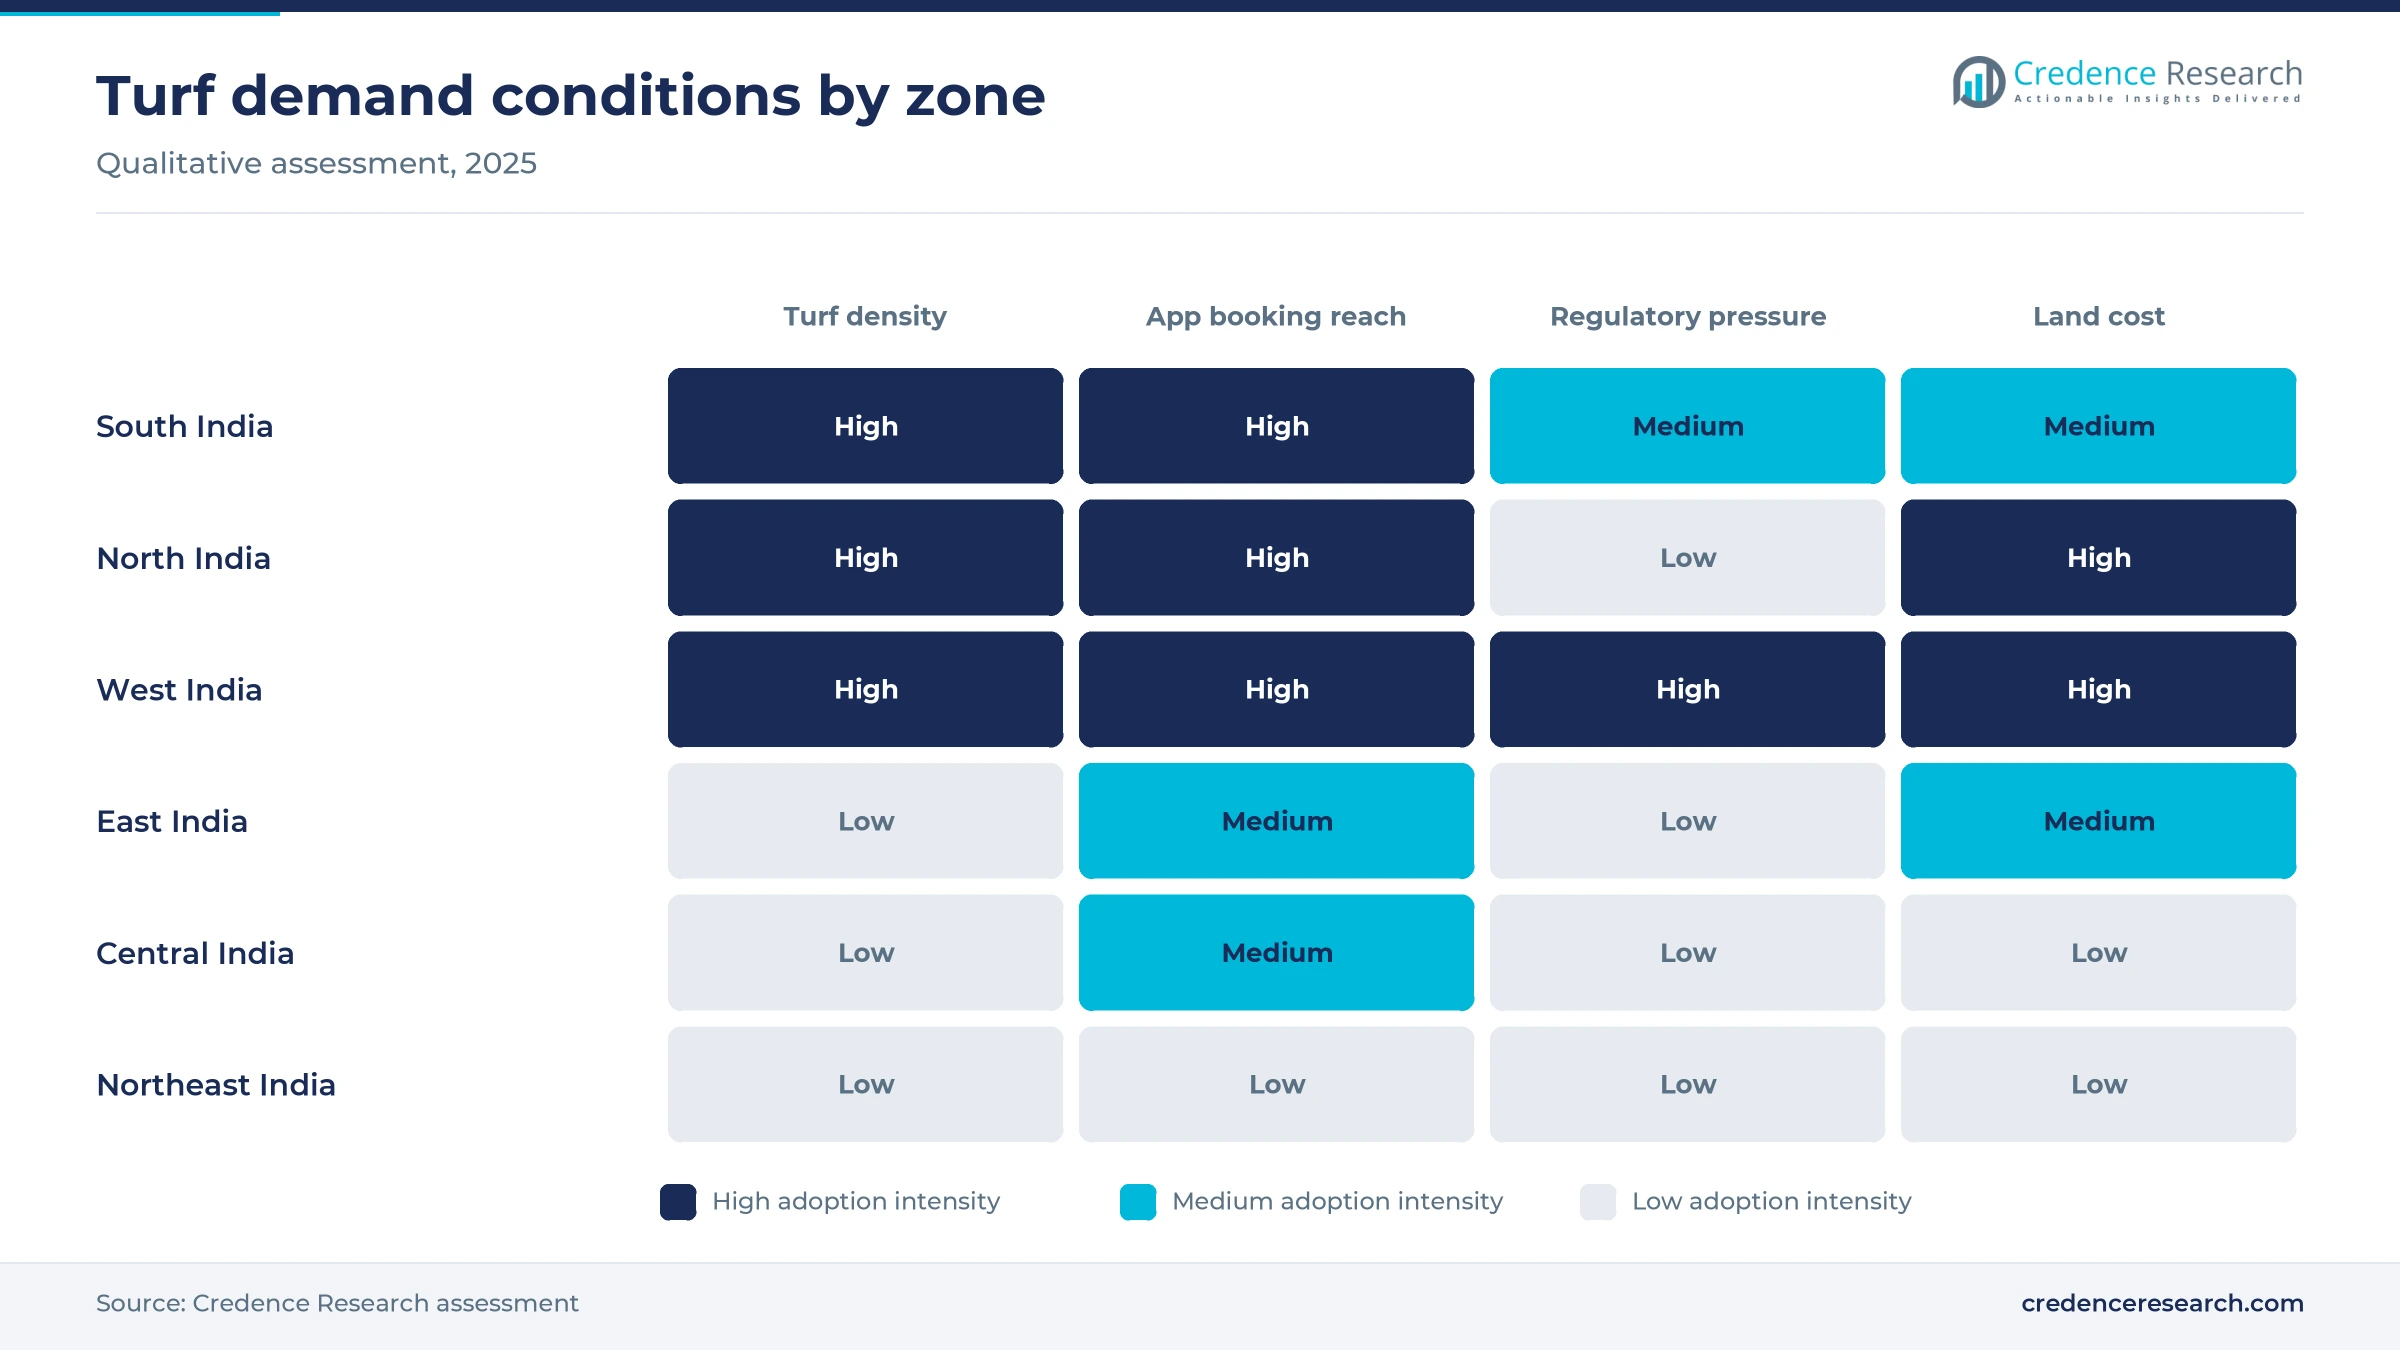
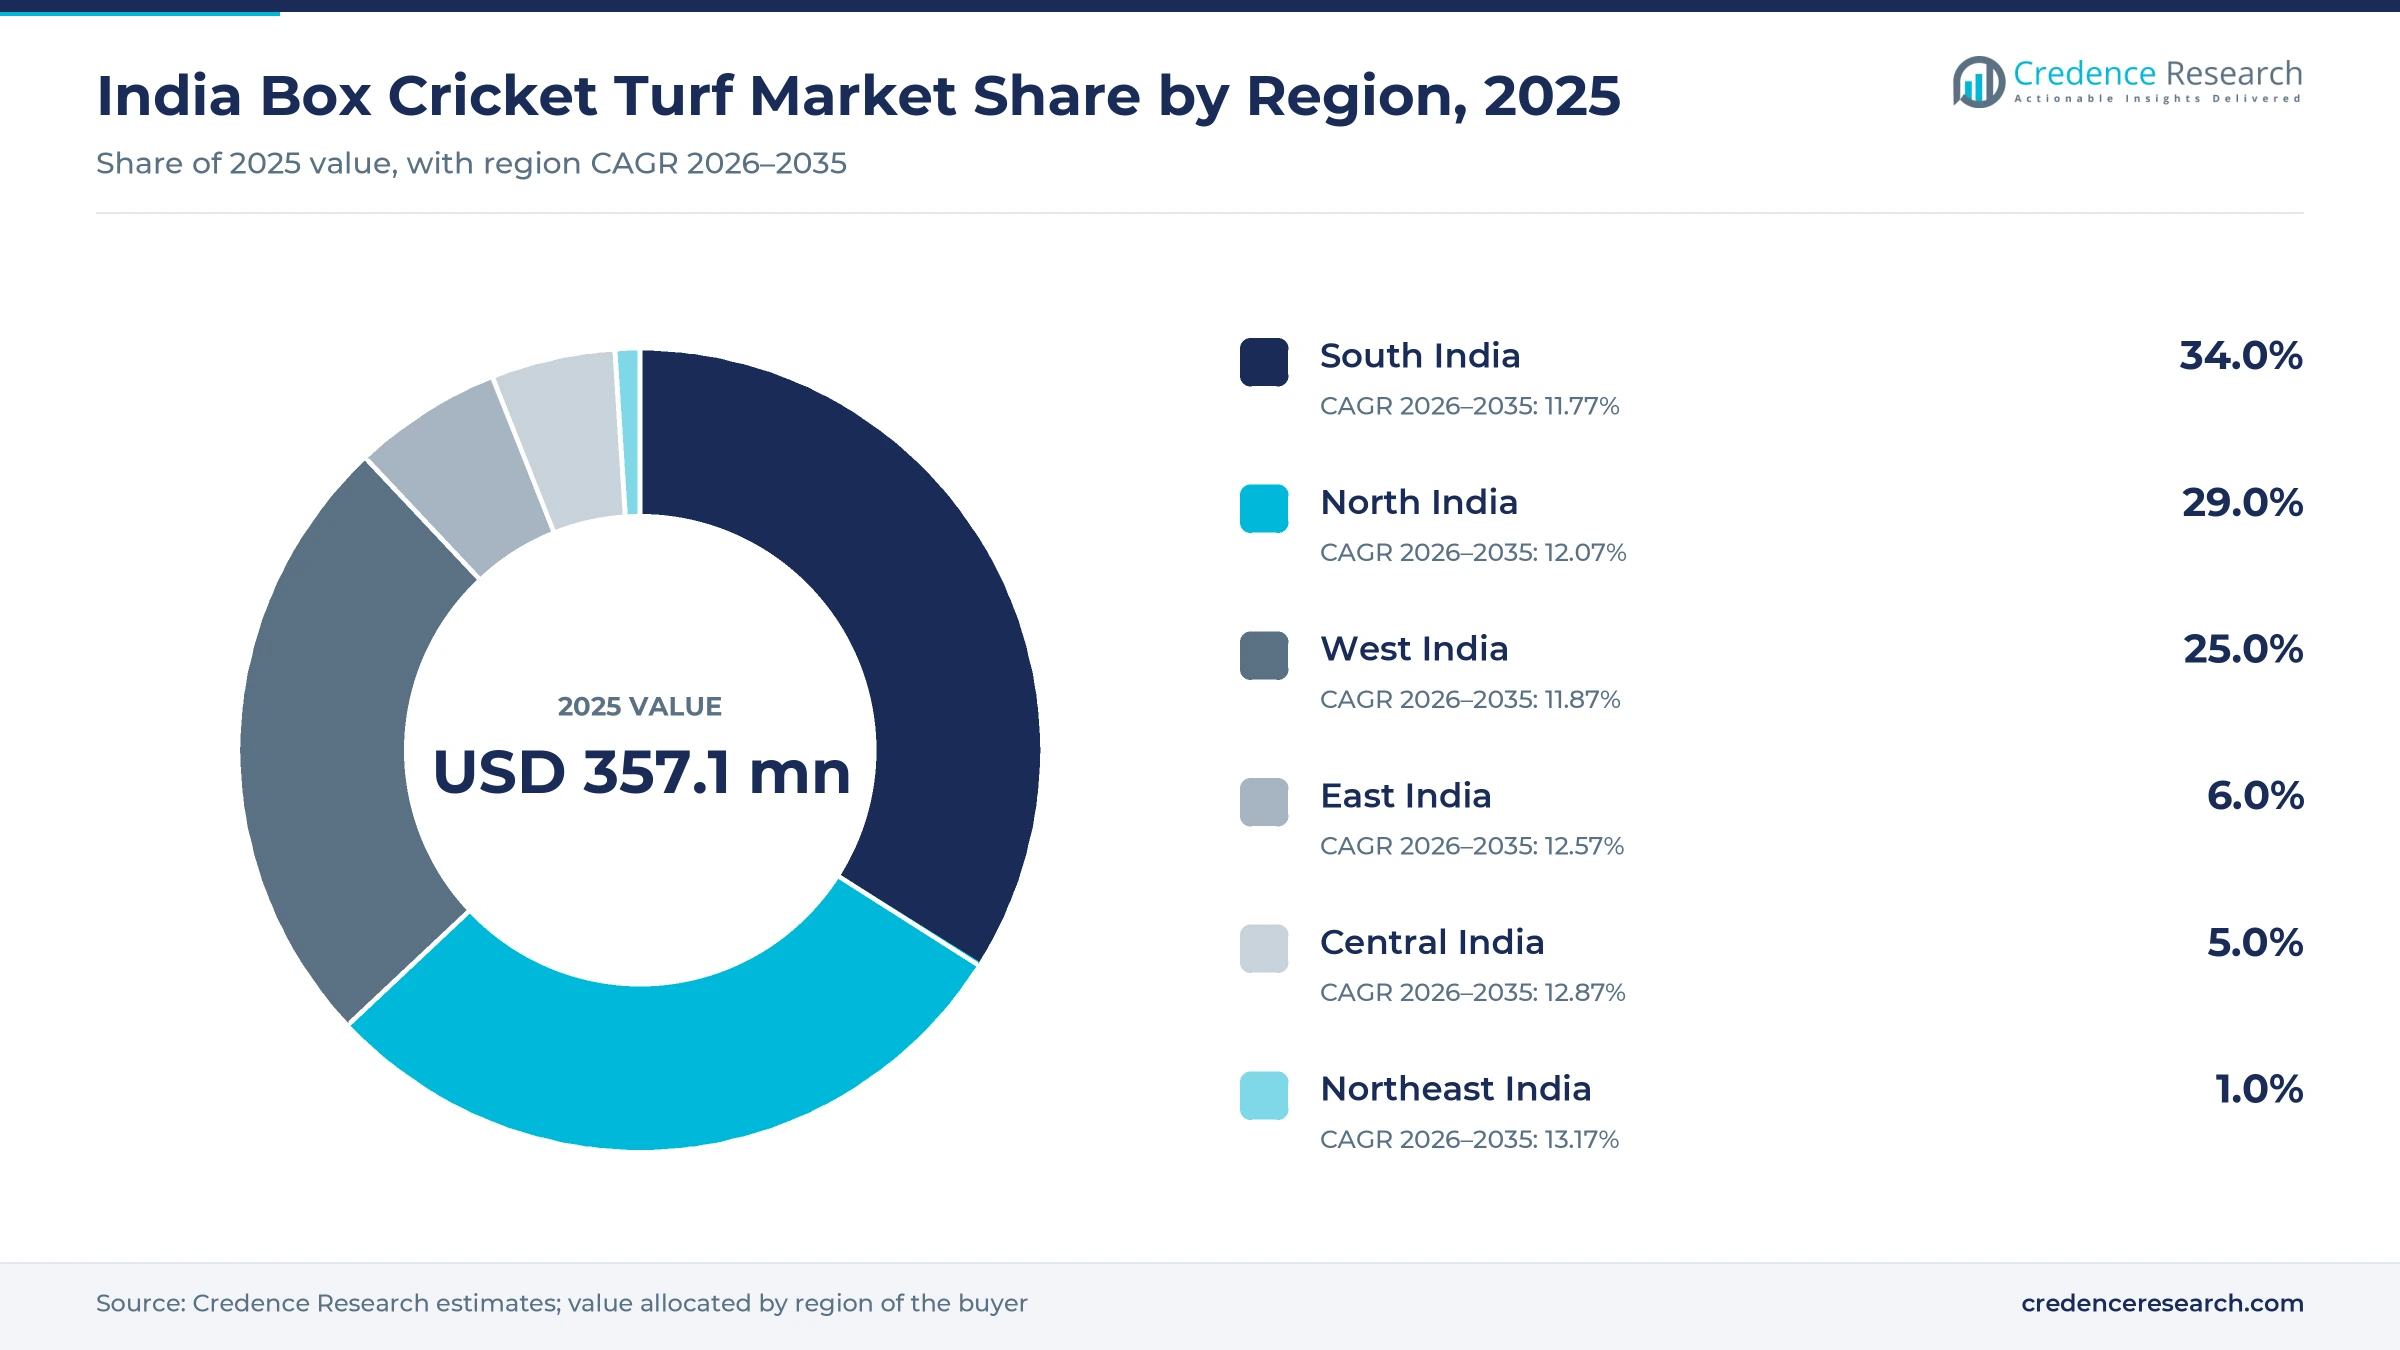
South India leads on Kerala and Tamil Nadu turf density
| Region | Value, 2025 (USD million) | Share, 2025 | CAGR, 2026–2035 |
|---|---|---|---|
| South India | 121.4 | 34.0% | 11.77% |
| North India | 103.6 | 29.0% | 12.07% |
| West India | 89.3 | 25.0% | 11.87% |
| East India | 21.4 | 6.0% | 12.57% |
| Central India | 17.9 | 5.0% | 12.87% |
| Northeast India | 3.6 | 1.0% | 13.17% |
South India leads on dense Kerala and Tamil Nadu networks
South India held 34.0% of 2025 value and grows at 11.77% a year, the largest base in the country. Kerala had more than 1,000 turfs by November 2024, with about 200 in Kozhikode, according to Dhanam Online. Tamil Nadu is adding 38 public futsal and box cricket turfs across all districts, and Hyderabad hosts corporate leagues such as the iKeva Box Bash. Justdial also recorded a 512% rise in cricket turf searches in Bangalore in the year to April 2024.
North India grows on Gurugram and Delhi demand
North India held 29.0% of 2025 value and grows at 12.07% a year. Gurugram is the busiest cluster, where ThePrint found venues charging Rs 1,200 to Rs 2,000 an hour on leased farmland in October 2026. Justdial reported a 123% rise in turf searches in Delhi in the year to April 2024. Public venues add capacity in Punjab, as Ludhiana opened a second free box cricket park built for Rs 26 lakh in October 2025, The Tribune reported.
West India grows as Mumbai and Gujarat formalize venues
West India held 25.0% of 2025 value and grows at 11.87% a year. Mumbai alone has more than 1,500 private turfs covered by the August 2026 civic resolution, the largest single city base in the zone. Search growth is fastest in Gujarat, with Justdial recording 440% in Ahmedabad and 1,775% in Vadodara. At the same time, Ahmedabad drafted licensing rules in July 2025 and Surat sealed 18 venues, so new supply is shifting toward approved sites.
East India builds from Kolkata and Bhubaneswar
East India held 6.0% of 2025 value and grows at 12.57% a year, faster than the national rate. Justdial reported that turf searches rose 106% in Kolkata in the year to April 2024, the third-highest growth among metro cities. Football turf searches doubled in Bhubaneswar over the same period, which supports 5-a-side venues in Odisha. Supply is still thin outside the state capitals, so new operators face less price competition than in Kerala or Mumbai.
Central India gains on Bhopal and Indore searches
Central India held 5.0% of 2025 value and grows at 12.87% a year, among the fastest zones. Justdial reported that turf searches rose 923% in Bhopal and 117% in Indore in the year to April 2024, showing demand ahead of supply. Most venues are open plots on city edges, where land is cheaper than in Gurugram or Mumbai. Booking apps with more than 100-city coverage help new owners in these cities fill slots from their first season.
Northeast India starts from the smallest base
Northeast India held 1.0% of 2025 value and grows at 13.17% a year, the fastest rate of any zone. Justdial reported a 166% rise in cricket turf searches in Agartala in the year to April 2024, which shows interest beyond the larger metros. The Khelo India outlay of Rs 36,441 crore for 2026-27 to 2030-31 supports wider sports facilities in states with few private venues. Growth stays small in absolute terms because the zone starts from very few commercial sites.
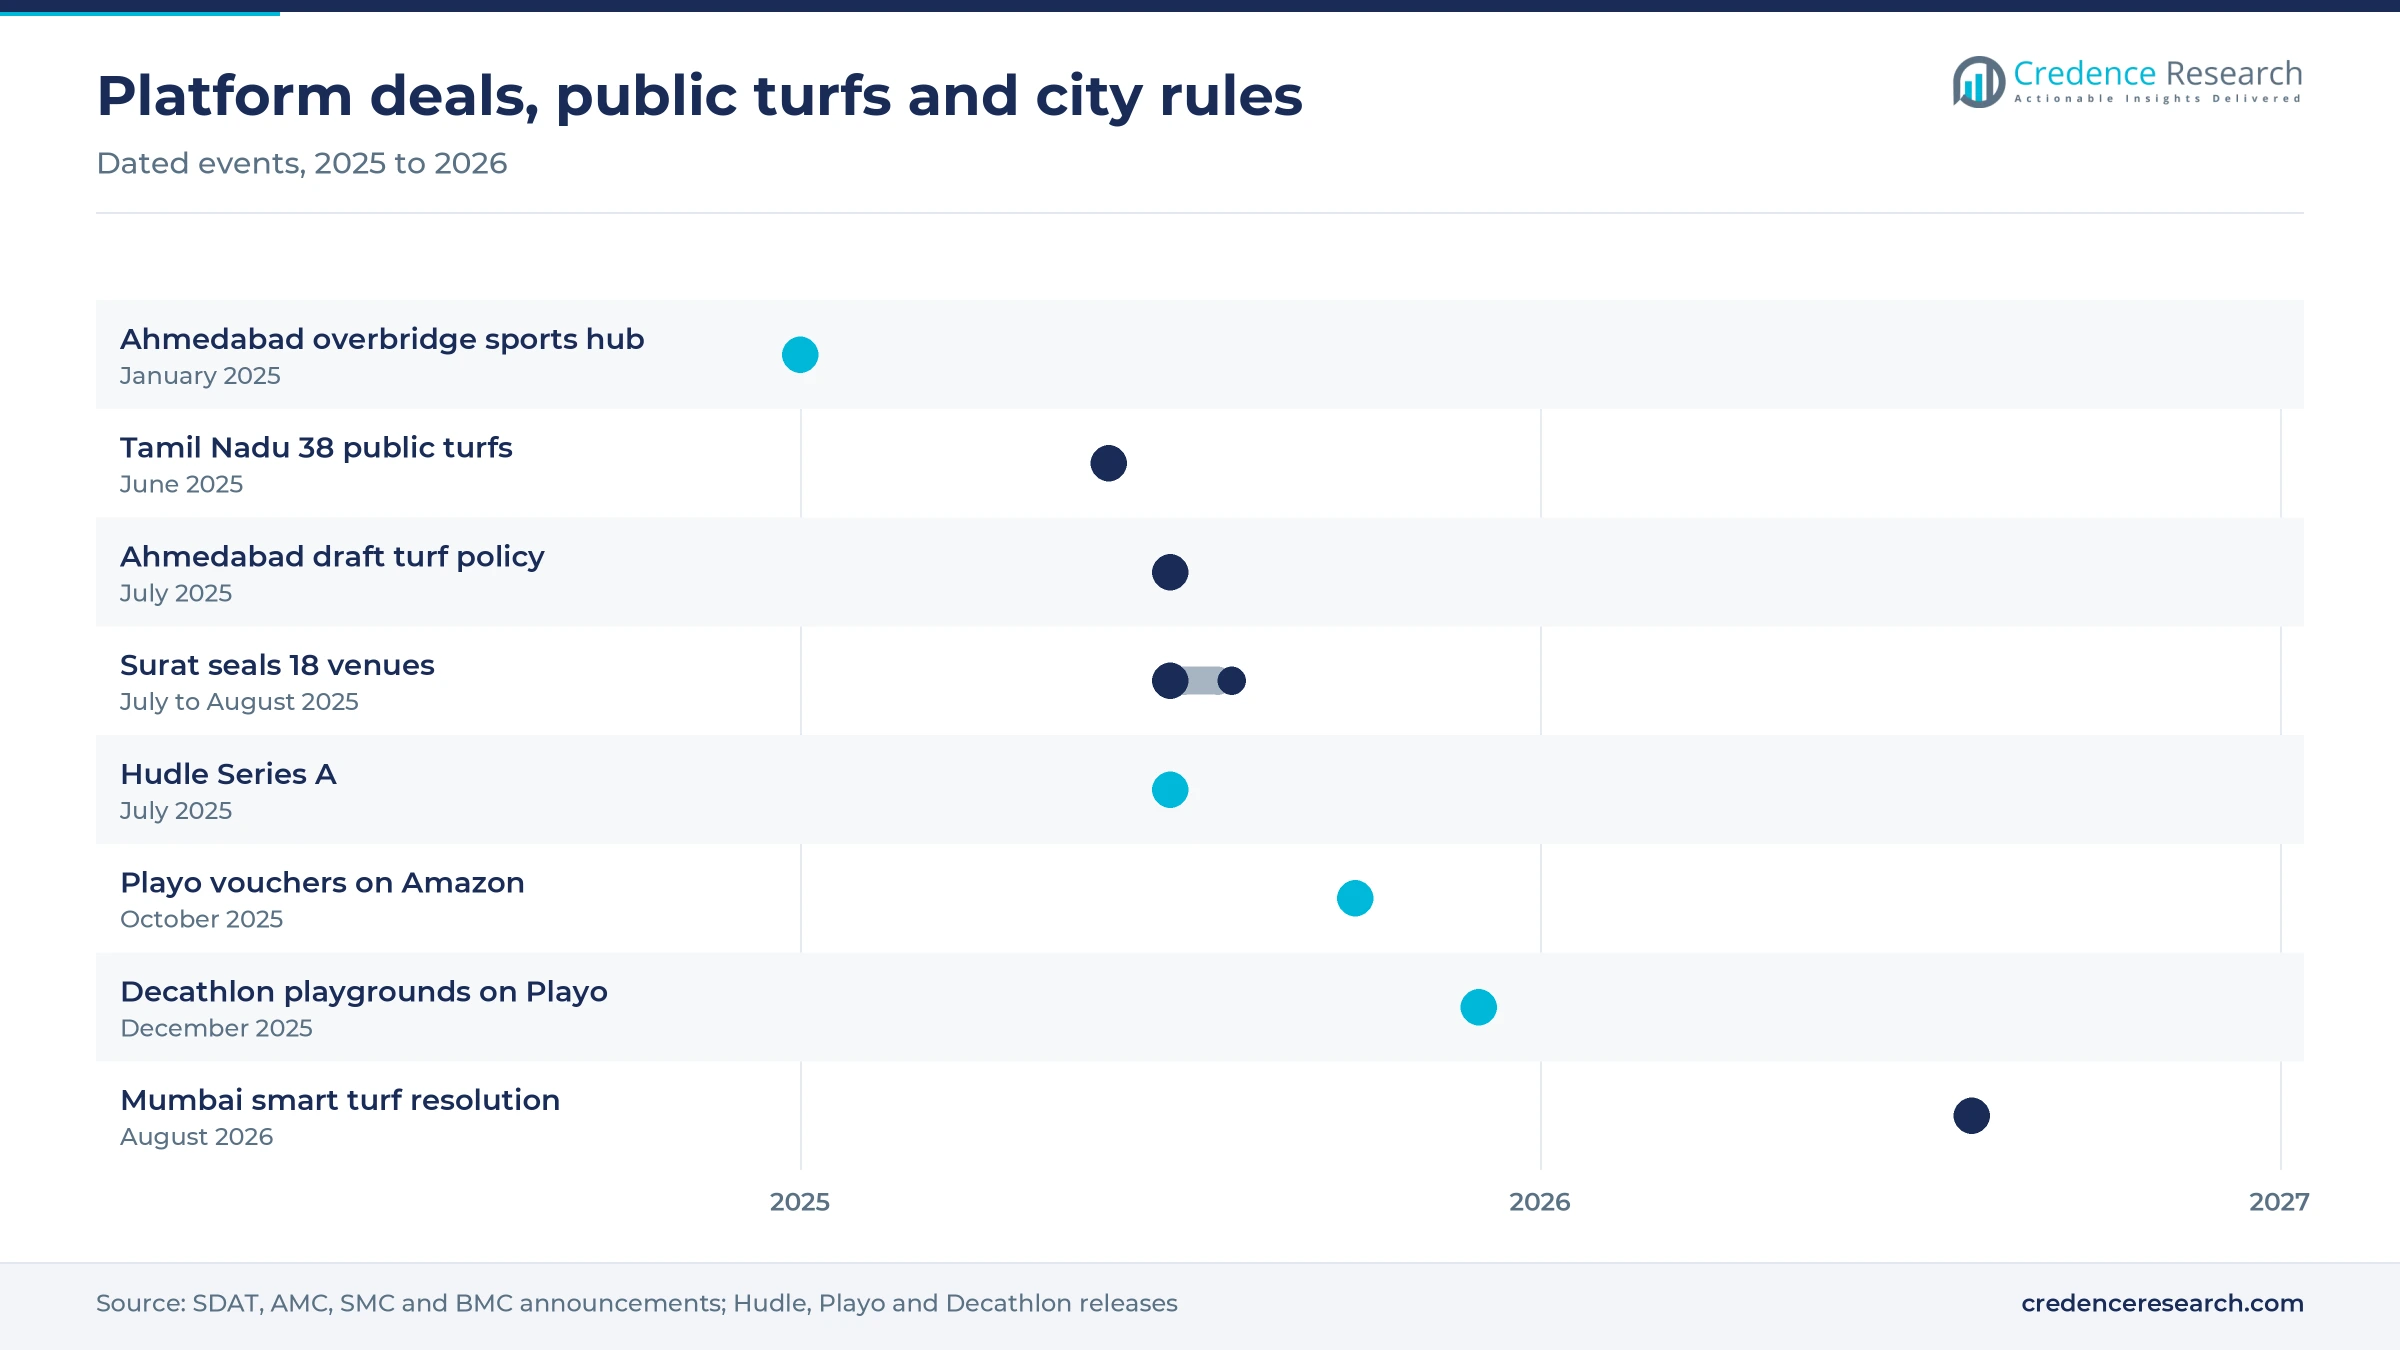
Platform deals, public turfs and city rules, 2025 to 2026
| Development | Status and market relevance |
|---|---|
| In June 2025, the Sports Development Authority of Tamil Nadu announced 38 futsal and box cricket turfs at Rs 60 lakh each, priced at Rs 800 to Rs 1,000 an hour. | Announced; one turf in every district, with a booking app planned |
| In July 2025, Hudle raised USD 2.5 million in a Series A round led by Sky Impact Capital, with more than 2,000 venues in 60 cities. | Closed; funds court additions, including over 300 pickleball courts a month |
| In October 2025, Playo and Amazon launched Playo Sports Vouchers, letting Amazon customers buy prepaid credits for more than 5,000 venues. | Live; first sports services category on Amazon in India |
| In December 2025, Decathlon India listed 36 of its playgrounds on Playo, with bookings open up to 20 days ahead. | Live; Phase 2 to add more of its 76 leased playgrounds |
| In August 2026, the Brihanmumbai Municipal Corporation passed a smart turf resolution for more than 1,500 private turfs. | Draft policy pending; app registration and rubber crumb ban proposed |
Booking apps, prepaid credits and safer infill change venues
- Booking apps such as Playo and Hudle show live slot availability, which lets owners sell late-evening hours that walk-ins would leave empty.
- Prepaid credits sold as Playo Sports Vouchers on Amazon from October 2025 let players and companies pay before they choose a venue.
- Civic registration apps like the proposed Khelo Mumbai app would record bookings and payments for every licensed turf and end cash dealings.
- Rubber-free infill is required under the Mumbai proposal, which bans rubber crumbs and pushes owners toward safer surface materials.
Need a Custom Version of This Report?
Tailor the scope, geography, or segments to your exact requirements.
- Custom geography or segment scope
- Direct access to our analyst team
Booking apps compete for thousands of local owners
Competition in box cricket turfs runs at two levels, venue ownership and slot distribution. Thousands of local owners compete on location, pitch quality, floodlights and price, from free civic parks in Ludhiana to premium Gurugram venues at Rs 2,000 an hour. Booking platforms compete to sign these owners and fill their slots, and Playo works with more than 5,000 venues and has five million users, while Hudle serves more than 2,000 venues and took a controlling stake in Sportido in 2023. KheloMore also sells venue slots, and Eternal's District is entering court bookings in large metros. Retailers also play a role, as Decathlon India runs playgrounds at its stores. Builders such as Black Stallion Sports and Infra supply synthetic grass surfaces and nets, and venues sell bats, balls and protective gear or rent them by the hour. Winners combine licensed sites, league programs and strong app ratings.
Companies profiled and their roles in this market
| Company | Type | Role in the market |
|---|---|---|
| Playo | Booking platform | 5,000+ partner venues in 100+ cities; Amazon vouchers since October 2025 |
| Hudle | Booking platform | 2,000+ venues in 60 cities; USD 2.5 million Series A in July 2025 |
| KheloMore | Booking platform | Venue booking app named by Mint among District rivals in November 2025 |
| District by Eternal | Booking platform | Play feature for courts planned in Delhi NCR, Mumbai and Bengaluru |
| Decathlon India | Retail venue operator | 76 leased playgrounds; 36 listed on Playo in December 2025 |
| Local turf owners | Independent venue operators | Single-site boxes such as The Box Cage, Fluxon Sports and Urban Sports Adda |
Licensed sites with league demand will win share
Credence Research's view is that licensed venues with steady league demand will take share as the market grows from USD 357.1 million through 2035. Demand is strong, with Playo bookings up 87.5% in two years, but supply is rising faster in some cities, as Kerala's fall to Rs 600 an hour shows. Operators that add pickleball or futsal courts and sign corporate leagues will earn more per square meter. Venue counters that already sell drinks and snacks during evening games can add sports nutrition lines to lift F&B income. Leagues grow fastest at 13.36% a year, so corporate tournament demand becomes a larger part of box cricket turf income by 2035.
How the venue revenue model was built
The report uses 2025 as the base year and forecasts to 2035. Market values come from the Credence Research model, built bottom-up from an estimate of commercial turf sites, typical hourly rates, booked hours a day and the share of income from leagues and food. Regional, sport, location and revenue splits are Credence Research estimates. Inputs include MoSPI survey data, civic resolutions and draft policies reported in the press, state sports authority announcements, platform releases, funding reports and local news coverage. The report did not conduct interviews or surveys, and it relies only on published sources.
Public turfs and smaller cities carry growth to 2035
Through 2035 the market grows at a 12.00% CAGR to reach USD 1.11 billion, as public pay-and-play turfs, corporate leagues and smaller cities widen the player base. South India keeps the lead on its dense Kerala and Tamil Nadu networks, while Central and Northeast India grow fastest from small bases. Multi-sport venues will add pickleball and futsal to cricket boxes, and leagues will take a larger share of income. City licensing in Mumbai and Ahmedabad will set the template for other states, so operators that register early, build safe structures and manage noise should gain share from informal sites.
Frequently Asked Questions
How big is the India box cricket turf market?
Which region leads the market?
Which sport holds the largest share?
Which revenue stream grows fastest?
How much does a box cricket slot cost?
Which companies are active in the market?
What are the main challenges for operators?
How are cities regulating turfs?
Table of Content
Chapter 1 Market Segmentation
- 1.1 Segmentation Framework
- 1.1.1 Product and Service Classification
- 1.1.2 Application and End-Use Classification
- 1.1.3 Technology and Solution Classification
- 1.1.4 Customer and Distribution Channel Classification
- 1.1.5 Geographic Segmentation
- 1.1.6 Market Segment Definitions and Boundaries
- 1.2 By Sport
- 1.2.1 Box Cricket
- 1.2.2 5-a-Side Football
- 1.2.3 Multi-Sport
- 1.3 By Location
- 1.3.1 Rooftops
- 1.3.2 Open Plots
- 1.3.3 Malls
- 1.4 By Revenue
- 1.4.1 Hourly Bookings
- 1.4.2 Leagues
- 1.4.3 F&B
Chapter 2 Introduction
- 2.1 Report Objectives and Scope
- 2.2 Product Definition and Industry Terminology
- 2.3 Market Inclusions and Exclusions
- 2.4 Research Process
- 2.4.1 Primary Research and Expert Interviews
- 2.4.2 Secondary Research and Source Review
- 2.4.3 Top-Down and Bottom-Up Estimation
- 2.4.4 Data Triangulation and Verification
- 2.5 Market Size Measurement Basis
- 2.5.1 2025: USD 357.1 million → 2035: USD 1.11 billion
- 2.6 Historical and Forecast Reference Periods
- 2.6.1 Historical Period: 2018-2025
- 2.6.2 Base Year: 2025
- 2.6.3 Forecast Period: 2025-2035
- 2.7 Research Assumptions and Limitations
Chapter 3 Executive Summary
- 3.1 Market Snapshot and Key Findings
- 3.2 Base-Year Market Size, 2025
- 3.3 Forecast Market Size, 2035
- 3.4 Revenue and Volume Growth Outlook
- 3.5 Key Demand and Supply Indicators
- 3.6 Leading Market Segments
- 3.7 Fastest-Growing Market Opportunities
- 3.8 Regional Performance Highlights
- 3.9 Technology and Industry Transformation
- 3.10 Competitive Landscape Summary
- 3.11 Analyst View and Strategic Implications
Chapter 4 India Box Cricket Turf Market Trends and Developments
- 4.1 Historical Industry Development, 2018-2025
- 4.2 Recent Market Trends and Developments
- 4.3 Demand and Customer Behavior Trends
- 4.4 Technology and Product Innovation
- 4.5 Artificial Intelligence, Automation and Digitalization
- 4.6 Local Manufacturing and Supply Chain Realignment
- 4.7 Industry Partnerships, Mergers and Acquisitions
- 4.8 Sustainability and Circular Economy Developments
- 4.9 Government and Private Sector Investment Trends
- 4.10 Emerging Business Models and Commercialization
- 4.11 Industry Developments and Announcements
Chapter 5 India Box Cricket Turf Market Production, Supply and Demand Analysis
- 5.1 Demand Trend and Consumption Analysis, 2018-2025
- 5.2 Demand Forecast, 2025-2035
- 5.3 Production and Output Trend, 2018-2025
- 5.4 Production and Output Forecast, 2025-2035
- 5.5 Installed Capacity and Capacity Utilization
- 5.6 Company-Wise Production Plants and Statistics
- 5.6.1 Installed Production Capacity
- 5.6.2 Actual Production
- 5.6.3 Planned Capacity and Expansion Targets
- 5.7 Supply Chain Structure and Procurement Trends
- 5.8 Supply-Demand Gap and Bottlenecks
- 5.9 Import Dependence and Sourcing Structure
- 5.10 Contract Manufacturing and Outsourcing
- 5.11 Regional Supply and Demand Concentration
Chapter 6 India Box Cricket Turf Market Pricing Analysis
- 6.1 Pricing Structure and Measurement
- 6.2 Historical Pricing Trends, 2018-2025
- 6.3 Pricing Outlook, 2025-2035
- 6.4 Average Selling Price and Unit Economics
- 6.5 Pricing by Product and Market Segment
- 6.6 Geographic Pricing Differences
- 6.7 Key Input, Energy, Labor and Logistics Costs
- 6.8 Contract Pricing and Purchasing Models
- 6.9 Pricing Sensitivity and Competitive Positioning
- 6.10 Price, Margin and Profitability Implications
Chapter 7 India Box Cricket Turf Market Dynamics
- 7.1 Market Growth Drivers
- 7.1.1 Demand-Side Drivers
- 7.1.2 Technology and Innovation Drivers
- 7.1.3 Infrastructure and Investment Drivers
- 7.1.4 Regulatory and Policy Drivers
- 7.2 Market Restraints
- 7.2.1 Cost and Affordability Constraints
- 7.2.2 Technology and Adoption Barriers
- 7.2.3 Supply Chain and Operational Constraints
- 7.3 Market Challenges
- 7.3.1 Competitive Pressure and Margin Erosion
- 7.3.2 Skills, Infrastructure and Implementation Gaps
- 7.4 Emerging Market Opportunities
- 7.5 Market Dynamics Impact and Time-Horizon Assessment
Chapter 8 India Box Cricket Turf Value Chain Analysis
- 8.1 Industry Value Chain Overview
- 8.2 Upstream Suppliers and Critical Inputs
- 8.3 Technology and Component Providers
- 8.4 Manufacturing or Service Delivery
- 8.5 Distribution, Channel Partners and Integrators
- 8.6 Downstream Applications and End Users
- 8.7 Value Addition and Profit Pools
- 8.8 Vertical Integration and Outsourcing
- 8.9 Supplier Concentration and Risk
- 8.10 Supply Chain Localization and Resilience
Chapter 9 India Box Cricket Turf Market Regulations and Policies
- 9.1 Relevant Laws, Standards and Compliance Frameworks
- 9.2 Product, Service, Safety and Quality Requirements
- 9.3 Government Policies, Incentives and Subsidies
- 9.4 Imports, Exports and Trade Barriers
- 9.5 Public Procurement and Local Content Requirements
- 9.6 Environmental and Sustainability Compliance
- 9.7 Upcoming Policy Changes and Market Implications
Chapter 10 India Box Cricket Turf Market Hotspots and Opportunities
- 10.1 Market Opportunity Mapping and Growth Hotspots
- 10.2 High-Growth Applications and Customer Groups
- 10.3 Underserved Markets and White-Space Opportunities
- 10.4 Emerging Technology and Product Opportunities
- 10.5 New Capacity and Investment Hotspots
- 10.6 Market Entry and Expansion Opportunities
- 10.7 Distribution and Partnership Opportunities
- 10.8 Near-Term and Long-Term Commercial Potential
- 10.9 Opportunity Attractiveness and Execution Risks
Chapter 11 India Box Cricket Turf Market Outlook, 2025-2035
- 11.1 Market Size and Analysis
- 11.1.1 Revenue (Market Measurement: 2025: USD 357.1 million → 2035: USD 1.11 billion)
- 11.1.2 Market Volume and Quantity Sold
- 11.1.3 Historical Market Size, 2018-2025
- 11.1.4 Base-Year Market Size, 2025
- 11.2 Market Forecast, 2025-2035
- 11.2.1 Revenue Forecast to 2035
- 11.2.2 Volume Forecast to 2035
- 11.2.3 CAGR and Year-on-Year Growth
- 11.2.4 Incremental Revenue Opportunity
- 11.3 Forecast Assumptions and Scenario Analysis
- 11.3.1 Base-Case Forecast
- 11.3.2 Optimistic and Conservative Scenarios
- 11.3.3 Technology, Pricing and Policy Sensitivities
- 11.4 Market Attractiveness and Growth Outlook
Chapter 12 India Box Cricket Turf Market Segmentation and Outlook
- 12.1 Segmentation Summary and Market Shares, 2025
- 12.2 Largest and Fastest-Growing Segments
- 12.3 By Sport - Market Size and Forecast, 2025-2035
- 12.3.1 Segment Definition and Scope
- 12.3.2 Historical Market Size, 2018-2025
- 12.3.3 Revenue Forecast, 2025-2035
- 12.3.4 Volume Forecast, 2025-2035
- 12.3.5 Base-Year Market Share, 2025
- 12.3.6 Segment CAGR and Growth Drivers
- 12.3.7 Subsegment Market Size and Forecast
- 12.3.7.1 Box Cricket
- 12.3.7.2 5-a-Side Football
- 12.3.7.3 Multi-Sport
- 12.3.8 Subsegment Pricing and Adoption Trends
- 12.3.9 Leading Suppliers and Competition
- 12.3.10 Regional Demand and Opportunities
- 12.4 By Location - Market Size and Forecast, 2025-2035
- 12.4.1 Segment Definition and Scope
- 12.4.2 Historical Market Size, 2018-2025
- 12.4.3 Revenue Forecast, 2025-2035
- 12.4.4 Volume Forecast, 2025-2035
- 12.4.5 Base-Year Market Share, 2025
- 12.4.6 Segment CAGR and Growth Drivers
- 12.4.7 Subsegment Market Size and Forecast
- 12.4.7.1 Rooftops
- 12.4.7.2 Open Plots
- 12.4.7.3 Malls
- 12.4.8 Subsegment Pricing and Adoption Trends
- 12.4.9 Leading Suppliers and Competition
- 12.4.10 Regional Demand and Opportunities
- 12.5 By Revenue - Market Size and Forecast, 2025-2035
- 12.5.1 Segment Definition and Scope
- 12.5.2 Historical Market Size, 2018-2025
- 12.5.3 Revenue Forecast, 2025-2035
- 12.5.4 Volume Forecast, 2025-2035
- 12.5.5 Base-Year Market Share, 2025
- 12.5.6 Segment CAGR and Growth Drivers
- 12.5.7 Subsegment Market Size and Forecast
- 12.5.7.1 Hourly Bookings
- 12.5.7.2 Leagues
- 12.5.7.3 F&B
- 12.5.8 Subsegment Pricing and Adoption Trends
- 12.5.9 Leading Suppliers and Competition
- 12.5.10 Regional Demand and Opportunities
- 12.6 Segment Growth Comparison
- 12.7 Segment Attractiveness and Priority Matrix
Chapter 13 India Box Cricket Turf Geographic Market Outlook, 2025-2035
- 13.1 Domestic Market Distribution and Demand Clusters
- 13.2 State- or Province-Wise Market Size and Forecast, 2025-2035
- 13.3 City and Metropolitan Market Outlook
- 13.4 Industrial, Manufacturing and Commercial Clusters
- 13.5 Geographic Concentration of Key End Users
- 13.6 Local Pricing and Purchasing Differences
- 13.7 Domestic Production Facilities and Capacity Map
- 13.8 Local Infrastructure and Project Pipeline
- 13.9 State-Level Policy and Incentive Differences
- 13.10 Subnational Investment Hotspots and Opportunities
- 13.11 Distribution and Logistics Networks
- 13.12 Domestic Competitive Footprint
Chapter 14 India Box Cricket Turf Technology, Innovation and Sustainability Outlook
- 14.1 Technology Landscape and Maturity
- 14.2 Product, Process and Service Innovation
- 14.3 AI, Automation and Digital Tools in the Industry
- 14.4 Technology Adoption and Performance Benchmarking
- 14.5 Innovation Pipeline and R&D Investment
- 14.6 Patent and Intellectual Property Trends
- 14.7 Energy Efficiency and Resource Management
- 14.8 Sustainability, Recycling and Circularity
- 14.9 Technology Roadmap, 2025-2035
- 14.10 Risks of Obsolescence and Technology Substitution
Chapter 15 India Box Cricket Turf Market Key Strategic Imperatives
- 15.1 Growth and Market Entry Priorities
- 15.2 High-Return Products and Segments
- 15.3 Pricing, Profitability and Cost Optimization
- 15.4 Technology Investment and Product Differentiation
- 15.5 Supply Chain Localization and Resilience
- 15.6 Distribution and Customer Acquisition
- 15.7 Partnership, Acquisition and Capacity Strategy
- 15.8 Regional Expansion Priorities
- 15.9 Short-, Medium- and Long-Term Actions
Chapter 16 Competition Outlook
- 16.1 Industry Competition Characteristics
- 16.2 Market Structure and Concentration
- 16.3 Market Share and Competitive Positioning, 2025
- 16.4 Company-Wise Revenue and Product Benchmarking
- 16.5 Production and Service Capacity Benchmarking
- 16.6 Technology, Pricing and Differentiation
- 16.7 Regional Footprint and Distribution Strength
- 16.8 Mergers, Acquisitions and Strategic Alliances
- 16.9 New Entrants and Competitive Threats
- 16.10 Porter's Five Forces and Industry Attractiveness
- 16.11 Competitive Outlook, 2025-2035
Chapter 17 Company Profiles
- 17.1 Company Coverage and Selection Criteria
- 17.2 Playo
- 17.2.1 Business Description
- 17.2.2 Company Ownership and Geographic Presence
- 17.2.3 Product and Service Portfolio
- 17.2.4 Manufacturing and Operating Footprint
- 17.2.5 Production Capacity and Expansion Plans
- 17.2.6 Financial Performance and Investment
- 17.2.7 Market Share and Competitive Position
- 17.2.8 Technology and Innovation Capabilities
- 17.2.9 Strategic Alliances or Partnerships
- 17.2.10 Recent Developments
- 17.2.11 Growth Strategy and Outlook
- 17.3 Hudle
- 17.4 KheloMore
- 17.5 District by Eternal
- 17.6 Decathlon India
- 17.7 Local turf owners
- 17.8 Other Relevant Market Participants
Note: Every listed company is profiled on the structure shown under the first company. The company list is preliminary and may change based on research findings, market developments, data availability and client requirements.
Chapter 18 Disclaimer
- 18.1 Research and Forecast Disclaimer
- 18.2 Data Source and Estimation Limitations
Note: The depth of individual sections depends on data availability for this market. Volume, capacity, trade and other unit-based metrics are included where applicable.