Market Overview
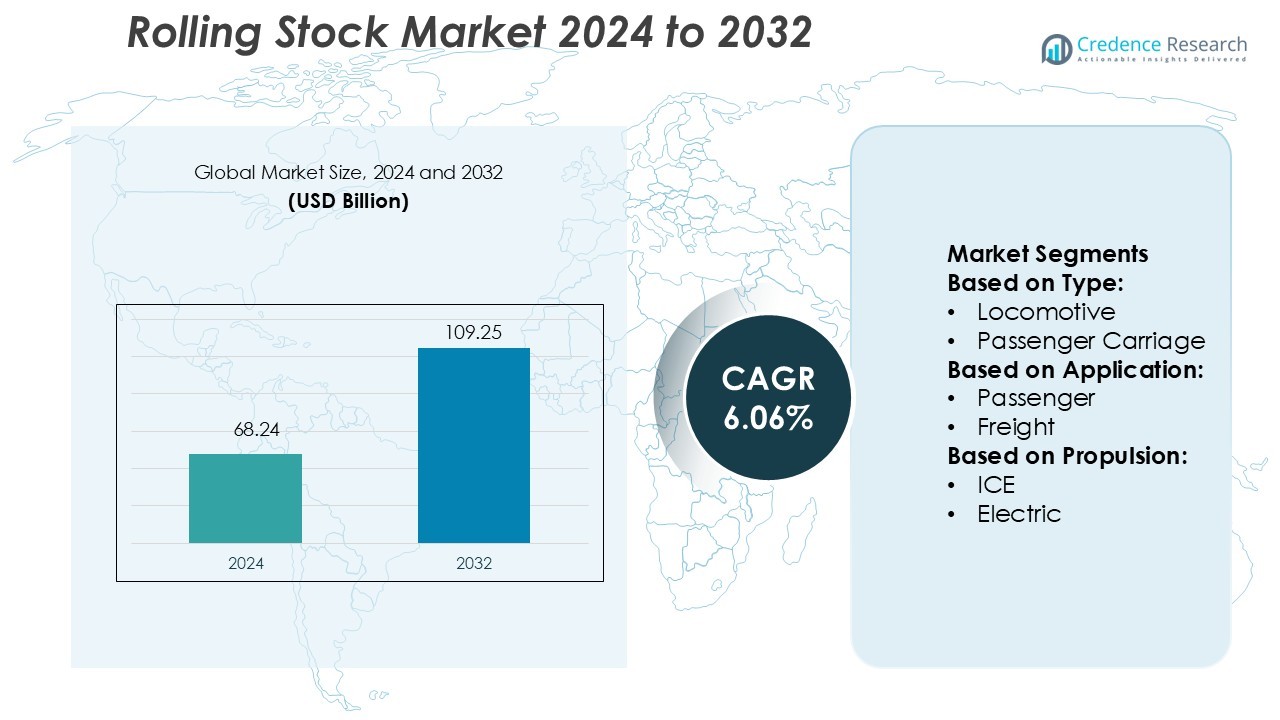
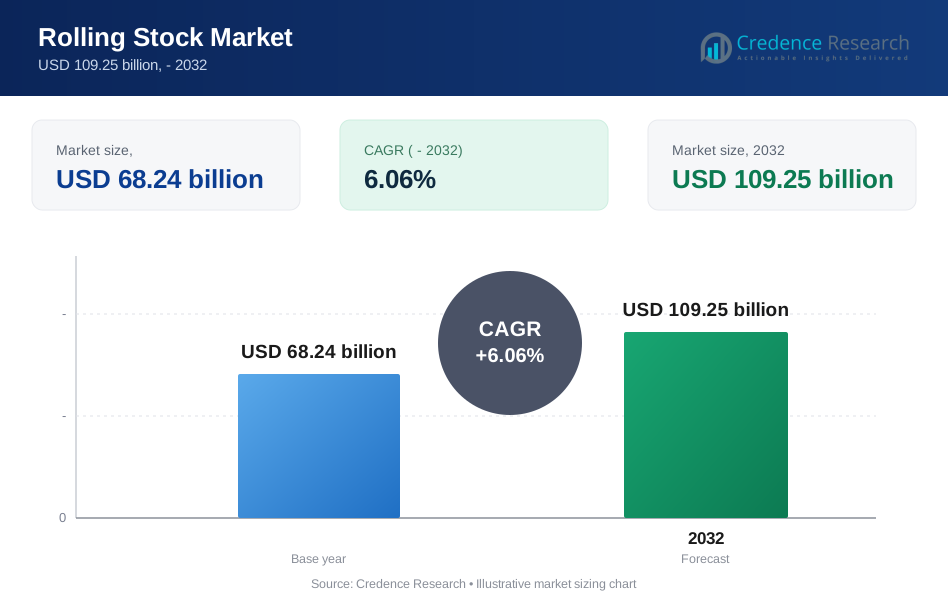
Rolling Stock Market size was valued USD 68.24 billion in 2024 and is anticipated to reach USD 109.25 billion by 2032, at a CAGR of 6.06% during the forecast period.
| REPORT ATTRIBUTE | DETAILS |
|---|---|
| Historical Period | 2020-2023 |
| Base Year | 2024 |
| Forecast Period | 2025-2032 |
| Rolling Stock Market Size 2024 | USD 68.24 Billion |
| Rolling Stock Market, CAGR | 6.06% |
| Rolling Stock Market Size 2032 | USD 109.25 Million |
The rolling stock market features strong competition among leading manufacturers, with technological innovation and global expansion shaping industry growth. Europe holds the largest regional market share of 30%, supported by advanced infrastructure, strong regulatory frameworks, and a growing focus on sustainable mobility. High-speed rail development, digital integration, and fleet modernization are key factors driving leadership in this region. Market players are investing heavily in research, product diversification, and energy-efficient solutions to strengthen their competitive edge. Strategic collaborations with governments and infrastructure developers further support growth, positioning Europe as a key hub for rolling stock innovation and deployment.
Market Insights
- The Rolling Stock Market was valued at USD 68.24 billion in 2024 and is expected to reach USD 109.25 billion by 2032, growing at a CAGR of 6.06%.
- Strong market drivers include rising demand for high-speed rail, modernization of existing fleets, and digital integration to enhance operational efficiency.
- Key trends involve increased investment in sustainable mobility, hybrid propulsion systems, and advanced predictive maintenance technologies to reduce lifecycle costs.
- Competitive strategies focus on innovation, global expansion, and partnerships, with Europe leading at 30% regional share, supported by advanced infrastructure and strong regulations.
- Market restraints include high capital investment and supply chain disruptions, but steady demand from freight and passenger segments continues to support global market expansion.
Market Segmentation Analysis:
By Type
The wagon segment dominates the rolling stock market with a 42% share. Strong demand from logistics, mining, and heavy industries drives this leadership. Wagons offer high load capacity, long service life, and low operational costs. Governments and private operators are investing in high-capacity wagons to support bulk freight movement. For instance, India’s Dedicated Freight Corridor Corporation has expanded its wagon fleet to support 25-ton axle loads, increasing network efficiency. The segment also benefits from ongoing modernization programs and infrastructure upgrades, which strengthen freight transport capacity and improve operational reliability.
- For instance, Kawasaki Heavy Industries introduced the EF210-300 electric freight locomotive series with a 3,390 kW traction power output and a tractive effort of 199 kN.
By Application
The freight segment holds the largest market share at 58%, supported by rising demand for bulk goods movement. Freight services remain cost-effective and energy-efficient for long-distance transport, making them preferred over roadways. Key industries such as coal, steel, and chemicals drive consistent demand. For instance, Deutsche Bahn Cargo moved over 200 million tons of freight in 2024, reflecting robust capacity utilization. Investments in dedicated freight corridors and intermodal terminals are enhancing connectivity and throughput. This growth aligns with global trade expansion and government efforts to boost rail freight share.
- For instance, Hyundai Rotem’s high-speed trainset model KTX‑Cheongryong (EMU-320) features a maximum design speed of 352 km/h and a commercial service speed of 320 km/h.
By Propulsion
The electric segment leads with a 61% market share, driven by rapid electrification of rail networks. Electric trains offer higher energy efficiency, lower emissions, and reduced operating costs compared to diesel. Governments worldwide are investing in green mobility and upgrading existing lines with electrified infrastructure. For instance, China State Railway Group operates more than 100,000 km of electrified lines, enabling faster and cleaner train operations. The transition toward electric propulsion aligns with sustainability goals and enhances network capacity. Continuous investments in high-speed and metro rail further support segment dominance.
Key Growth Drivers
Expansion of High-Speed Rail Networks
The rising focus on efficient and sustainable transportation is driving high-speed rail expansion. Governments are investing in modern rail infrastructure to reduce road congestion and emissions. High-speed trains offer faster travel times, making them an attractive alternative to air travel. Increasing public funding and private partnerships further support new network development. Countries like China, Japan, and France continue to upgrade existing lines, setting global benchmarks. This growing network expansion significantly boosts demand for advanced rolling stock with improved speed, safety, and comfort features.
- For instance, Alstom’s Avelia Horizon™ is a double-deck high-speed train that achieves a maximum speed of 320 km/h in commercial operation and is designed for speeds up to 350 km/h. While a high-performance double-deck train, it is not the only one in the world.
Modernization of Aging Rail Fleets
Aging rail fleets are being replaced with modern, energy-efficient rolling stock. Rail operators are investing in new locomotives and passenger coaches to improve reliability and reduce maintenance costs. Modern trains feature advanced braking systems, lightweight materials, and efficient propulsion technologies. This modernization improves operational performance and passenger experience. For example, several European operators are introducing hybrid and electric units to comply with stricter emission regulations. These modernization initiatives fuel rolling stock demand across passenger and freight segments.
- For instance, Škoda Transportation a.s. (part of PPF Group), a battery electric multiple unit (BEMU) named RegioPanter BEMU features a battery-only range of up to 80 km, a maximum speed of 120 km/h in battery mode and 160 km/h in trolley mode, and an installed power of 4 × 340 kW motors.
Rising Freight Transportation Demand
Global trade growth and e-commerce expansion are increasing freight transport demand. Rail freight offers cost-effective and sustainable logistics solutions compared to road transport. Governments and private players are investing in freight corridors and intermodal transport facilities. Rolling stock such as wagons and locomotives plays a crucial role in handling bulk cargo efficiently. For example, dedicated freight corridors in India and Europe are expanding capacity to support growing logistics needs. This rising freight activity strengthens the market outlook for rolling stock.
Key Trends & Opportunities
Integration of Digital and Automation Technologies
Digital transformation is reshaping the rolling stock industry. Advanced technologies like IoT, predictive maintenance, and real-time monitoring improve fleet efficiency and safety. Automation reduces downtime, enhances maintenance scheduling, and lowers operational costs. Smart train systems provide data-driven insights for better asset utilization. Manufacturers are also integrating autonomous and semi-autonomous systems to enhance network reliability. This technological shift opens new opportunities for rail operators and equipment suppliers, driving innovation across global markets.
- For instance, the hydrogen-powered FLIRT H2 unit covered 1,741.7 miles (2,803 km) on a single fill without refuelling or recharging, setting a new Guinness World Record.
Growing Focus on Sustainable and Green Mobility
Sustainability is a major trend shaping future rail development. Governments are encouraging the adoption of hybrid, hydrogen, and fully electric rolling stock. These eco-friendly solutions help reduce greenhouse gas emissions and comply with global climate goals. Companies are investing in lightweight materials, regenerative braking, and energy-efficient propulsion systems. The demand for zero-emission trains is increasing, particularly in Europe and Asia. This trend creates strong opportunities for innovation and strategic partnerships in clean transport technologies.
- For instance, IHI developed an electric turbo‐charger for fuel‐cell systems capable of a 150 kW power output, supplied in prototype form for the HyTruck hydrogen powertrain in 2021.
Expansion of Public-Private Partnerships (PPPs)
Public-private partnerships are becoming essential for rail infrastructure growth. Governments are partnering with private players to finance, build, and operate modern rail systems. These collaborations accelerate project timelines and ensure efficient delivery. PPP models also encourage technological innovation and better service quality. Countries in Asia and the Middle East are actively adopting this model for new high-speed and metro projects. This expansion of PPP frameworks is opening new investment and growth opportunities in the rolling stock sector.
Key Challenges
High Initial Capital Investment
Rolling stock manufacturing and infrastructure development involve large upfront costs. High-speed trains, advanced locomotives, and supporting infrastructure require significant financial commitments. This cost burden limits adoption in developing regions with budget constraints. Securing funding and balancing financial risk between public and private stakeholders remains challenging. Additionally, long payback periods discourage smaller operators from investing in fleet modernization. This high capital requirement poses a barrier to rapid market expansion.
Supply Chain Disruptions and Component Shortages
Global supply chain disruptions affect rolling stock manufacturing timelines and costs. Shortages of critical components such as semiconductors, braking systems, and traction equipment delay deliveries. Geopolitical tensions and logistical bottlenecks further increase production costs. Manufacturers must manage rising raw material prices and procurement delays. These disruptions impact both OEMs and operators, slowing project execution. Strengthening supply chain resilience has become a key priority for maintaining market growth momentum.
Regional Analysis
North America
North America holds a 26% market share in the global rolling stock market, driven by rising investments in freight rail modernization and passenger transport upgrades. The U.S. and Canada are focusing on fleet replacement with energy-efficient locomotives to meet stricter emission standards. Expansion of intercity rail networks and urban transit systems boosts demand for advanced rolling stock solutions. Freight operators are also investing in automated and digitalized wagons to improve efficiency. Growing private sector participation in infrastructure projects further strengthens regional market growth, positioning North America as a key contributor to global revenue.
Europe
Europe accounts for 30% of the global market share, making it the leading region in rolling stock adoption. The region benefits from strong government support for sustainable mobility and advanced rail infrastructure. Countries like Germany, France, and the U.K. are modernizing fleets with electric and hybrid trains to meet climate targets. The EU’s Green Deal initiatives are accelerating investments in high-speed rail and zero-emission technologies. Well-established operators and OEMs such as Alstom and Siemens enhance regional competitiveness. This commitment to innovation and sustainability keeps Europe at the forefront of rolling stock development.
Asia Pacific
Asia Pacific leads the market with a 32% share, fueled by rapid urbanization, population growth, and expanding rail networks. China, India, and Japan are heavily investing in high-speed rail, freight corridors, and metro systems. Rising government funding and strategic PPP models support large-scale modernization programs. High passenger volumes and growing trade activity drive strong demand for passenger carriages, locomotives, and freight wagons. Technological advancements and manufacturing capabilities further strengthen the region’s leadership position. Asia Pacific’s strong infrastructure expansion continues to make it a key growth hub for the rolling stock industry.
Latin America
Latin America captures a 6% market share, supported by increasing investments in rail infrastructure modernization. Brazil, Mexico, and Argentina are upgrading freight lines and expanding urban rail systems to enhance connectivity. Governments are prioritizing efficient logistics solutions to support industrial growth and trade. Growing partnerships with private investors and international OEMs are boosting fleet upgrades and technology adoption. However, limited funding and slower project execution remain key challenges. Despite this, rising demand for cost-effective freight transport solutions is expected to sustain steady market growth in the region.
Middle East & Africa
The Middle East & Africa region holds a 6% market share, driven by growing infrastructure investments and strategic diversification initiatives. Countries like the UAE, Saudi Arabia, and South Africa are expanding rail networks to support economic diversification and trade. High-speed rail projects and cross-border freight corridors are gaining momentum. Governments are actively partnering with international OEMs to deploy advanced rolling stock solutions. The region faces challenges such as high capital requirements and limited local manufacturing. However, strong government support and strategic projects are expected to unlock significant growth potential.
Market Segmentations:
By Type:
- Locomotive
- Passenger Carriage
By Application:
- Passenger
- Freight
By Propulsion:
- ICE
- Electric
By Geography
- North America
- U.S.
- Canada
- Mexico
- Europe
- Germany
- France
- U.K.
- Italy
- Spain
- Rest of Europe
- Asia Pacific
- China
- Japan
- India
- South Korea
- South-east Asia
- Rest of Asia Pacific
- Latin America
- Brazil
- Argentina
- Rest of Latin America
- Middle East & Africa
- GCC Countries
- South Africa
- Rest of the Middle East and Africa
Competitive Landscape
The rolling stock market is shaped by leading companies such as Kawasaki Heavy Industries, CAF, Hyundai Corporation, Alstom, PPF Group N.V., CRRC Corporation Limited, Stadler Rail AG, IHI Corporation, Hitachi, and Greenbrier Companies. The rolling stock market is characterized by intense competition, strong technological innovation, and increasing regional expansion. Manufacturers are focusing on developing energy-efficient and sustainable rolling stock to meet evolving environmental regulations. High-speed trains, hybrid propulsion systems, and digitalized fleet management solutions are gaining traction among operators. Strategic partnerships between OEMs, governments, and private investors are driving modernization projects and accelerating new product launches. Companies are also investing in predictive maintenance, automation, and lightweight materials to enhance operational efficiency and reduce lifecycle costs. This competitive environment encourages continuous innovation and market differentiation.
Key Player Analysis
- Kawasaki Heavy Industries
- CAF
- Hyundai Corporation
- Alstom
- PPF Group N.V.
- CRRC Corporation Limited
- Stadler Rail AG
- IHI Corporation
- Hitachi
- Greenbrier Companies
Recent Developments
- In May 2025, Massachusetts Bay Transportation Authority (MBTA) in partnership with Keolis launched a diesel pilot programme to asses alternative fuel use on part of the Commuter Rail fleet in the Greater Boston region.
- In November 2024, Morocco’s Railways (ONCF) awarded a contract to a consortium of Ineco and the local engineering firm CID for the preliminary design of Oued Zem-Beni Mellal railway in central Morocco.
- In February 2024, Siemens Mobility launched a smart train lease GmbH, which aims to revolutionize the regional rail transportation sector through innovation in the lease mode.
- In February 2023, Stadler Rail AG collaborated with Utah State University and ASPIRE Engineering Research Centre to build a battery-powered passenger train based on the FLIRT Akku concept.
Report Coverage
The research report offers an in-depth analysis based on Type, Application, Propulsion and Geography. It details leading market players, providing an overview of their business, product offerings, investments, revenue streams, and key applications. Additionally, the report includes insights into the competitive environment, SWOT analysis, current market trends, as well as the primary drivers and constraints. Furthermore, it discusses various factors that have driven market expansion in recent years. The report also explores market dynamics, regulatory scenarios, and technological advancements that are shaping the industry. It assesses the impact of external factors and global economic changes on market growth. Lastly, it provides strategic recommendations for new entrants and established companies to navigate the complexities of the market.
Future Outlook
- Global investment in rail infrastructure will continue to grow steadily.
- High-speed rail development will expand across emerging and developed markets.
- Digital technologies will play a bigger role in fleet operations and maintenance.
- Sustainability goals will accelerate the shift toward electric and hybrid trains.
- Freight rail demand will rise due to e-commerce and trade expansion.
- Predictive maintenance solutions will reduce operational downtime and costs.
- Public-private partnerships will support large-scale modernization projects.
- Lightweight materials and advanced propulsion will enhance energy efficiency.
- Regional manufacturing hubs will expand to reduce supply chain risks.
- Competitive pressure will drive continuous innovation in design and performance.
Request a Free Sample
Fill in your details and we'll send you a free sample report.
- Sample data tables & charts
- Research methodology
Need a Custom Version of This Report?
Tailor the scope, geography, or segments to your exact requirements.
- Custom geography or segment scope
- Direct access to our analyst team
Frequently Asked Questions
What is the current market size for Rolling Stock Market, and what is its projected size in 2032?
At what Compound Annual Growth Rate is the Rolling Stock Market projected to grow between 2025 and 2032?
Which Rolling Stock Market segment held the largest share in 2024?
What are the primary factors fueling the growth of the Rolling Stock Market?
Who are the leading companies in the Rolling Stock Market?
Which region commanded the largest share of the Rolling Stock Market in 2024?
Table of Content
Chapter 1 Market Segmentation
- 1.1 Segmentation Framework
- 1.1.1 Product and Service Classification
- 1.1.2 Application and End-Use Classification
- 1.1.3 Technology and Solution Classification
- 1.1.4 Customer and Distribution Channel Classification
- 1.1.5 Geographic Segmentation
- 1.1.6 Market Segment Definitions and Boundaries
Chapter 2 Introduction
- 2.1 Report Objectives and Scope
- 2.2 Product Definition and Industry Terminology
- 2.3 Market Inclusions and Exclusions
- 2.4 Research Process
- 2.4.1 Primary Research and Expert Interviews
- 2.4.2 Secondary Research and Source Review
- 2.4.3 Top-Down and Bottom-Up Estimation
- 2.4.4 Data Triangulation and Verification
- 2.5 Market Size Measurement Basis
- 2.5.1 2024: USD 68.24 billion → 2032: USD 109.25 billion
- 2.6 Historical and Forecast Reference Periods
- 2.6.1 Base Year: 2024
- 2.6.2 Forecast Period: 2024-2032
- 2.7 Research Assumptions and Limitations
Chapter 3 Executive Summary
- 3.1 Market Snapshot and Key Findings
- 3.2 Base-Year Market Size, 2024
- 3.3 Forecast Market Size, 2032
- 3.4 Revenue and Volume Growth Outlook
- 3.5 Key Demand and Supply Indicators
- 3.6 Leading Market Segments
- 3.7 Fastest-Growing Market Opportunities
- 3.8 Regional Performance Highlights
- 3.9 Technology and Industry Transformation
- 3.10 Competitive Landscape Summary
- 3.11 Analyst View and Strategic Implications
Chapter 4 Global Rolling Stock Market Trends and Developments
- 4.1 Historical Industry Development
- 4.2 Recent Market Trends and Developments
- 4.3 Demand and Customer Behavior Trends
- 4.4 Technology and Product Innovation
- 4.5 Artificial Intelligence, Automation and Digitalization
- 4.6 Local Manufacturing and Supply Chain Realignment
- 4.7 Industry Partnerships, Mergers and Acquisitions
- 4.8 Sustainability and Circular Economy Developments
- 4.9 Government and Private Sector Investment Trends
- 4.10 Emerging Business Models and Commercialization
- 4.11 Industry Developments and Announcements
Chapter 5 Global Rolling Stock Market Production, Supply and Demand Analysis
- 5.1 Demand Trend and Consumption Analysis
- 5.2 Demand Forecast, 2024-2032
- 5.3 Production and Output Trend
- 5.4 Production and Output Forecast, 2024-2032
- 5.5 Installed Capacity and Capacity Utilization
- 5.6 Company-Wise Production Plants and Statistics
- 5.6.1 Installed Production Capacity
- 5.6.2 Actual Production
- 5.6.3 Planned Capacity and Expansion Targets
- 5.7 Supply Chain Structure and Procurement Trends
- 5.8 Supply-Demand Gap and Bottlenecks
- 5.9 Import Dependence and Sourcing Structure
- 5.10 Contract Manufacturing and Outsourcing
- 5.11 Regional Supply and Demand Concentration
Chapter 6 Global Rolling Stock Market Pricing Analysis
- 6.1 Pricing Structure and Measurement
- 6.2 Historical Pricing Trends
- 6.3 Pricing Outlook, 2024-2032
- 6.4 Average Selling Price and Unit Economics
- 6.5 Pricing by Product and Market Segment
- 6.6 Geographic Pricing Differences
- 6.7 Key Input, Energy, Labor and Logistics Costs
- 6.8 Contract Pricing and Purchasing Models
- 6.9 Pricing Sensitivity and Competitive Positioning
- 6.10 Price, Margin and Profitability Implications
Chapter 7 Global Rolling Stock Market Dynamics
- 7.1 Market Growth Drivers
- 7.1.1 Demand-Side Drivers
- 7.1.2 Technology and Innovation Drivers
- 7.1.3 Infrastructure and Investment Drivers
- 7.1.4 Regulatory and Policy Drivers
- 7.2 Market Restraints
- 7.2.1 Cost and Affordability Constraints
- 7.2.2 Technology and Adoption Barriers
- 7.2.3 Supply Chain and Operational Constraints
- 7.3 Market Challenges
- 7.3.1 Competitive Pressure and Margin Erosion
- 7.3.2 Skills, Infrastructure and Implementation Gaps
- 7.4 Emerging Market Opportunities
- 7.5 Market Dynamics Impact and Time-Horizon Assessment
Chapter 8 Global Rolling Stock Value Chain Analysis
- 8.1 Industry Value Chain Overview
- 8.2 Upstream Suppliers and Critical Inputs
- 8.3 Technology and Component Providers
- 8.4 Manufacturing or Service Delivery
- 8.5 Distribution, Channel Partners and Integrators
- 8.6 Downstream Applications and End Users
- 8.7 Value Addition and Profit Pools
- 8.8 Vertical Integration and Outsourcing
- 8.9 Supplier Concentration and Risk
- 8.10 Supply Chain Localization and Resilience
Chapter 9 Global Rolling Stock Market Regulations and Policies
- 9.1 Relevant Laws, Standards and Compliance Frameworks
- 9.2 Product, Service, Safety and Quality Requirements
- 9.3 Government Policies, Incentives and Subsidies
- 9.4 Imports, Exports and Trade Barriers
- 9.5 Public Procurement and Local Content Requirements
- 9.6 Environmental and Sustainability Compliance
- 9.7 Upcoming Policy Changes and Market Implications
Chapter 10 Global Rolling Stock Market Hotspots and Opportunities
- 10.1 Market Opportunity Mapping and Growth Hotspots
- 10.2 High-Growth Applications and Customer Groups
- 10.3 Underserved Markets and White-Space Opportunities
- 10.4 Emerging Technology and Product Opportunities
- 10.5 New Capacity and Investment Hotspots
- 10.6 Market Entry and Expansion Opportunities
- 10.7 Distribution and Partnership Opportunities
- 10.8 Near-Term and Long-Term Commercial Potential
- 10.9 Opportunity Attractiveness and Execution Risks
Chapter 11 Global Rolling Stock Market Outlook, 2024-2032
- 11.1 Market Size and Analysis
- 11.1.1 Revenue (Market Measurement: 2024: USD 68.24 billion → 2032: USD 109.25 billion)
- 11.1.2 Market Volume and Quantity Sold
- 11.1.3 Historical Market Size
- 11.1.4 Base-Year Market Size, 2024
- 11.2 Market Forecast, 2024-2032
- 11.2.1 Revenue Forecast to 2032
- 11.2.2 Volume Forecast to 2032
- 11.2.3 CAGR and Year-on-Year Growth
- 11.2.4 Incremental Revenue Opportunity
- 11.3 Forecast Assumptions and Scenario Analysis
- 11.3.1 Base-Case Forecast
- 11.3.2 Optimistic and Conservative Scenarios
- 11.3.3 Technology, Pricing and Policy Sensitivities
- 11.4 Market Attractiveness and Growth Outlook
Chapter 12 Global Rolling Stock Market Segmentation and Outlook
- 12.1 Segmentation Summary and Market Shares, 2024
- 12.2 Largest and Fastest-Growing Segments
- 12.3 Segment Growth Comparison
- 12.4 Segment Attractiveness and Priority Matrix
Chapter 13 Global Rolling Stock Geographic Market Outlook, 2024-2032
- 13.1 Regional Market Size and Share, 2024
- 13.2 Regional Market Forecast, 2024-2032
- 13.3 Regional Pricing, Production and Demand Differences
- 13.4 North America
- 13.4.1 United States
- 13.4.2 Canada
- 13.4.3 Mexico
- 13.5 Europe
- 13.5.1 Germany
- 13.5.2 France
- 13.5.3 Italy
- 13.5.4 United Kingdom
- 13.5.5 Spain
- 13.5.6 Poland
- 13.5.7 Russia
- 13.5.8 Netherlands
- 13.5.9 Belgium
- 13.5.10 Sweden
- 13.5.11 Denmark
- 13.5.12 Norway
- 13.5.13 Rest of Europe
- 13.6 Asia Pacific
- 13.6.1 China
- 13.6.2 India
- 13.6.3 Japan
- 13.6.4 South Korea
- 13.6.5 Thailand
- 13.6.6 Indonesia
- 13.6.7 Vietnam
- 13.6.8 Malaysia
- 13.6.9 Australia
- 13.6.10 Rest of Asia Pacific
- 13.7 Latin America
- 13.7.1 Brazil
- 13.7.2 Argentina
- 13.7.3 Colombia
- 13.7.4 Chile
- 13.7.5 Rest of Latin America
- 13.8 Middle East
- 13.8.1 Saudi Arabia
- 13.8.2 United Arab Emirates
- 13.8.3 Turkey
- 13.8.4 Israel
- 13.8.5 Iran
- 13.8.6 Rest of the Middle East
- 13.9 Africa
- 13.9.1 South Africa
- 13.9.2 Egypt
- 13.9.3 Nigeria
- 13.9.4 Morocco
- 13.9.5 Rest of Africa
- 13.10 Regional Investment, Policy and Supply Chain Differences
- 13.11 Regional Competitive Landscape
- 13.12 Geographic Growth Hotspots
Chapter 14 Global Rolling Stock Technology, Innovation and Sustainability Outlook
- 14.1 Technology Landscape and Maturity
- 14.2 Product, Process and Service Innovation
- 14.3 AI, Automation and Digital Tools in the Industry
- 14.4 Technology Adoption and Performance Benchmarking
- 14.5 Innovation Pipeline and R&D Investment
- 14.6 Patent and Intellectual Property Trends
- 14.7 Energy Efficiency and Resource Management
- 14.8 Sustainability, Recycling and Circularity
- 14.9 Technology Roadmap, 2024-2032
- 14.10 Risks of Obsolescence and Technology Substitution
Chapter 15 Global Rolling Stock Market Key Strategic Imperatives
- 15.1 Growth and Market Entry Priorities
- 15.2 High-Return Products and Segments
- 15.3 Pricing, Profitability and Cost Optimization
- 15.4 Technology Investment and Product Differentiation
- 15.5 Supply Chain Localization and Resilience
- 15.6 Distribution and Customer Acquisition
- 15.7 Partnership, Acquisition and Capacity Strategy
- 15.8 Regional Expansion Priorities
- 15.9 Short-, Medium- and Long-Term Actions
Chapter 16 Competition Outlook
- 16.1 Industry Competition Characteristics
- 16.2 Market Structure and Concentration
- 16.3 Market Share and Competitive Positioning, 2024
- 16.4 Company-Wise Revenue and Product Benchmarking
- 16.5 Production and Service Capacity Benchmarking
- 16.6 Technology, Pricing and Differentiation
- 16.7 Regional Footprint and Distribution Strength
- 16.8 Mergers, Acquisitions and Strategic Alliances
- 16.9 New Entrants and Competitive Threats
- 16.10 Porter's Five Forces and Industry Attractiveness
- 16.11 Competitive Outlook, 2024-2032
Chapter 17 Company Profiles
- 17.1 Company Coverage and Selection Criteria
- 17.2 Leading Market Participants – Standard Profile Structure
- 17.2.1 Business Description
- 17.2.2 Company Ownership and Geographic Presence
- 17.2.3 Product and Service Portfolio
- 17.2.4 Manufacturing and Operating Footprint
- 17.2.5 Production Capacity and Expansion Plans
- 17.2.6 Financial Performance and Investment
- 17.2.7 Market Share and Competitive Position
- 17.2.8 Technology and Innovation Capabilities
- 17.2.9 Strategic Alliances or Partnerships
- 17.2.10 Recent Developments
- 17.2.11 Growth Strategy and Outlook
- 17.3 Other Relevant Market Participants
Note: Every listed company is profiled on the structure shown under the first company. The company list is preliminary and may change based on research findings, market developments, data availability and client requirements.
Chapter 18 Disclaimer
- 18.1 Research and Forecast Disclaimer
- 18.2 Data Source and Estimation Limitations
Note: The depth of individual sections depends on data availability for this market. Volume, capacity, trade and other unit-based metrics are included where applicable.