
Stalls still set the price of India's favorite dumpling
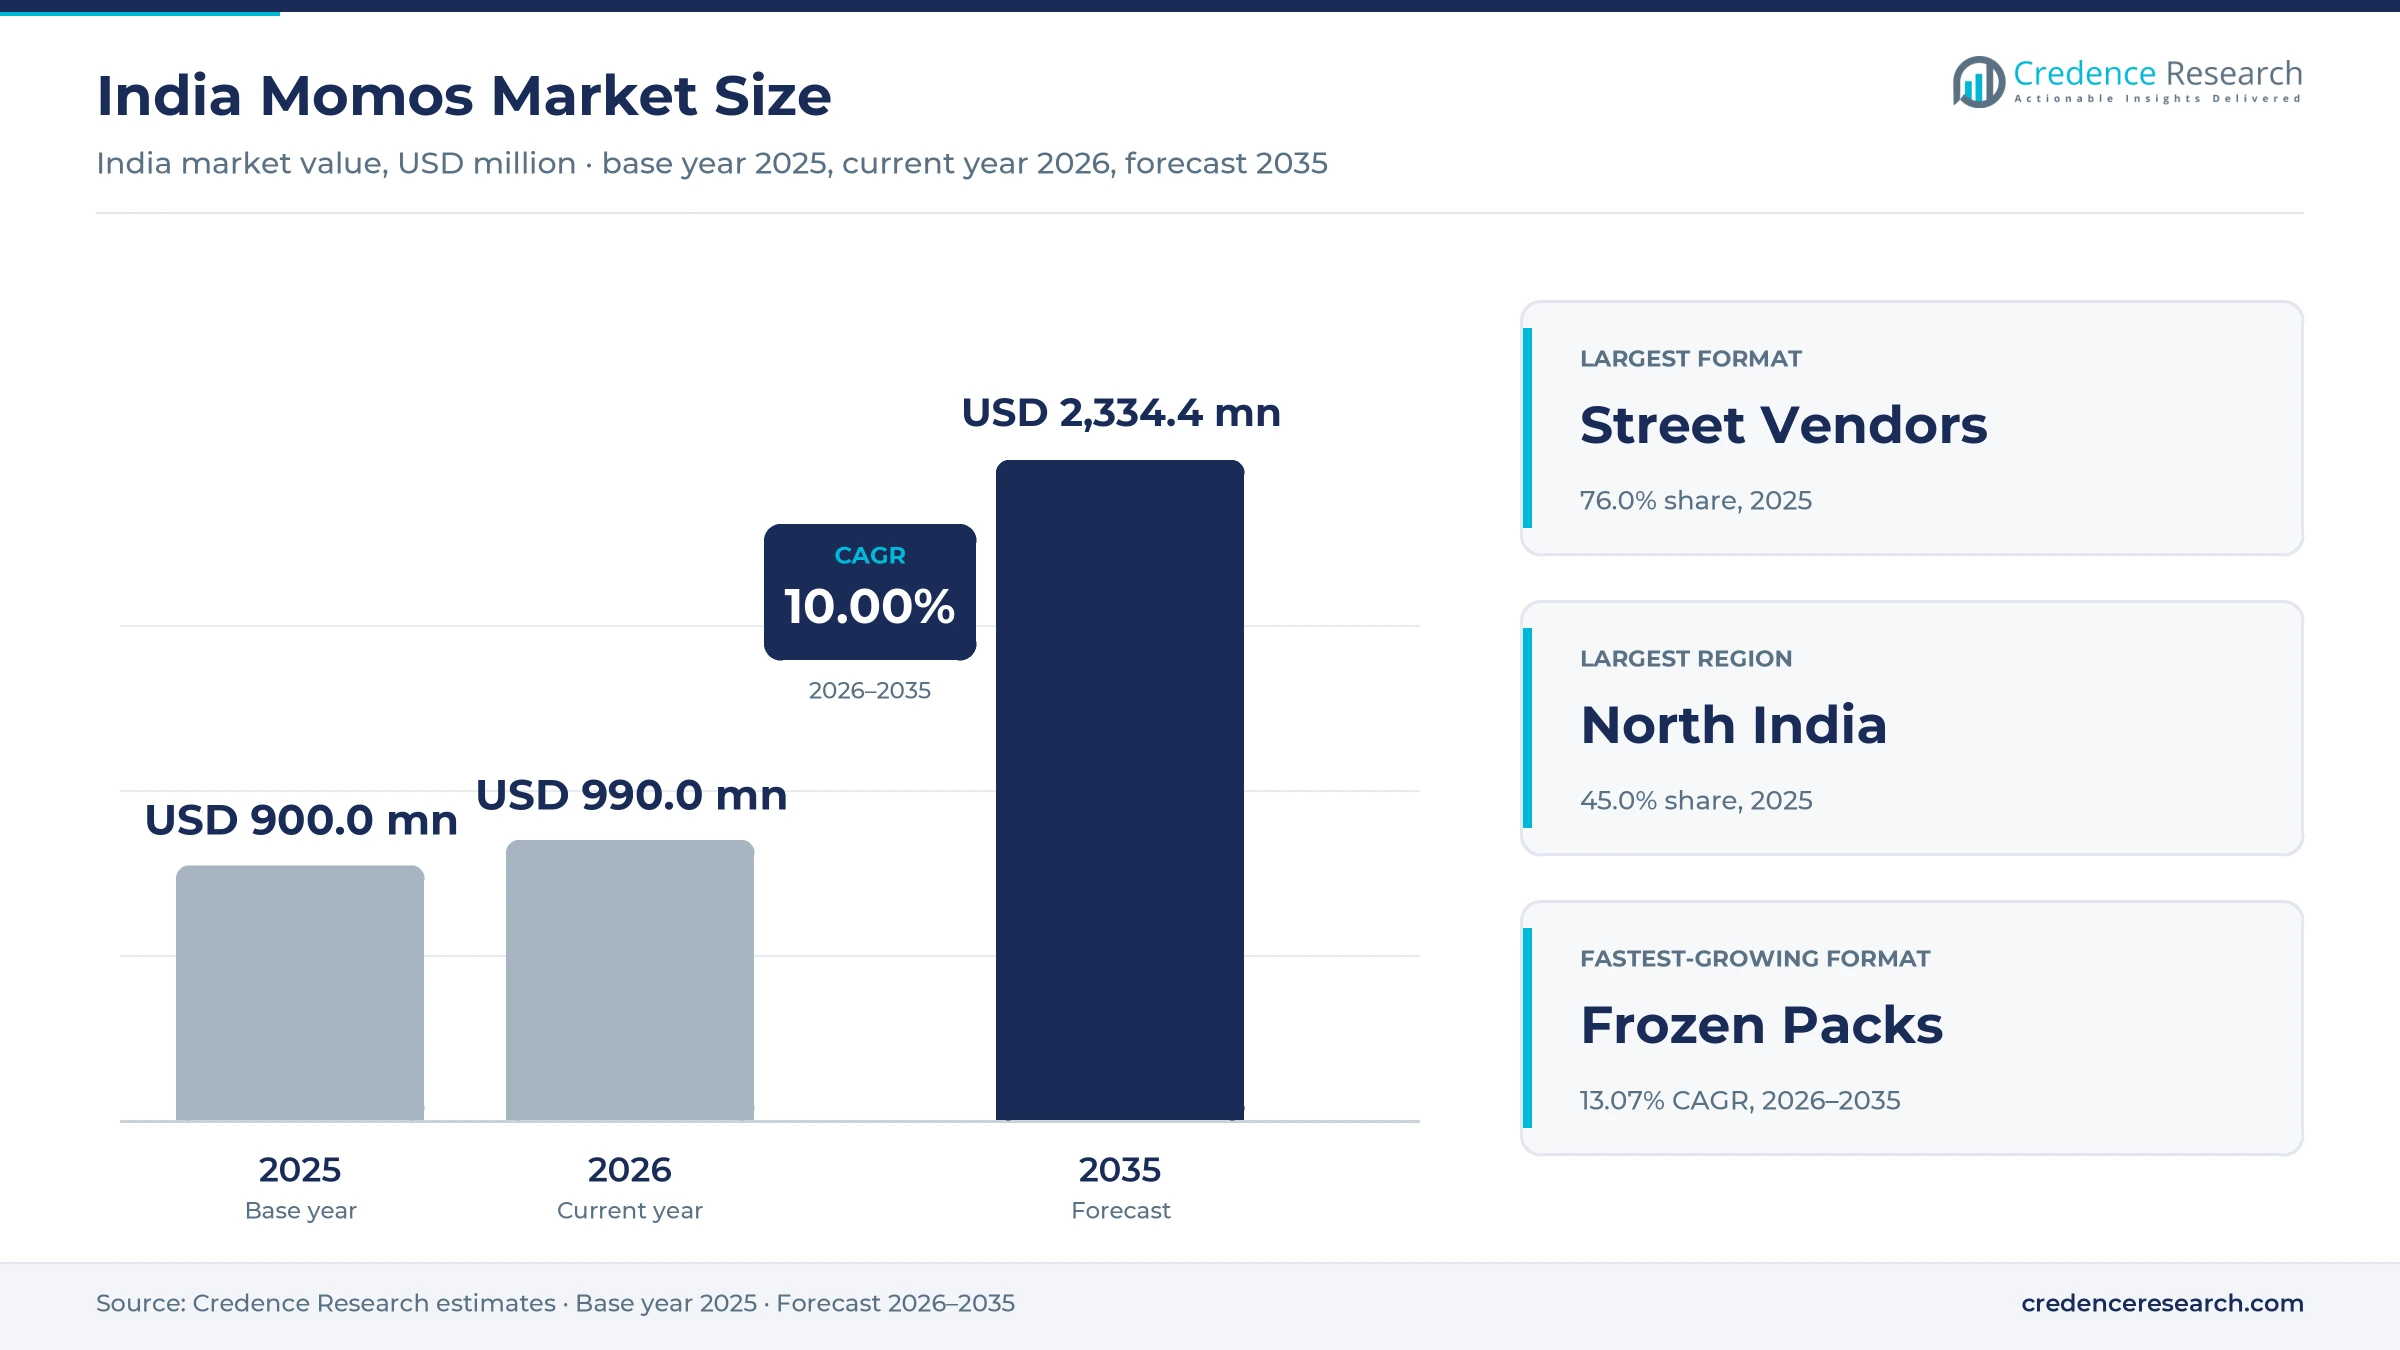
The India momos market was valued at USD 900.0 million in 2025 and is projected to increase from USD 990.0 million in 2026 to USD 2.33 billion by 2035, registering a CAGR of 10.00% during 2026–2035. Demand rests on low plate prices at stalls, chain rollouts into smaller cities, delivery apps and frozen packs sold through quick commerce. North India held the largest regional share, 45.0% in 2025, because Delhi and its neighbors built the habit early and hold the densest stall and delivery base. South India is the fastest-growing region at 10.63% a year as chains and frozen brands push into Bengaluru, Hyderabad and Chennai. Organized competition also changed in February 2025, when ITC agreed to buy Prasuma in stages, and in March 2026, when Licious entered with a meat-led range. Street vendors still account for most of the value, yet packaged formats are growing from a small base.
What does the India momos market count and how do buyers purchase?
The market counts consumer spending on momos sold by street vendors and kiosks, quick-service chains and cloud kitchens, plus frozen packs sold through retail and quick-commerce apps. Stall buyers treat a plate as a quick snack, and college crowds keep Kolkata stalls near Jatin Das Metro station busy, while frozen packs serve households that own a freezer.
The estimate excludes dim sum served in fine dining, other frozen snacks and exports by Indian producers. The value chain runs from flour, vegetable and chicken suppliers through commissary kitchens and contract makers to stalls, outlets and freezers, and many vendors now buy ready-made raw momos from small wholesale units.
India Momos Market Insights
- The India momos market grows from USD 900.0 million in 2025 to USD 2.33 billion by 2035, a 10.00% CAGR, with organized chains and frozen packs taking share from stalls.
- North India held 45.0% of 2025 value, supported by the Delhi region, which Zomato data show as its largest order market at 15% of orders.
- Street Vendors led format with 76.0% of 2025 value, because a stall plate near Rs 60 undercuts branded alternatives by a wide margin in most cities.
- Consolidation began in February 2025, when ITC agreed to buy Prasuma for about Rs 131 crore for an initial 43.8% stake, with full ownership targeted by June 2028.
- Wow Momo moved from 700 stores in June 2025 to more than 900 by October 2026, which makes store-level consistency the main competitive test in the category.
Street stalls lead while frozen packs grow fastest
Why do street vendors hold the largest share of value?
Based on format, the market is categorized into street vendors, QSR chains and frozen packs. Street Vendors led with 76.0% of 2025 value because stalls set a price few chains can match, and The Telegraph reported in September 2024 that Kolkata stalls charged Rs 60 for five or six chicken steamed momos. Licious said in March 2026 that over 90% of momos consumption remains unorganized, a volume view that runs above value share because street plates sell for less. Frozen Packs grow fastest at 13.07% a year as Wow Momo packs reached over 6,000 touchpoints in more than 450 cities by April 2026, according to Restaurant India.
Why does steamed remain the core type as tandoori grows?
Based on type, the market is categorized into steamed, fried and tandoori momos. Steamed led with 58.0% of 2025 value because the steamer pot remains the basic vendor kit, and The Sangai Express reported in January 2022 that Dolma Tsering built her Delhi business from one steamer on a plastic stool in 1994. The Telegraph described fried and pan-fried versions in September 2024 as Indian innovations on that base. Tandoori momos grow fastest at 11.20% a year as chains widen menus for repeat buyers, and Deccan Chronicle reported in July 2025 that Wow Momo counts tandoori variants among its product experiments.
How do metros, northern cities and the east differ?
Based on demand cluster, the market is categorized into metros, north, east and others, where north excludes the Delhi region and others covers smaller southern, western and central cities. Metros led with 44.0% of 2025 value because delivery concentrates there, and Business Standard reported in July 2023 that eight cities produced over 55% of Zomato orders. North cities grow fastest at 10.55% a year as Wow Momo points its 150 to 200 fiscal 2027 stores at tier-2 and tier-3 markets, with a Meerut outlet on Mawana Road reported by Indian Retailer in January 2026.
| Segment Group | Leading Sub-segment | Share, 2025 | Fastest-growing Sub-segment | CAGR, 2026–2035 |
|---|---|---|---|---|
| By Format | Street Vendors | 76.0% | Frozen Packs | 13.07% |
| By Type | Steamed | 58.0% | Tandoori | 11.20% |
| By Demand Cluster | Metros | 44.0% | North | 10.55% |
Request a Free Sample
Fill in your details and we'll send you a free sample report.
- Sample data tables & charts
- Research methodology
Low plate prices and chain rollouts are lifting sales
Affordable snack demand adds outlets and kiosks
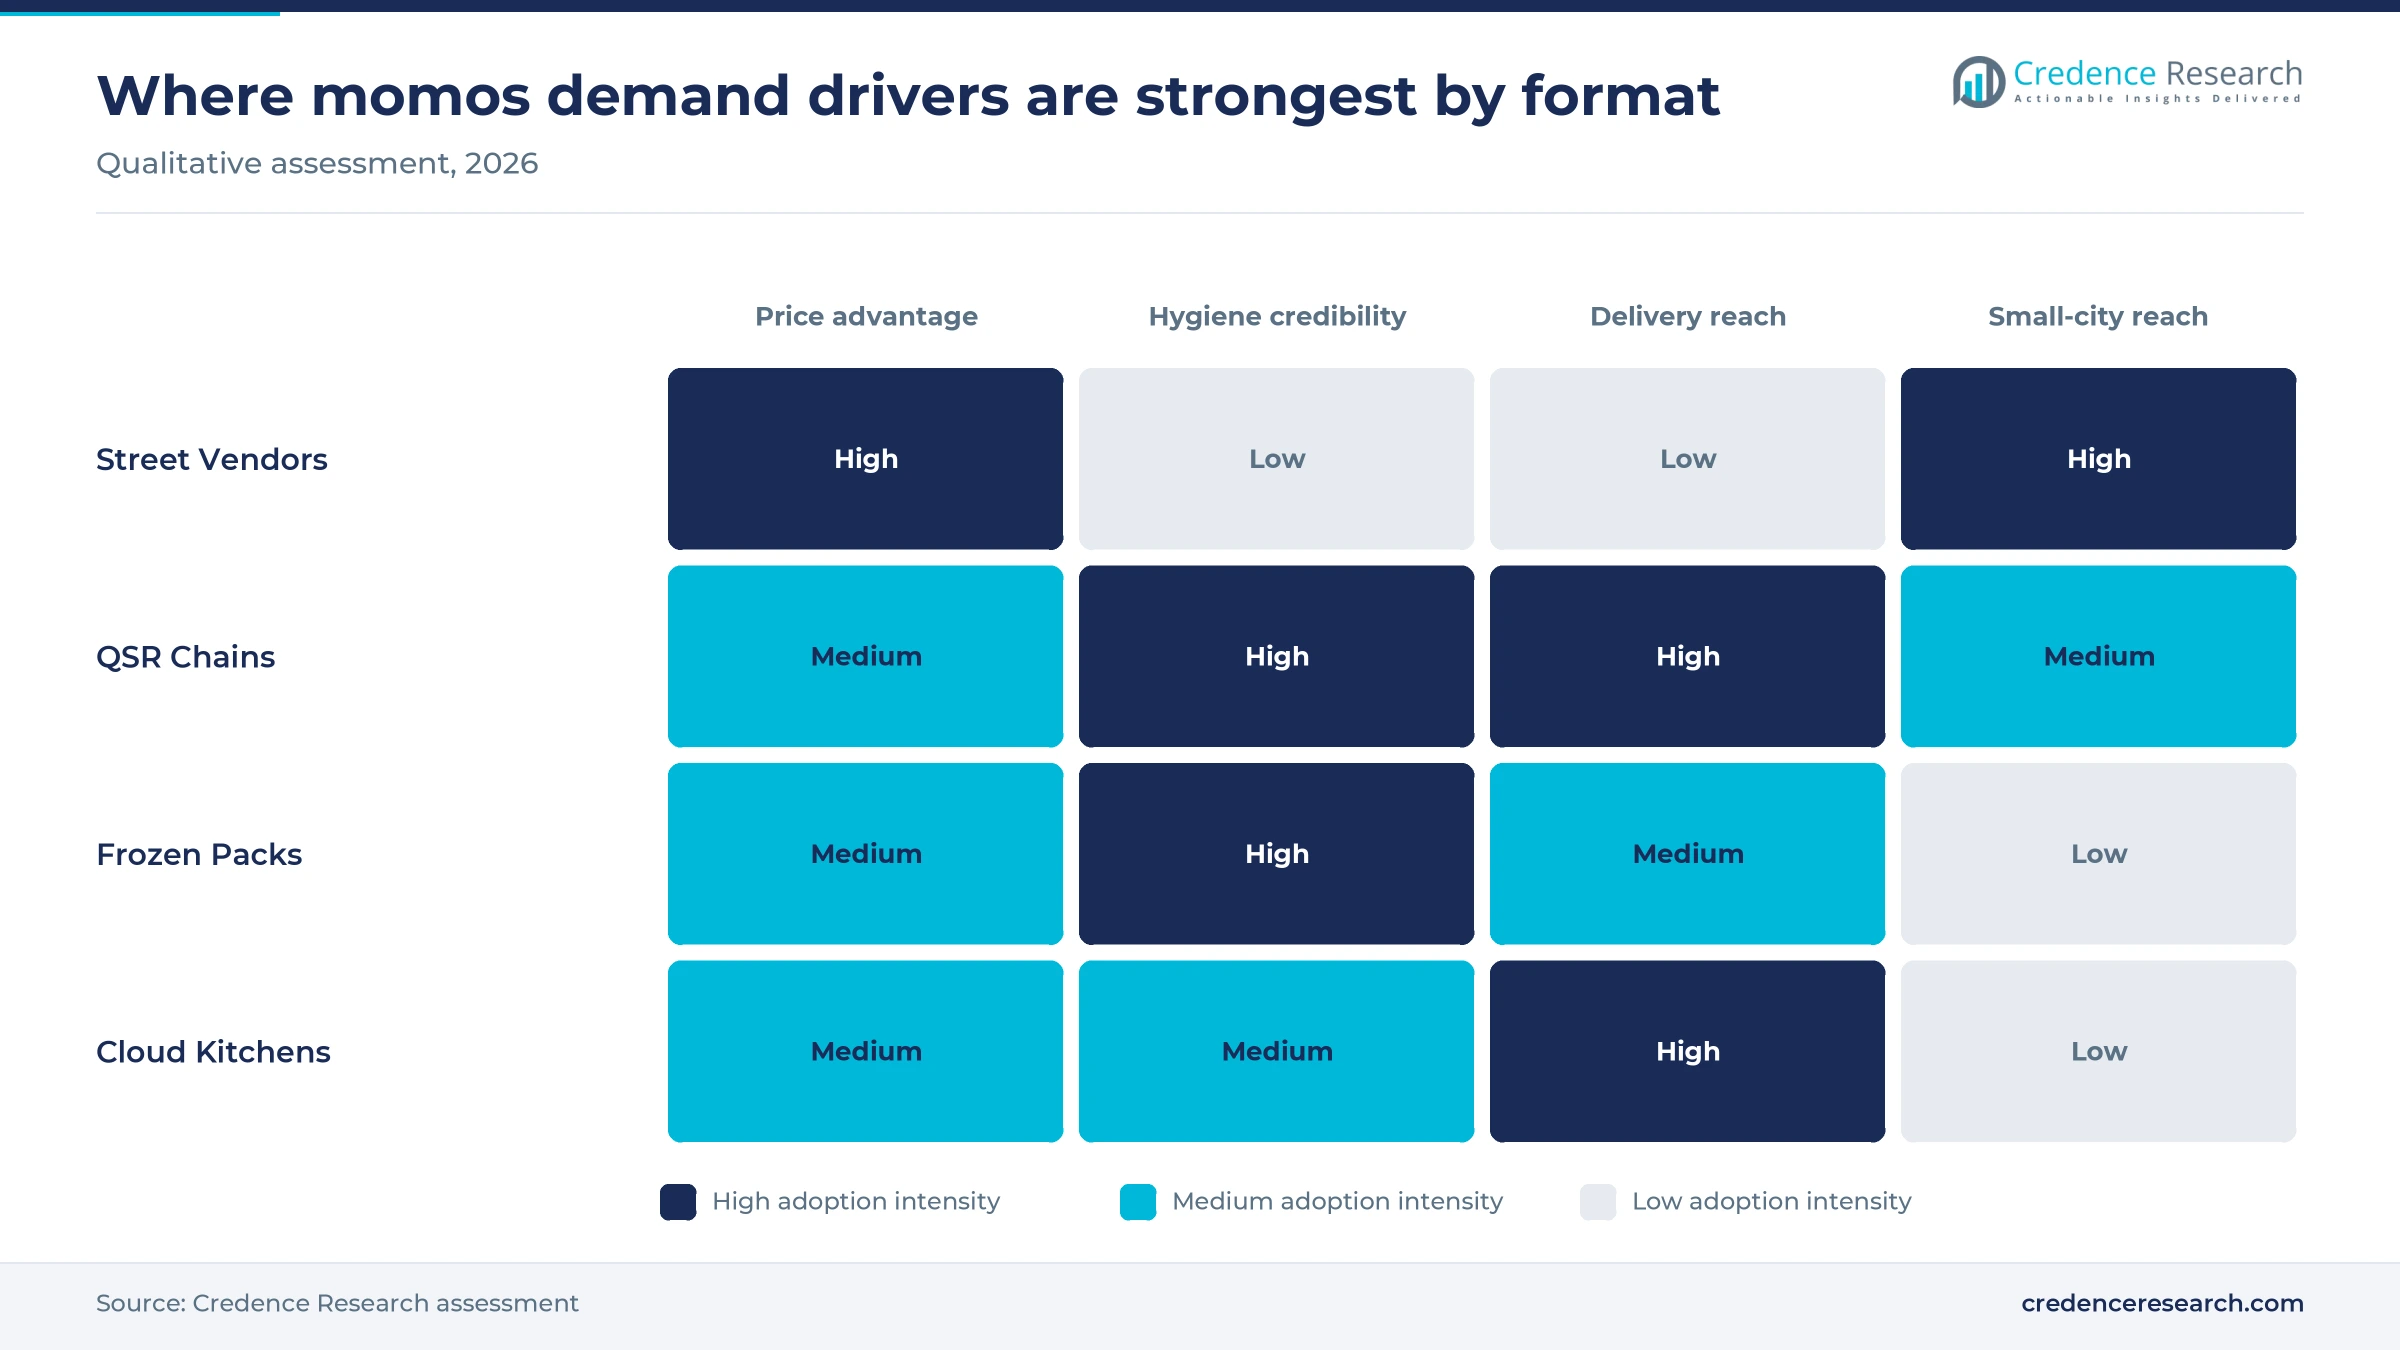
A plate of momos costs little enough to be a daily purchase, and that low entry price keeps new stalls and kiosks opening in most Indian cities. The Telegraph reported in September 2024 that Kolkata stalls charged Rs 60 for five or six chicken steamed momos, while Licious priced its branded packs from Rs 199 in March 2026. Spending supports the habit, since MoSPI found that urban households spent 11.09% of monthly outlay on beverages, refreshments and processed food in 2023-24. In addition, the Union Cabinet approved a Rs 7,332 crore outlay for about 1.15 crore street vendors on Aug. 27, 2025, with first loans raised to Rs 15,000. In the Credence Research model this adds about 3.7 percentage points to annual growth to 2035.
Quick-service chains standardize and widen distribution
Chains convert a loosely made street snack into a consistent product, which opens malls, food courts and smaller cities that stalls serve unevenly. Restaurant India reported in April 2026 that Wow Momo opened 200 stores in fiscal 2026 and passed 850 outlets across more than 90 cities, adding 40 cities in the year. The same publication counted more than 900 stores in over 100 cities by Oct. 26, 2026, and The Telegraph put its output at 10 lakh momos a day in 2024. This expansion also feeds the wider quick-service restaurant sector, although Street Vendors still held 76.0% of 2025 value. In the Credence Research model this adds about 2.7 percentage points to annual growth to 2035.
Food delivery platforms lift off-premise order volumes
Delivery apps move momos beyond the evening street stop, which raises order frequency and brings neighborhood kitchens to new buyers. YourStory reported in December 2021 that over 10.6 million people ordered momos on Zomato that year, more than vada pav and samosas combined. The Telegraph counted 173 Kolkata outlets offering momos on food apps in September 2024, close to the 177 offering biryani. Supply has followed, since ITC listed 40 Prasuma Momo Kitchen cloud kitchens in January 2026, and the growth of online food delivery keeps widening this reach. In the Credence Research model this adds about 2 percentage points to annual growth to 2035.
Quick commerce puts frozen packs within minutes of homes
Quick-commerce dark stores now carry freezers near urban buyers, which removes the main barrier that long held back packaged momos. Upstox reported on Oct. 26, 2026, that Blinkit reached 2,751 stores from 1,816 a year earlier, while Instamart grew to 1,240 from 1,025. Producers are responding, because Restaurant India said in April 2026 that Wow Momo packaged sales were doubling year on year through Blinkit, Zepto and Instamart among other channels. ITC agreed in February 2025 to acquire Prasuma, giving the group a momos range alongside its other frozen food lines, and Frozen Packs grow at 13.07% a year as a result.
Clean labels and frozen stock are reshaping the category
Shift toward clean-label and better-for-you momos
Brands are competing on ingredients, because hygiene doubts about street products leave room for a premium promise. Storyboard18 reported that Licious launched four meat-based variants on March 29, 2026, with no MSG, soya fillers, palm oil or added preservatives, sold in eight cities online. BW Retail World reported on June 24, 2025, that Wow Momo introduced gluten-free momos made with a quinoa and chickpea blend across 11 metro cities. FoodTechBiz noted in February 2025 that Prasuma positions its frozen momos as preservative-free. These launches sit at higher price points than stalls, so the shift mostly benefits Frozen Packs and chain menus rather than vendors.
Rise in frozen stocking after the 2026 LPG squeeze
The March 2026 cooking-gas shortage pushed some kitchens and households toward products that need less preparation. Business Today reported on March 11, 2026, that India imports roughly 62% of its LPG, with households prioritized over commercial users as Hormuz shipping was disrupted. Restaurant India reported on April 1, 2026, that Wow Momo packaged momos and cup noodles grew 20% to 30% month on month, which the company linked to that crisis. The overlap with instant noodles shows how quickly shoppers compare convenience options. Officials said the shortage might not last long, Business Today reported, so it remains uncertain whether this demand will hold.
Opportunity in tier-2 and tier-3 organized outlets
Smaller cities offer an opening, because stalls have already built the habit while branded outlets remain thin there. BW Retail World reported on April 10, 2026, that Wow Momo plans 150 to 200 outlets in fiscal 2027 with a focus on tier-2 and tier-3 markets. Verdict Foodservice reported on June 11, 2025, that the chain targets 1,500 stores by 2028, up from about 700 then. Indian Retailer also reported a Meerut opening in January 2026, and Storyboard18 said ITC Master Chef reaches 200-plus towns. Local franchise operators could take similar sites, since the North demand cluster grows at 10.55% a year.
Opportunity in wholesale raw momos and export packs
Wholesale production offers an opening, because restaurants and cafes would rather buy consistent momos than staff a folding line. ANI carried a company announcement on Jan. 22, 2026, that Kafe Group Vietnam invested $1.2 million in Noida wholesaler Momos Pro, doubling output to 100,000 pieces a day at prices from Rs 4.5 a piece. Restaurant India reported on Oct. 26, 2026, that Wow Momo packs now sell in 14 countries through partners including LuLu Group and Noon, and it plans a first Sri Lanka outlet by year-end. The same plants also supply India's ready-to-eat food lines, though export value sits outside this estimate.
Hygiene raids and LPG shocks test the supply base
Hygiene raids damage trust in street and small-unit supply
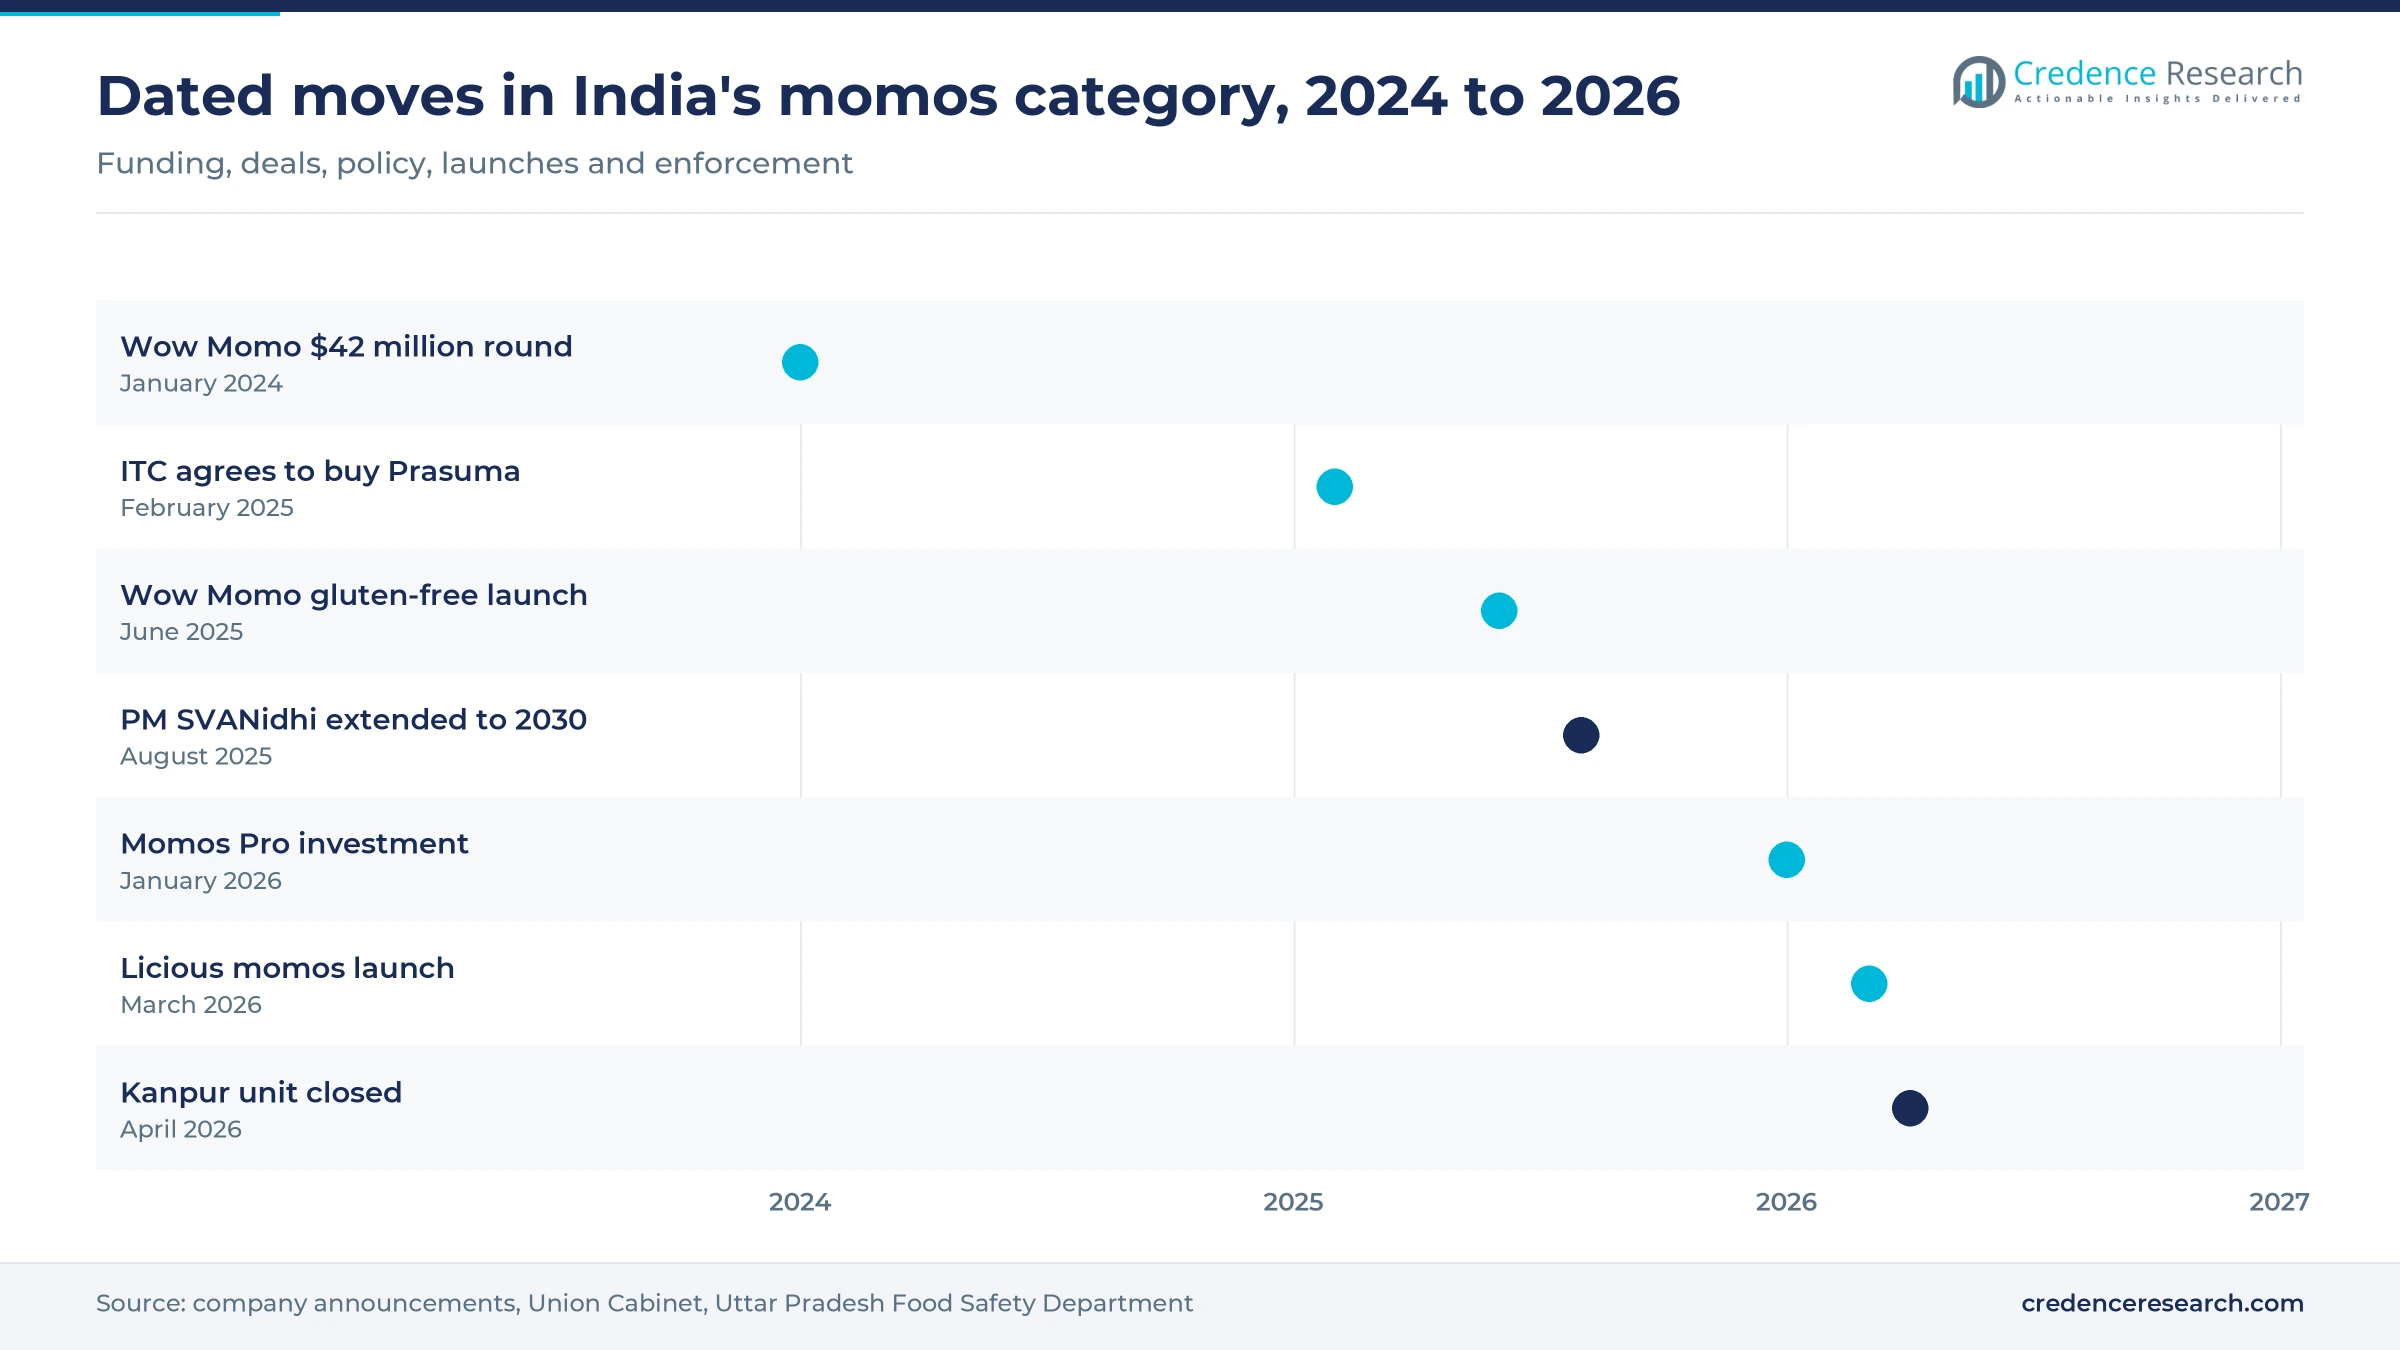
Enforcement actions keep food safety in the headlines, and they shape how buyers judge the category. Asianet Newsable reported that the Uttar Pradesh Food Safety Department closed a Kanpur unit on April 25, 2026, destroying 20 kg of momos and 20 liters of colored chutney. NewsDrum also reported an unlicensed Indore plant closed over excess Ajinomoto. Small wholesale units and the stalls they supply carry the most exposure, while licensed makers can turn audits and labels into a selling point.
LPG shocks raise risk for stalls and chain kitchens
Steaming and frying depend on gas, so fuel disruption stops sales immediately at most small sellers. Business Today reported on March 11, 2026, that India imports about 62% of its LPG, and that restaurants, hotels and small food businesses were hit hardest, while distributors in Mumbai, Bengaluru, Delhi, Chennai and Hyderabad struggled to keep cylinders in stock. Vendors have little buffer against such a stoppage, since commercial users rank behind households for supply. Chains can reduce this risk with electric steamers, although that means new equipment spending at each outlet.
Freezer reach limits frozen packs outside large cities
Packaged momos need an unbroken cold chain, which remains thin beyond larger towns. Prasuma CEO Lisa Suwal told Restaurant India in September 2021 that packs last nine months only when stored at or below minus 18 degrees Celsius. Wow Momo reported over 6,000 touchpoints across more than 450 cities in April 2026, or only about 13 a city on average. Producers must therefore fund freezers or depend on dark stores, which raises distribution costs and slows entry into smaller towns.
Thin vendor finance slows upgrades at stalls
Most stall owners have little capital for better equipment, licensed kitchens or cold storage. The restructured PM SVANidhi scheme approved on Aug. 27, 2025, offers loans of Rs 15,000, Rs 25,000 and Rs 50,000 in successive tranches, according to The Tribune. That sum can fund a cart or steamer but rarely a licensed production unit. As a result, many sellers continue buying from small wholesale makers, although FSSAI hygiene training under the scheme may gradually raise standards for food vendors.
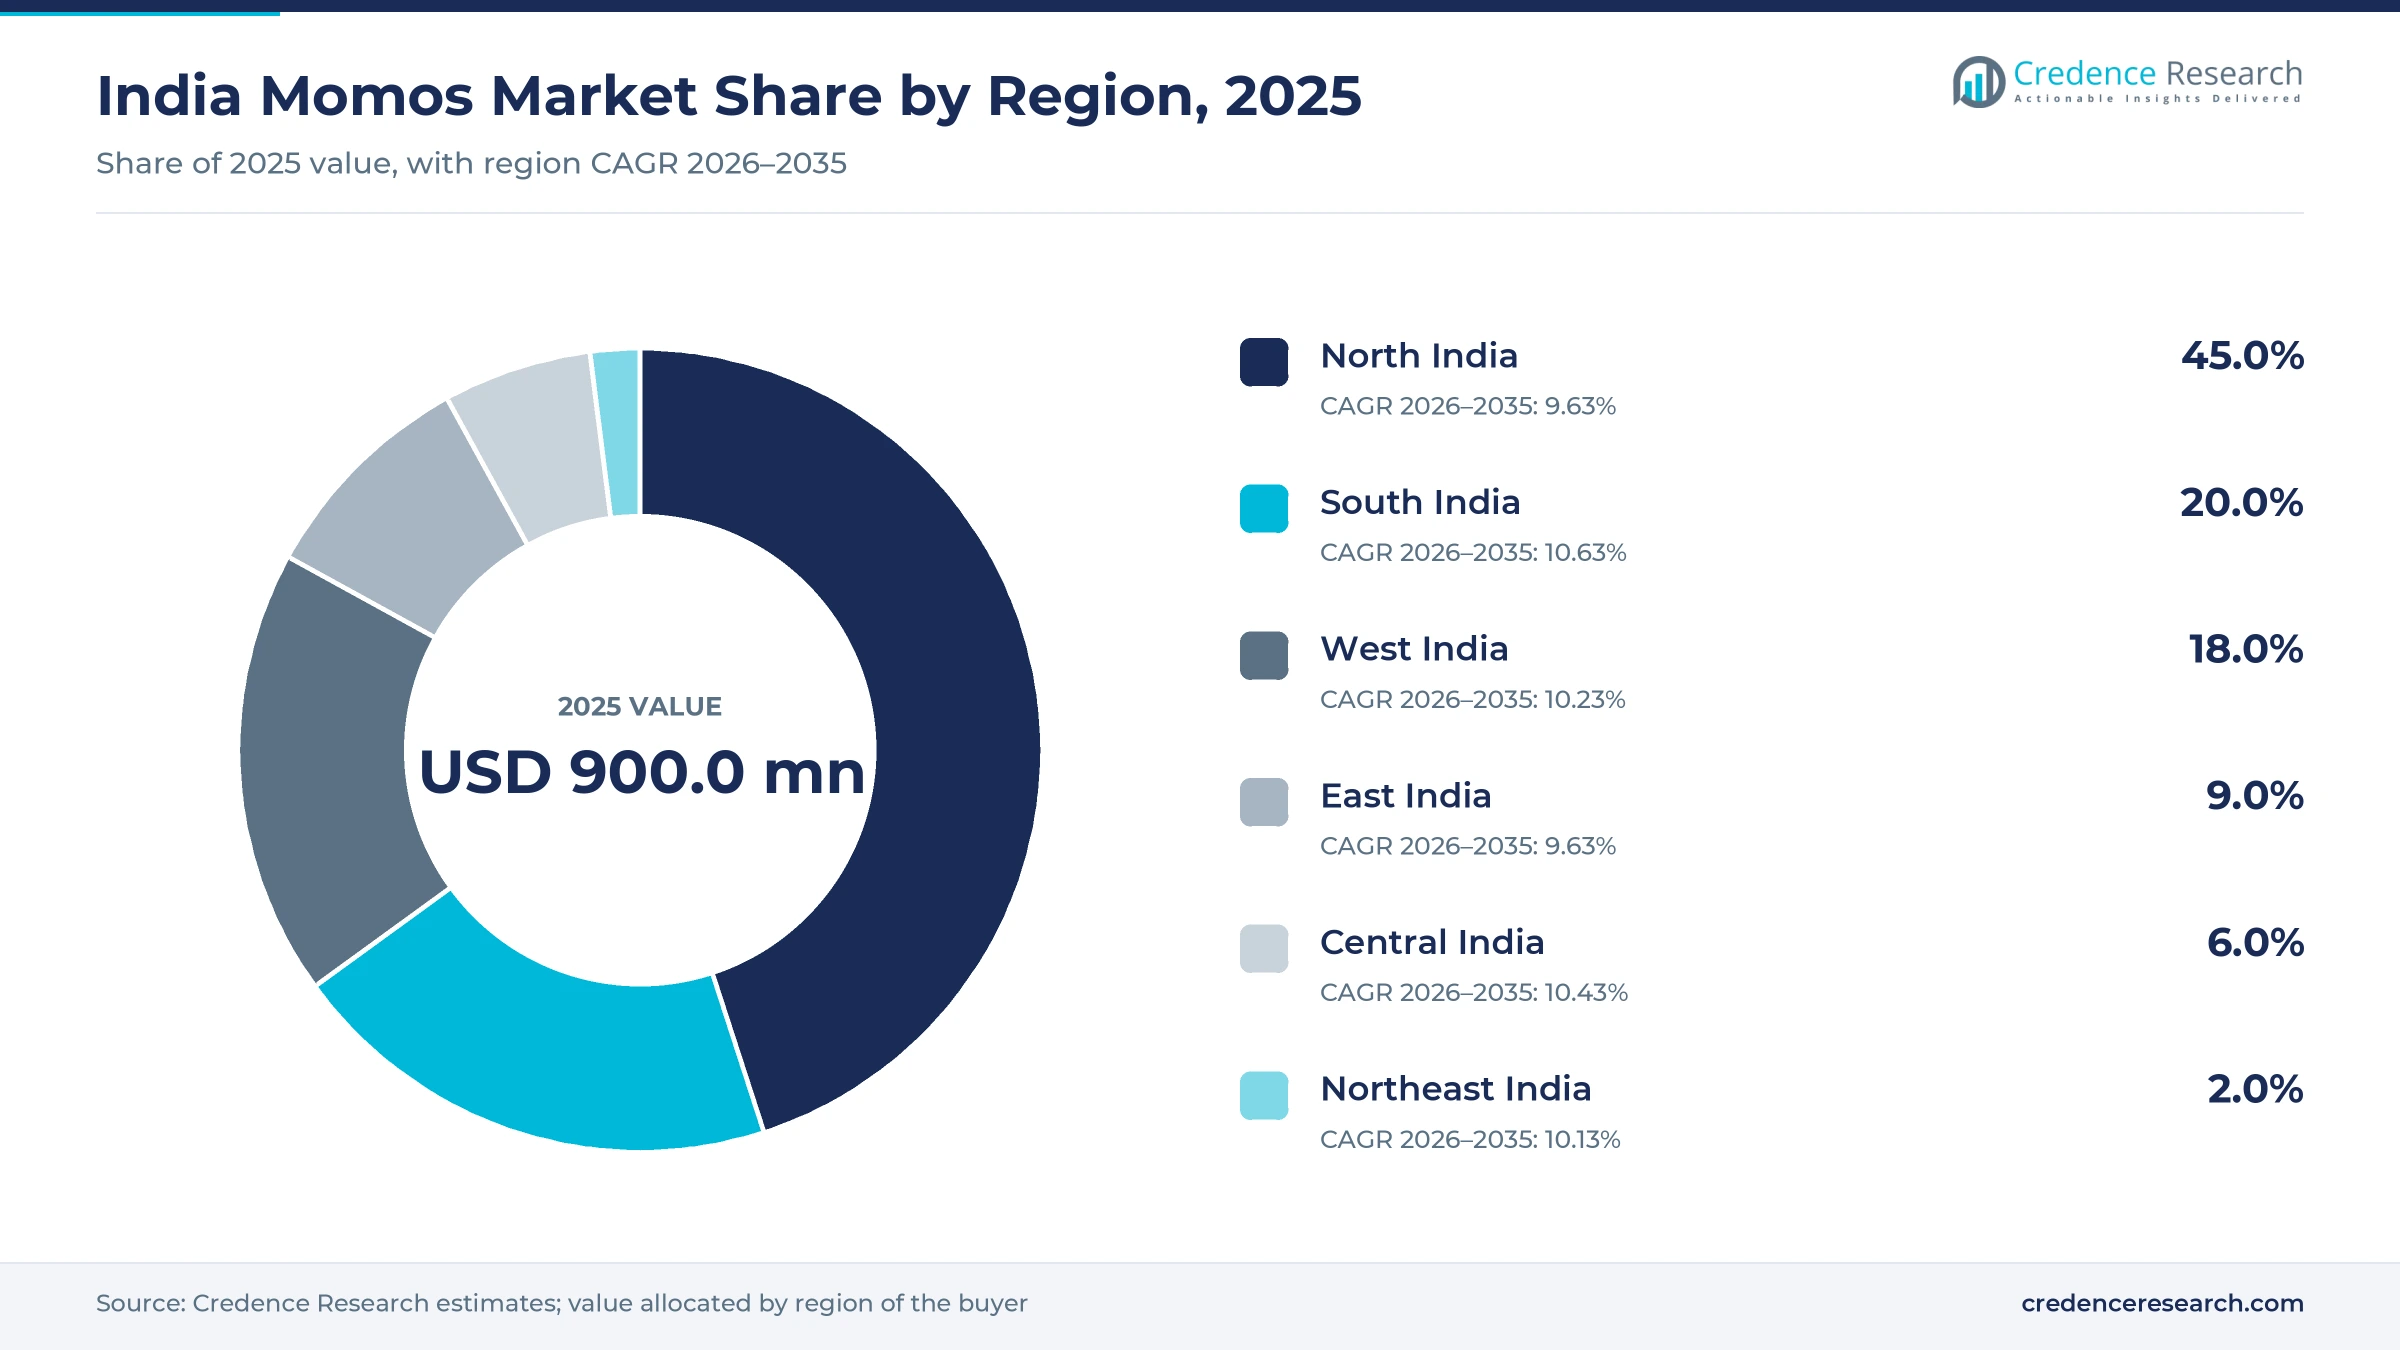
North India leads while South India grows fastest
| Region | Value, 2025 (USD million) | Share, 2025 | CAGR, 2026–2035 |
|---|---|---|---|
| North India | 405.0 | 45.0% | 9.63% |
| South India | 180.0 | 20.0% | 10.63% |
| West India | 162.0 | 18.0% | 10.23% |
| East India | 81.0 | 9.0% | 9.63% |
| Central India | 54.0 | 6.0% | 10.43% |
| Northeast India | 18.0 | 2.0% | 10.13% |
North India leads through the Delhi region's dense stall base
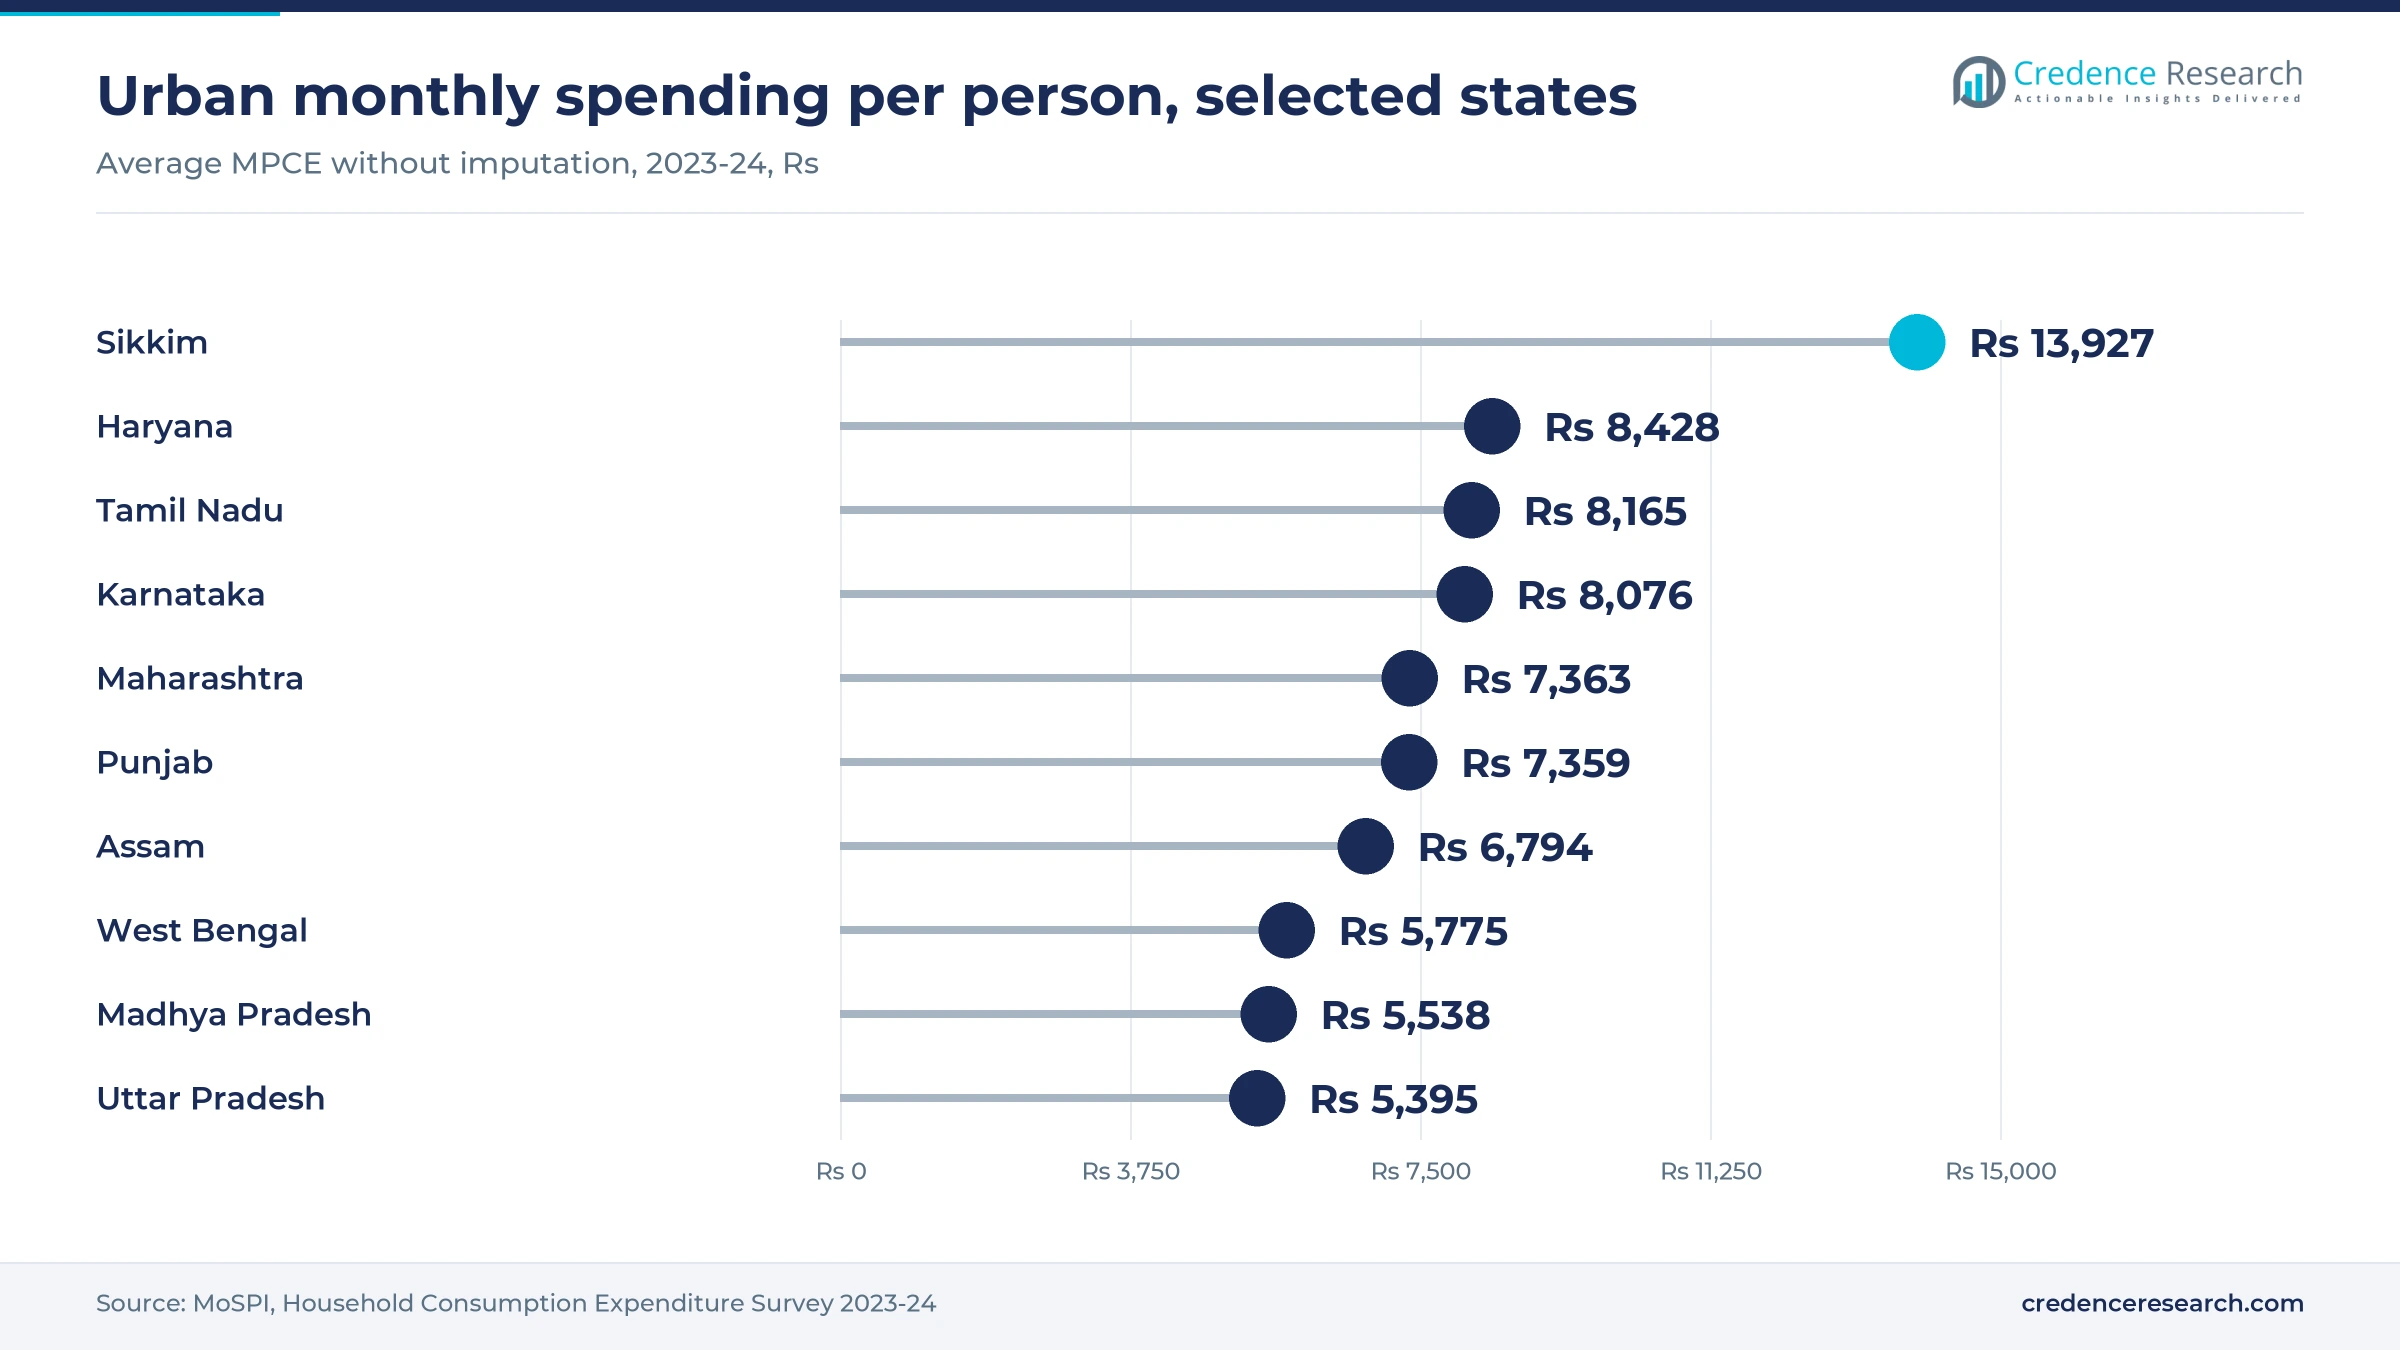
North India held 45.0% of 2025 value and grows at 9.63% a year, the largest but a slower-growing base. Business Standard reported in July 2023 that NCR generated 15% of Zomato orders, the largest city share. Delhi also supports names such as Dolma Aunty Momos, with four outlets and Noida wholesaler Momos Pro, which supplies Gurgaon, Faridabad and Ghaziabad. MoSPI puts urban monthly spending at Rs 8,428 per person in Haryana and Rs 7,359 in Punjab, which supports frequent snack purchases.
South India grows fastest as chains and frozen brands arrive
South India held 20.0% of 2025 value and is the fastest region at 10.63% a year. Bengaluru generated 11% of Zomato orders in the July 2023 Business Standard report, while Licious opened with its own stores in Bangalore in March 2026. Wow Momo also runs a focused general-trade rollout in Karnataka, according to Restaurant India. Urban spending of Rs 8,165 per person in Tamil Nadu and Rs 8,076 in Karnataka, on MoSPI data, gives chains room to price above stalls.
West India builds on Mumbai and Pune delivery demand
West India held 18.0% of 2025 value and grows at 10.23% a year, slightly ahead of the national pace in the model. Mumbai generated 9% of Zomato orders in the July 2023 Business Standard report, and Pune sits among the eight cities in that data. Licious placed its only other retail launch stores in Mumbai in March 2026. MoSPI records urban monthly spending of Rs 7,363 per person in Maharashtra, above the national urban average of Rs 6,996.
East India has the longest chain history but slower growth
East India held 9.0% of 2025 value and grows at 9.63% a year, reflecting a mature habit in Kolkata. The Telegraph traced the city's stall culture to Bhowanipore in the 1980s, and Wow Momo began with one Kolkata outlet in 2008. Restaurant India reported general-trade distribution in West Bengal in April 2026. Lower urban spending of Rs 5,775 per person in West Bengal, on MoSPI data, keeps most sales at stall prices and limits premium formats.
Central India relies on stall prices and small wholesale units
Central India held 6.0% of 2025 value and grows at 10.43% a year from a small base. Urban spending is modest, at Rs 5,538 per person in Madhya Pradesh and Rs 4,927 in Chhattisgarh on MoSPI data, so stall pricing dominates. NewsDrum's report of an unlicensed Indore plant supplying several fast food sellers shows how far wholesale supply has already spread there, which also leaves room for licensed makers.
Northeast India keeps a strong habit in a small value pool
Northeast India held 2.0% of 2025 value and grows at 10.13% a year, because a long-established habit sits on a small urban population. The Telegraph notes that momos spread through Darjeeling, Kalimpong and Sikkim from Nepali and Tibetan communities. Urban spending of Rs 13,927 per person in Sikkim is the highest in the MoSPI list used here, while Assam stands at Rs 6,794, yet few organized chains report outlet numbers in the zone.
Deals, launches and raids that shaped 2024 to 2026
| Development | Status and market relevance |
|---|---|
| In January 2024, Wow Momo closed a $42 million round from Khazanah Nasional and OAKS Asset Management, as Deccan Chronicle later reported. | Completed; funded store growth and manufacturing |
| In February 2025, ITC agreed to buy Prasuma, paying about Rs 131 crore for an initial 43.8% stake with full ownership targeted by June 2028. | Staged deal; adds momos to ITC frozen range |
| In August 2025, the Union Cabinet extended PM SVANidhi to 2030 with larger loans and FSSAI training for food vendors. | In effect; supports stall working capital and hygiene |
| In January 2026, Kafe Group Vietnam invested $1.2 million in Noida wholesaler Momos Pro, according to a company announcement carried by ANI. | Company-reported; output to double to 100,000 pieces a day |
| In March 2026, Licious launched four meat-based momos from Rs 199 in eight cities online. | Live; raises premium competition |
Steam lines and freezing decide scale and consistency
- Automated forming lines allow makers such as Momos Pro to report output of up to 100,000 pieces a day with a consistent wrapper and filling weight.
- Modern freezing lets Prasuma hold packs for up to nine months at or below minus 18 degrees Celsius, which makes national distribution possible.
- Commissary kitchens supply satellite outlets and cloud kitchens with prepared momos, which reduces skill needs and hygiene variation at the store level.
- Electric steamers reduce exposure to LPG shortages such as the March 2026 disruption, although each outlet must fund the equipment and power load.
Need a Custom Version of This Report?
Tailor the scope, geography, or segments to your exact requirements.
- Custom geography or segment scope
- Direct access to our analyst team
One large chain faces a long tail of local vendors
Competition is split between one large national chain, a few packaged brands and a very long tail of stalls and small wholesale makers. Wow Momo has the widest branded footprint, with more than 900 stores in over 100 cities reported in October 2026, and it also sells packs through retail and quick commerce. ITC now holds a stake in Prasuma, with full ownership targeted by June 2028, alongside ITC Master Chef, pairing a momos specialist with a distribution network that reaches 200-plus towns. Licious brings a meat-sourcing story and clean-label claims to the premium end. Momos Pro represents wholesale makers selling raw product to cafes and restaurants, while family names such as Dolma Aunty Momos compete on local reputation. Stalls compete on price and location rather than brand, and most do not publish any operating data. Companies therefore compete on hygiene claims, freezer access and outlet locations, rather than on price alone.
Companies profiled and their roles in this market
| Company | Type | Role in the market |
|---|---|---|
| Wow! Momo Foods | QSR chain and packaged brand | More than 900 stores in over 100 cities; packs in over 450 cities |
| Prasuma | Frozen brand and cloud kitchens (ITC) | Frozen momos in 100-plus cities; 40 Momo Kitchen sites |
| ITC Master Chef | Frozen foods brand | ITC frozen range of 50-plus products in 200-plus towns; momos come through Prasuma |
| Licious | Premium meat brand | Four meat-based momos from Rs 199, launched March 2026 |
| Momos Pro | Wholesale maker | Noida unit supplying NCR restaurants and cafes |
| Dolma Aunty Momos | Local chain | Four Delhi outlets; business began in 1994 |
| Local Vendors | Stalls and kiosks | Largest value share, sold at about Rs 60 a plate in Kolkata |
Trust and freezer reach will decide the next leaders
Credence Research's view is that the category is moving from a price contest toward a trust contest. Stalls will keep most of the value for years because no chain can match a Rs 60 plate. However, the Kanpur closure in April 2026 and the clean-label launches show that hygiene has become the point at which organized sellers can charge more. The most useful question for an investor is therefore who controls freezer access and licensed production, since those assets are harder to copy than recipes.
How the momos estimates were built
The report uses 2025 as the base year and forecasts to 2035. Market values in this report come from the Credence Research market model. Format, type, demand cluster and regional splits are Credence Research estimates, informed by company announcements, government statistics such as the MoSPI consumption survey, and trade and news reports opened during preparation. No audited national figure for momos sales exists, and most stall sales are unrecorded, so the estimate carries a wide margin. No interviews or primary surveys were conducted for this report at any stage.
Organized formats gain share through 2035
The market is expected to reach USD 2.33 billion by 2035, growing at 10.00% a year from USD 990.0 million in 2026. Stalls will remain the largest format, although their share falls as Frozen Packs and chain outlets gain in cities with dependable freezers. The largest uncertainties are repeated fuel shocks, tighter food-safety enforcement and how many stall owners move to licensed wholesale supply. That growth path assumes that frozen and chain formats keep outpacing stalls in demand through 2035. Consolidation among packaged brands looks likely after the ITC and Prasuma deal, and South India should remain the fastest-growing region on chain entry and higher urban spending.
Frequently Asked Questions
How big is the India momos market?
Which format leads the market?
Which format grows fastest?
Which type of momos is largest?
Which region holds the largest share?
Which region grows fastest?
Who are the main companies in the market?
What are the main challenges?
Table of Content
Chapter 1 Market Segmentation
- 1.1 Segmentation Framework
- 1.1.1 Product and Service Classification
- 1.1.2 Application and End-Use Classification
- 1.1.3 Technology and Solution Classification
- 1.1.4 Customer and Distribution Channel Classification
- 1.1.5 Geographic Segmentation
- 1.1.6 Market Segment Definitions and Boundaries
- 1.2 By Format
- 1.2.1 Street Vendors
- 1.2.2 QSR Chains
- 1.2.3 Frozen Packs
- 1.3 By Type
- 1.3.1 Steamed
- 1.3.2 Fried
- 1.3.3 Tandoori
- 1.4 By Demand Cluster
- 1.4.1 Metros
- 1.4.2 North
- 1.4.3 East
- 1.4.4 Others
Chapter 2 Introduction
- 2.1 Report Objectives and Scope
- 2.2 Product Definition and Industry Terminology
- 2.3 Market Inclusions and Exclusions
- 2.4 Research Process
- 2.4.1 Primary Research and Expert Interviews
- 2.4.2 Secondary Research and Source Review
- 2.4.3 Top-Down and Bottom-Up Estimation
- 2.4.4 Data Triangulation and Verification
- 2.5 Market Size Measurement Basis
- 2.5.1 2025: USD 900.0 million → 2035: USD 2.33 billion
- 2.6 Historical and Forecast Reference Periods
- 2.6.1 Historical Period: 2018-2025
- 2.6.2 Base Year: 2025
- 2.6.3 Forecast Period: 2025-2035
- 2.7 Research Assumptions and Limitations
Chapter 3 Executive Summary
- 3.1 Market Snapshot and Key Findings
- 3.2 Base-Year Market Size, 2025
- 3.3 Forecast Market Size, 2035
- 3.4 Revenue and Volume Growth Outlook
- 3.5 Key Demand and Supply Indicators
- 3.6 Leading Market Segments
- 3.7 Fastest-Growing Market Opportunities
- 3.8 Regional Performance Highlights
- 3.9 Technology and Industry Transformation
- 3.10 Competitive Landscape Summary
- 3.11 Analyst View and Strategic Implications
Chapter 4 India Momos Market Trends and Developments
- 4.1 Historical Industry Development, 2018-2025
- 4.2 Recent Market Trends and Developments
- 4.3 Demand and Customer Behavior Trends
- 4.4 Technology and Product Innovation
- 4.5 Artificial Intelligence, Automation and Digitalization
- 4.6 Local Manufacturing and Supply Chain Realignment
- 4.7 Industry Partnerships, Mergers and Acquisitions
- 4.8 Sustainability and Circular Economy Developments
- 4.9 Government and Private Sector Investment Trends
- 4.10 Emerging Business Models and Commercialization
- 4.11 Industry Developments and Announcements
Chapter 5 India Momos Market Production, Supply and Demand Analysis
- 5.1 Demand Trend and Consumption Analysis, 2018-2025
- 5.2 Demand Forecast, 2025-2035
- 5.3 Production and Output Trend, 2018-2025
- 5.4 Production and Output Forecast, 2025-2035
- 5.5 Installed Capacity and Capacity Utilization
- 5.6 Company-Wise Production Plants and Statistics
- 5.6.1 Installed Production Capacity
- 5.6.2 Actual Production
- 5.6.3 Planned Capacity and Expansion Targets
- 5.7 Supply Chain Structure and Procurement Trends
- 5.8 Supply-Demand Gap and Bottlenecks
- 5.9 Import Dependence and Sourcing Structure
- 5.10 Contract Manufacturing and Outsourcing
- 5.11 Regional Supply and Demand Concentration
Chapter 6 India Momos Market Pricing Analysis
- 6.1 Pricing Structure and Measurement
- 6.2 Historical Pricing Trends, 2018-2025
- 6.3 Pricing Outlook, 2025-2035
- 6.4 Average Selling Price and Unit Economics
- 6.5 Pricing by Product and Market Segment
- 6.6 Geographic Pricing Differences
- 6.7 Key Input, Energy, Labor and Logistics Costs
- 6.8 Contract Pricing and Purchasing Models
- 6.9 Pricing Sensitivity and Competitive Positioning
- 6.10 Price, Margin and Profitability Implications
Chapter 7 India Momos Market Dynamics
- 7.1 Market Growth Drivers
- 7.1.1 Demand-Side Drivers
- 7.1.2 Technology and Innovation Drivers
- 7.1.3 Infrastructure and Investment Drivers
- 7.1.4 Regulatory and Policy Drivers
- 7.2 Market Restraints
- 7.2.1 Cost and Affordability Constraints
- 7.2.2 Technology and Adoption Barriers
- 7.2.3 Supply Chain and Operational Constraints
- 7.3 Market Challenges
- 7.3.1 Competitive Pressure and Margin Erosion
- 7.3.2 Skills, Infrastructure and Implementation Gaps
- 7.4 Emerging Market Opportunities
- 7.5 Market Dynamics Impact and Time-Horizon Assessment
Chapter 8 India Momos Value Chain Analysis
- 8.1 Industry Value Chain Overview
- 8.2 Upstream Suppliers and Critical Inputs
- 8.3 Technology and Component Providers
- 8.4 Manufacturing or Service Delivery
- 8.5 Distribution, Channel Partners and Integrators
- 8.6 Downstream Applications and End Users
- 8.7 Value Addition and Profit Pools
- 8.8 Vertical Integration and Outsourcing
- 8.9 Supplier Concentration and Risk
- 8.10 Supply Chain Localization and Resilience
Chapter 9 India Momos Market Regulations and Policies
- 9.1 Relevant Laws, Standards and Compliance Frameworks
- 9.2 Product, Service, Safety and Quality Requirements
- 9.3 Government Policies, Incentives and Subsidies
- 9.4 Imports, Exports and Trade Barriers
- 9.5 Public Procurement and Local Content Requirements
- 9.6 Environmental and Sustainability Compliance
- 9.7 Upcoming Policy Changes and Market Implications
Chapter 10 India Momos Market Hotspots and Opportunities
- 10.1 Market Opportunity Mapping and Growth Hotspots
- 10.2 High-Growth Applications and Customer Groups
- 10.3 Underserved Markets and White-Space Opportunities
- 10.4 Emerging Technology and Product Opportunities
- 10.5 New Capacity and Investment Hotspots
- 10.6 Market Entry and Expansion Opportunities
- 10.7 Distribution and Partnership Opportunities
- 10.8 Near-Term and Long-Term Commercial Potential
- 10.9 Opportunity Attractiveness and Execution Risks
Chapter 11 India Momos Market Outlook, 2025-2035
- 11.1 Market Size and Analysis
- 11.1.1 Revenue (Market Measurement: 2025: USD 900.0 million → 2035: USD 2.33 billion)
- 11.1.2 Market Volume and Quantity Sold
- 11.1.3 Historical Market Size, 2018-2025
- 11.1.4 Base-Year Market Size, 2025
- 11.2 Market Forecast, 2025-2035
- 11.2.1 Revenue Forecast to 2035
- 11.2.2 Volume Forecast to 2035
- 11.2.3 CAGR and Year-on-Year Growth
- 11.2.4 Incremental Revenue Opportunity
- 11.3 Forecast Assumptions and Scenario Analysis
- 11.3.1 Base-Case Forecast
- 11.3.2 Optimistic and Conservative Scenarios
- 11.3.3 Technology, Pricing and Policy Sensitivities
- 11.4 Market Attractiveness and Growth Outlook
Chapter 12 India Momos Market Segmentation and Outlook
- 12.1 Segmentation Summary and Market Shares, 2025
- 12.2 Largest and Fastest-Growing Segments
- 12.3 By Format - Market Size and Forecast, 2025-2035
- 12.3.1 Segment Definition and Scope
- 12.3.2 Historical Market Size, 2018-2025
- 12.3.3 Revenue Forecast, 2025-2035
- 12.3.4 Volume Forecast, 2025-2035
- 12.3.5 Base-Year Market Share, 2025
- 12.3.6 Segment CAGR and Growth Drivers
- 12.3.7 Subsegment Market Size and Forecast
- 12.3.7.1 Street Vendors
- 12.3.7.2 QSR Chains
- 12.3.7.3 Frozen Packs
- 12.3.8 Subsegment Pricing and Adoption Trends
- 12.3.9 Leading Suppliers and Competition
- 12.3.10 Regional Demand and Opportunities
- 12.4 By Type - Market Size and Forecast, 2025-2035
- 12.4.1 Segment Definition and Scope
- 12.4.2 Historical Market Size, 2018-2025
- 12.4.3 Revenue Forecast, 2025-2035
- 12.4.4 Volume Forecast, 2025-2035
- 12.4.5 Base-Year Market Share, 2025
- 12.4.6 Segment CAGR and Growth Drivers
- 12.4.7 Subsegment Market Size and Forecast
- 12.4.7.1 Steamed
- 12.4.7.2 Fried
- 12.4.7.3 Tandoori
- 12.4.8 Subsegment Pricing and Adoption Trends
- 12.4.9 Leading Suppliers and Competition
- 12.4.10 Regional Demand and Opportunities
- 12.5 By Demand Cluster - Market Size and Forecast, 2025-2035
- 12.5.1 Segment Definition and Scope
- 12.5.2 Historical Market Size, 2018-2025
- 12.5.3 Revenue Forecast, 2025-2035
- 12.5.4 Volume Forecast, 2025-2035
- 12.5.5 Base-Year Market Share, 2025
- 12.5.6 Segment CAGR and Growth Drivers
- 12.5.7 Subsegment Market Size and Forecast
- 12.5.7.1 Metros
- 12.5.7.2 North
- 12.5.7.3 East
- 12.5.7.4 Others
- 12.5.8 Subsegment Pricing and Adoption Trends
- 12.5.9 Leading Suppliers and Competition
- 12.5.10 Regional Demand and Opportunities
- 12.6 Segment Growth Comparison
- 12.7 Segment Attractiveness and Priority Matrix
Chapter 13 India Momos Geographic Market Outlook, 2025-2035
- 13.1 Domestic Market Distribution and Demand Clusters
- 13.2 State- or Province-Wise Market Size and Forecast, 2025-2035
- 13.3 City and Metropolitan Market Outlook
- 13.4 Industrial, Manufacturing and Commercial Clusters
- 13.5 Geographic Concentration of Key End Users
- 13.6 Local Pricing and Purchasing Differences
- 13.7 Domestic Production Facilities and Capacity Map
- 13.8 Local Infrastructure and Project Pipeline
- 13.9 State-Level Policy and Incentive Differences
- 13.10 Subnational Investment Hotspots and Opportunities
- 13.11 Distribution and Logistics Networks
- 13.12 Domestic Competitive Footprint
Chapter 14 India Momos Technology, Innovation and Sustainability Outlook
- 14.1 Technology Landscape and Maturity
- 14.2 Product, Process and Service Innovation
- 14.3 AI, Automation and Digital Tools in the Industry
- 14.4 Technology Adoption and Performance Benchmarking
- 14.5 Innovation Pipeline and R&D Investment
- 14.6 Patent and Intellectual Property Trends
- 14.7 Energy Efficiency and Resource Management
- 14.8 Sustainability, Recycling and Circularity
- 14.9 Technology Roadmap, 2025-2035
- 14.10 Risks of Obsolescence and Technology Substitution
Chapter 15 India Momos Market Key Strategic Imperatives
- 15.1 Growth and Market Entry Priorities
- 15.2 High-Return Products and Segments
- 15.3 Pricing, Profitability and Cost Optimization
- 15.4 Technology Investment and Product Differentiation
- 15.5 Supply Chain Localization and Resilience
- 15.6 Distribution and Customer Acquisition
- 15.7 Partnership, Acquisition and Capacity Strategy
- 15.8 Regional Expansion Priorities
- 15.9 Short-, Medium- and Long-Term Actions
Chapter 16 Competition Outlook
- 16.1 Industry Competition Characteristics
- 16.2 Market Structure and Concentration
- 16.3 Market Share and Competitive Positioning, 2025
- 16.4 Company-Wise Revenue and Product Benchmarking
- 16.5 Production and Service Capacity Benchmarking
- 16.6 Technology, Pricing and Differentiation
- 16.7 Regional Footprint and Distribution Strength
- 16.8 Mergers, Acquisitions and Strategic Alliances
- 16.9 New Entrants and Competitive Threats
- 16.10 Porter's Five Forces and Industry Attractiveness
- 16.11 Competitive Outlook, 2025-2035
Chapter 17 Company Profiles
- 17.1 Company Coverage and Selection Criteria
- 17.2 Wow! Momo Foods
- 17.2.1 Business Description
- 17.2.2 Company Ownership and Geographic Presence
- 17.2.3 Product and Service Portfolio
- 17.2.4 Manufacturing and Operating Footprint
- 17.2.5 Production Capacity and Expansion Plans
- 17.2.6 Financial Performance and Investment
- 17.2.7 Market Share and Competitive Position
- 17.2.8 Technology and Innovation Capabilities
- 17.2.9 Strategic Alliances or Partnerships
- 17.2.10 Recent Developments
- 17.2.11 Growth Strategy and Outlook
- 17.3 Prasuma
- 17.4 ITC Master Chef
- 17.5 Licious
- 17.6 Momos Pro
- 17.7 Dolma Aunty Momos
- 17.8 Local Vendors
- 17.9 Other Relevant Market Participants
Note: Every listed company is profiled on the structure shown under the first company. The company list is preliminary and may change based on research findings, market developments, data availability and client requirements.
Chapter 18 Disclaimer
- 18.1 Research and Forecast Disclaimer
- 18.2 Data Source and Estimation Limitations
Note: The depth of individual sections depends on data availability for this market. Volume, capacity, trade and other unit-based metrics are included where applicable.

