
Festive gifting and packaging move mithai toward brands
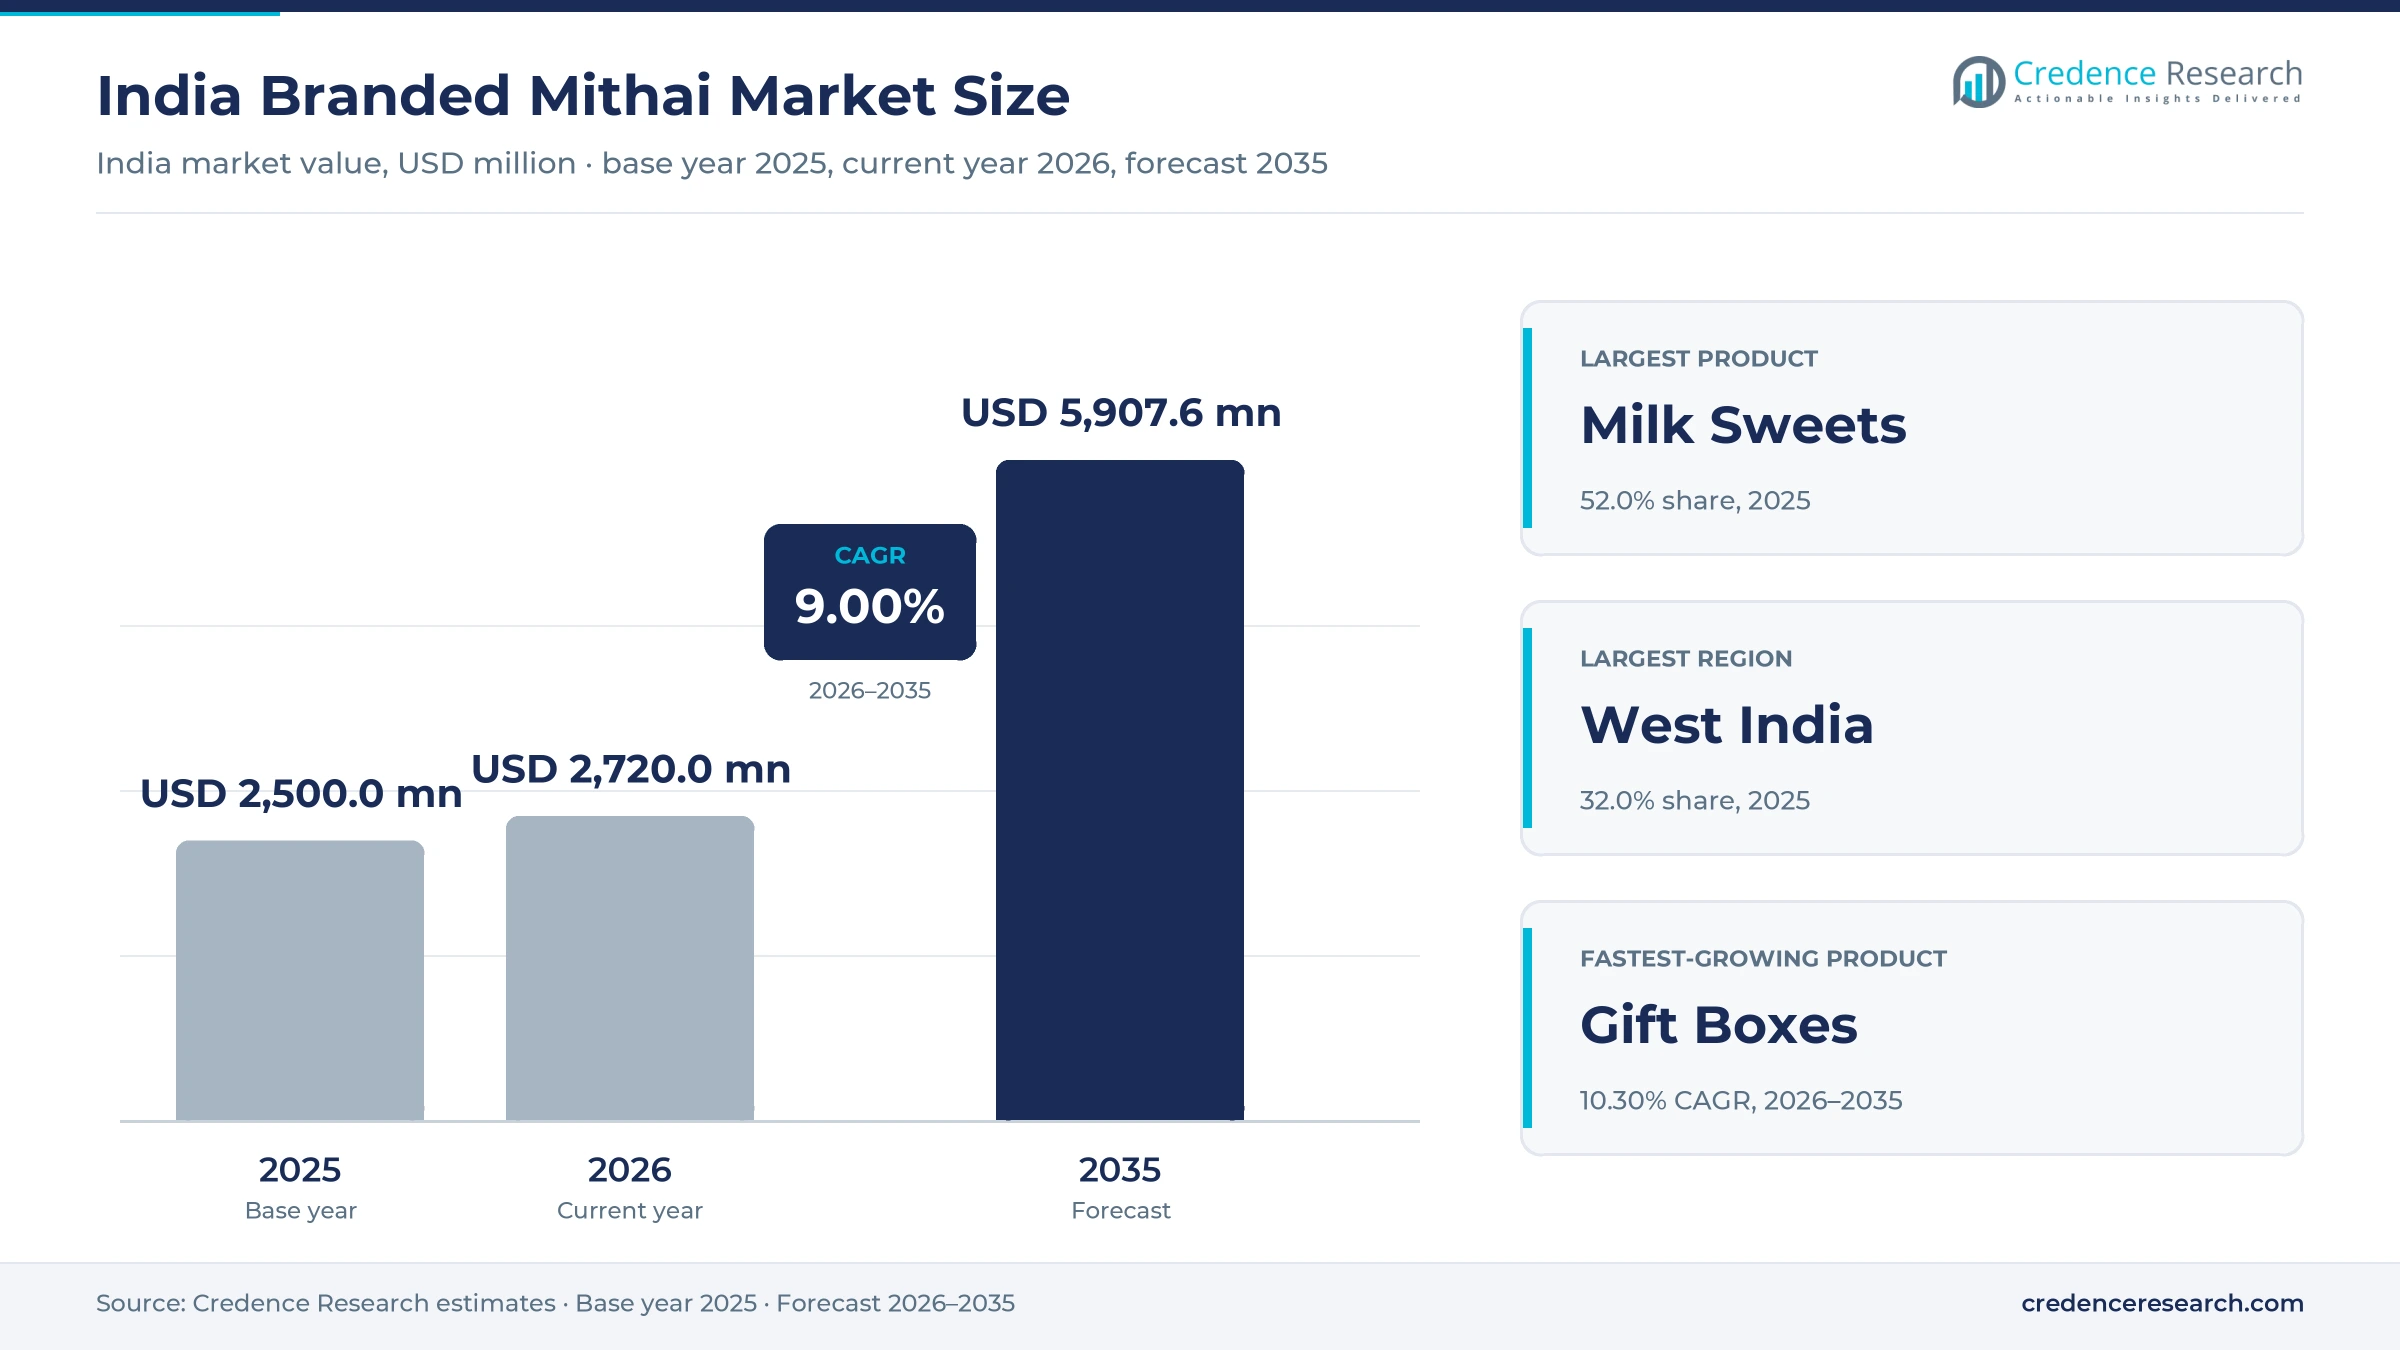
The India branded mithai market was valued at USD 2.50 billion in 2025 and is projected to increase from USD 2.72 billion in 2026 to USD 5.91 billion by 2035, registering a CAGR of 9.00% during 2026–2035. Festive gifting, sealed packaging and wider retail reach explain most of this growth, because shoppers will pay more for a trusted name when sweets are given rather than eaten at home. West India held the largest regional share, 32.0% in 2025, supported by dense chains in Maharashtra and Gujarat. Central India is the fastest-growing region at 9.85% a year as smaller cities gain organized stores and delivery. Modified atmosphere packs have also changed the economics of the category, since they let fresh sweets last weeks rather than days and make smaller pre-packed stores workable. Stricter festive enforcement by food regulators adds to the case for traceable brands.
What does the branded mithai market include and who buys it?
The market counts traditional Indian sweets sold under a recognized brand, whether from a chain counter, a sealed retail pack, a gift box or an online order. Households buy for festivals and family occasions, while employers and institutions buy assorted boxes in bulk for staff and clients.
Sales by neighborhood halwais without a brand identity, home production and chocolates are excluded from the count. The value chain runs from milk, khoya, ghee, nuts and sugar through central kitchens and packing lines to company stores, supermarkets, marketplaces and quick-commerce dark stores.
India Branded Mithai Market Insights
- The market grows from USD 2.50 billion in 2025 to USD 5.91 billion by 2035, a CAGR of 9.00%, as gifting and sealed packs move spending from loose counters to brands.
- West India held the largest regional share at 32.0% in 2025, helped by Maharashtra and Gujarat chains with dense store networks and strong local milk supply.
- Milk sweets led product sales with 52.0% in 2025 because barfi, peda, rasgulla and gulab jamun remain the core of family and festival purchases.
- Quick-commerce order volumes rose 120% during the 2025 festive season, according to Unicommerce, which gives brands a new route into homes on the day of purchase.
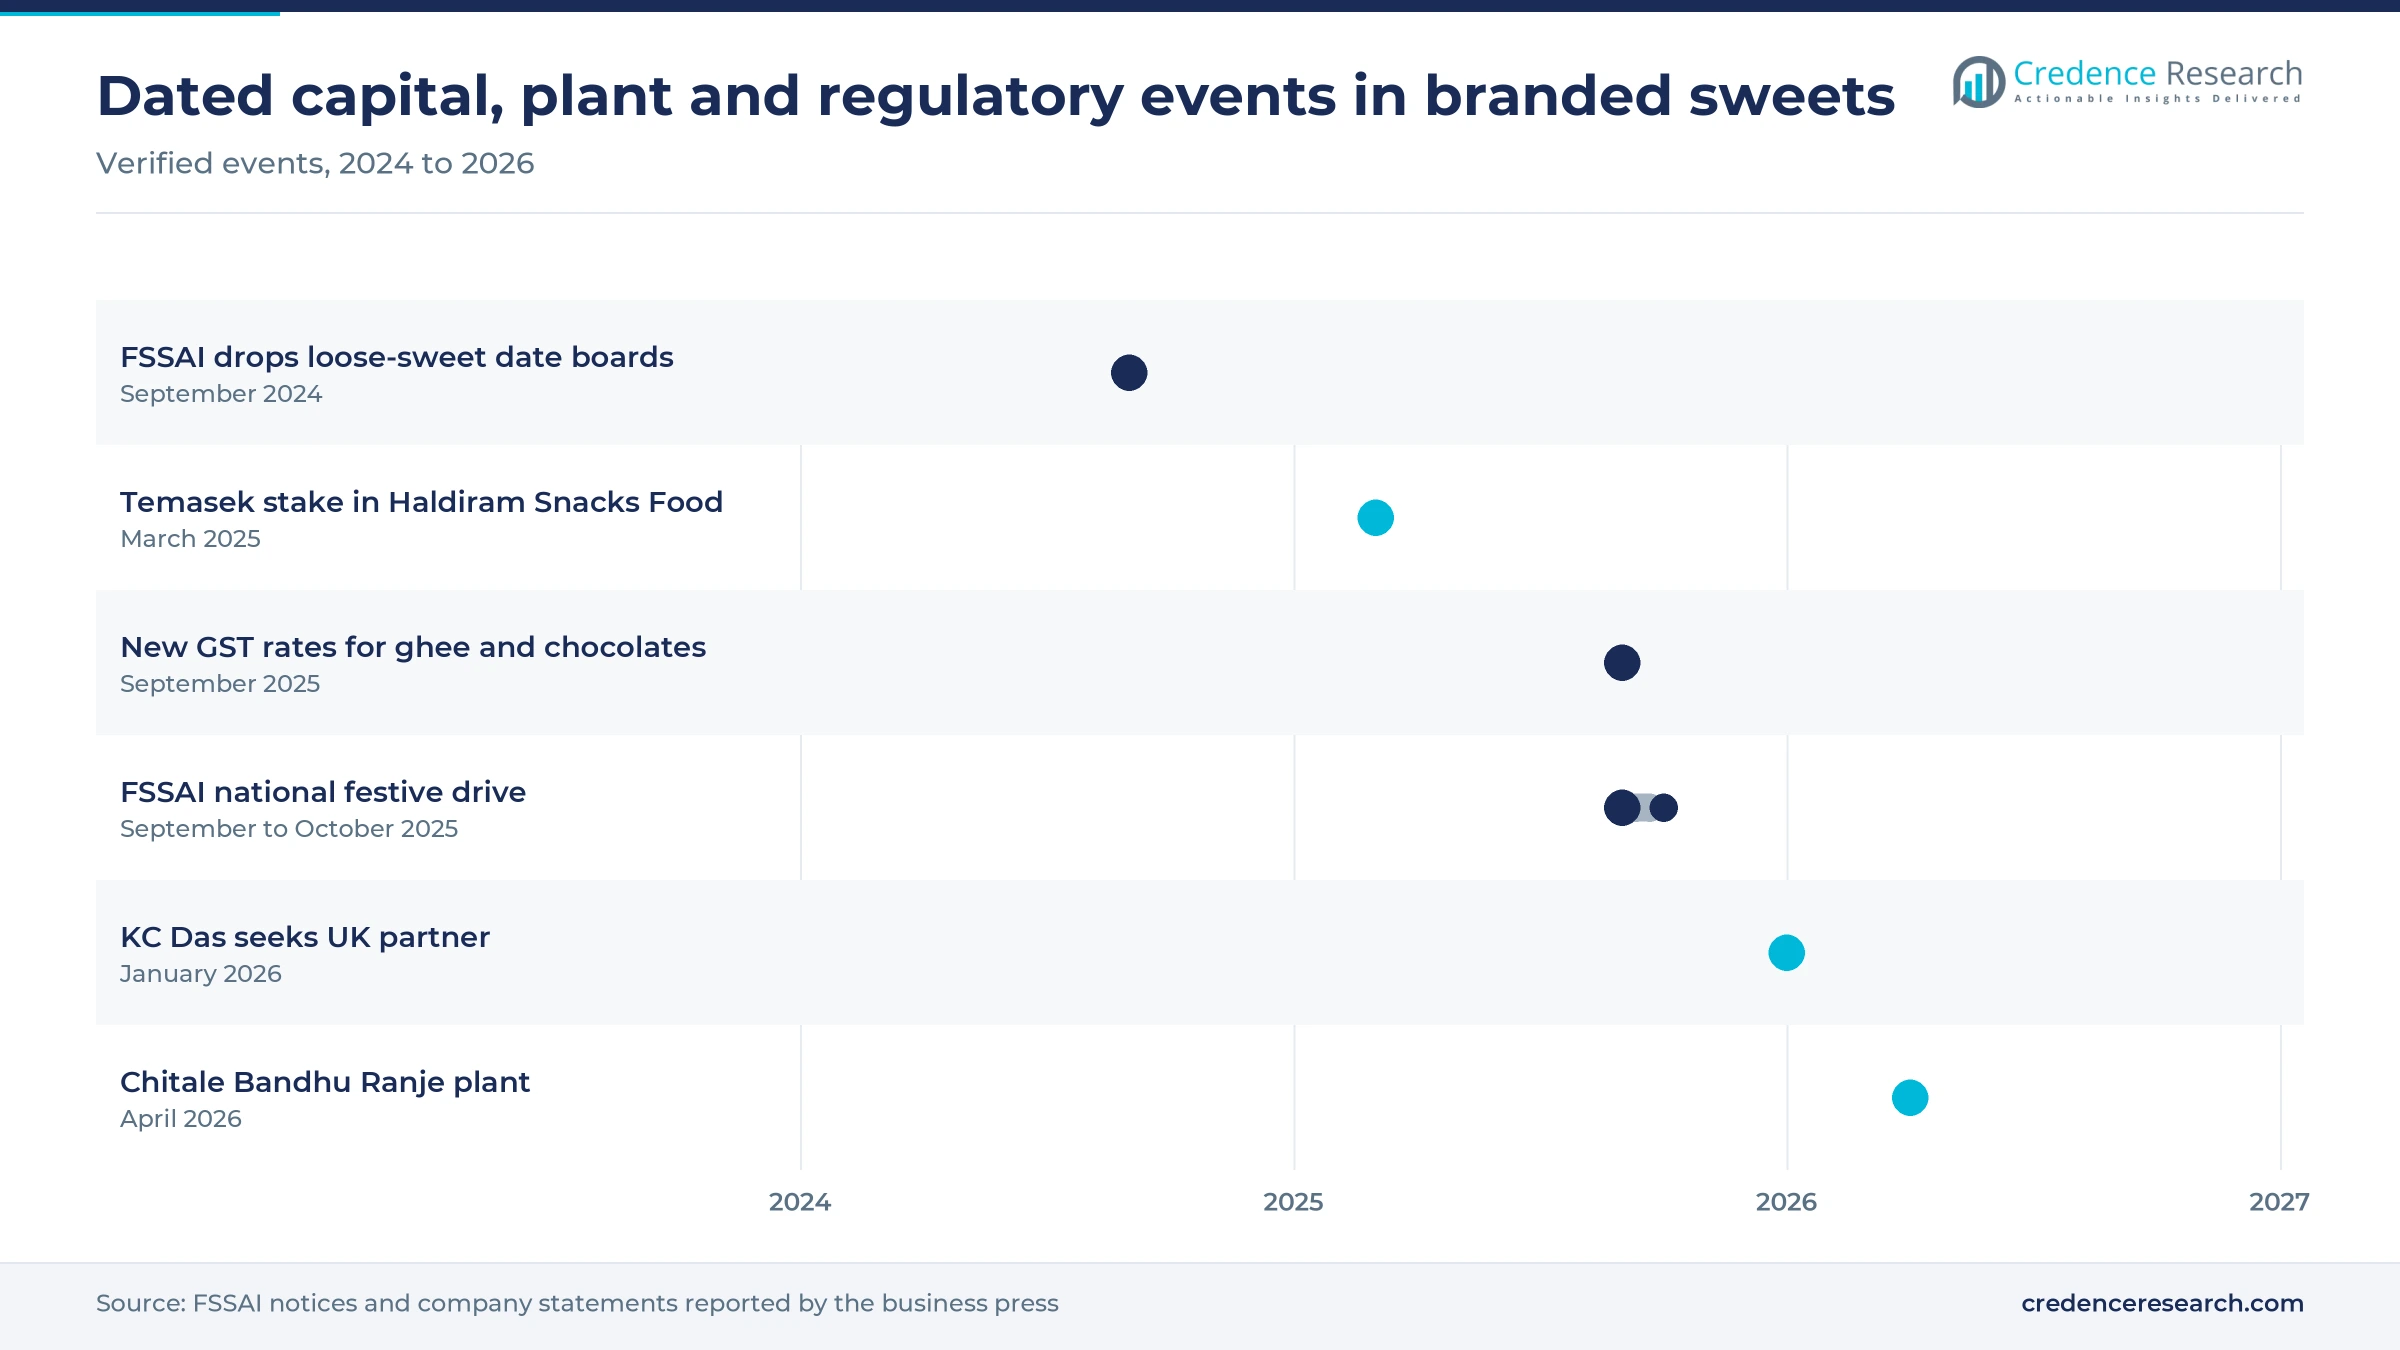
- Temasek bought about 10% of the Haldiram group business in March 2025 at a valuation of USD 10 billion, which signals investor appetite for scaled Indian sweet and snack brands.
Milk sweets and own stores anchor branded sales
Milk sweets lead while gift boxes grow fastest
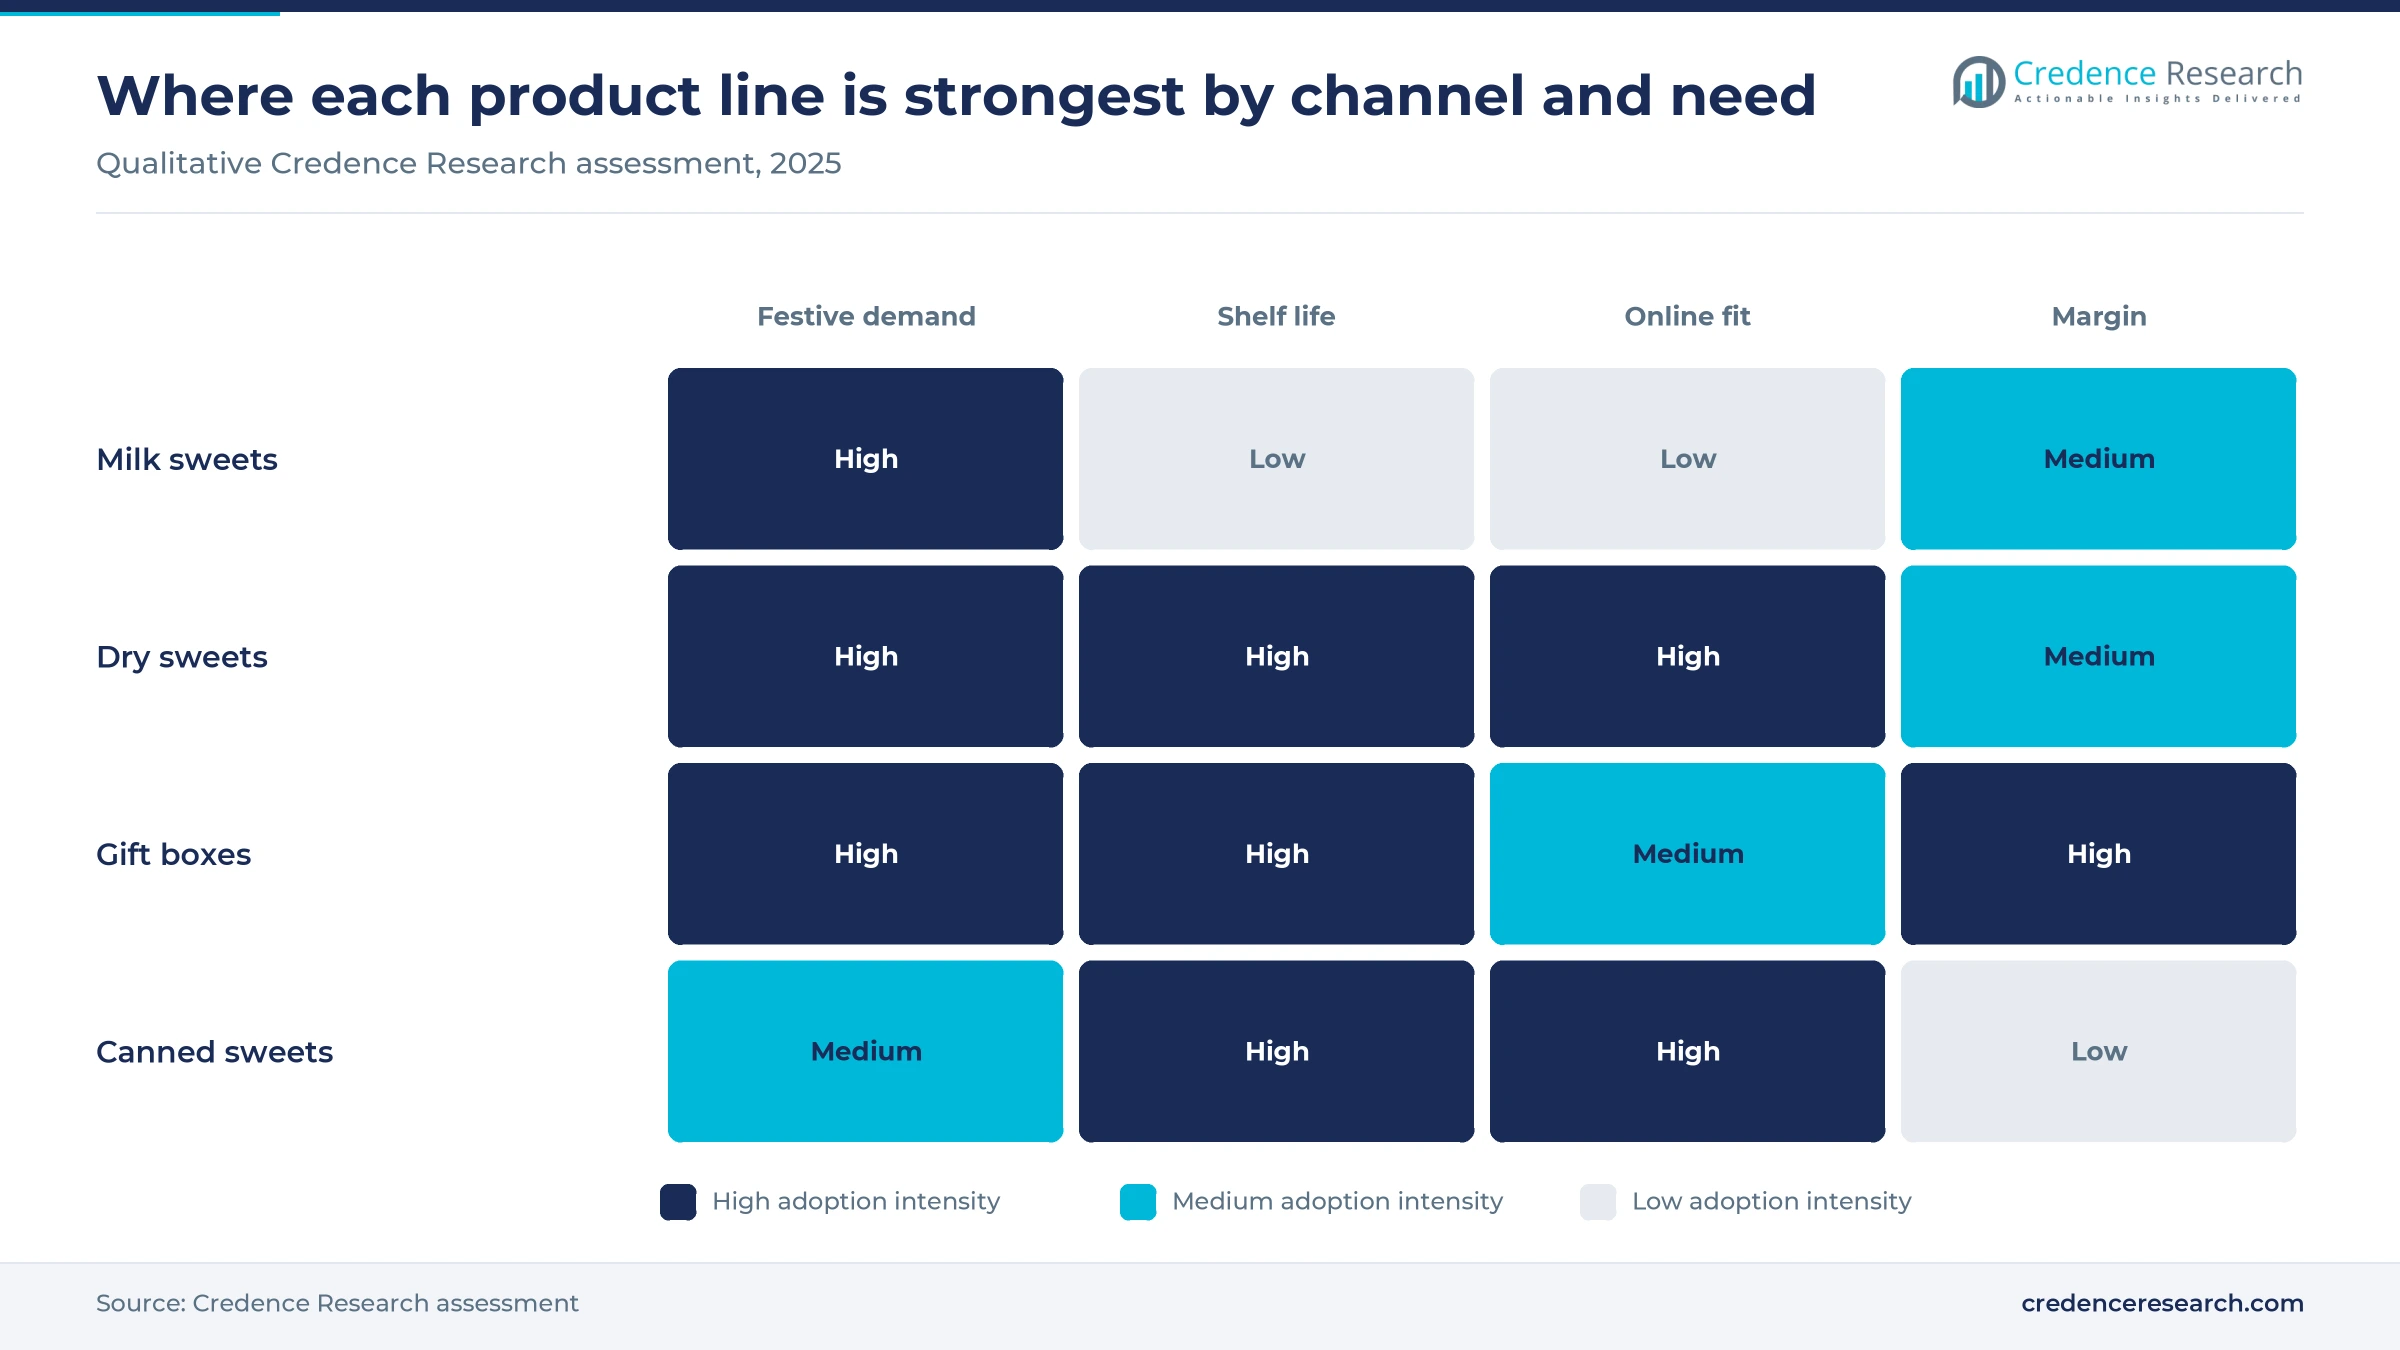
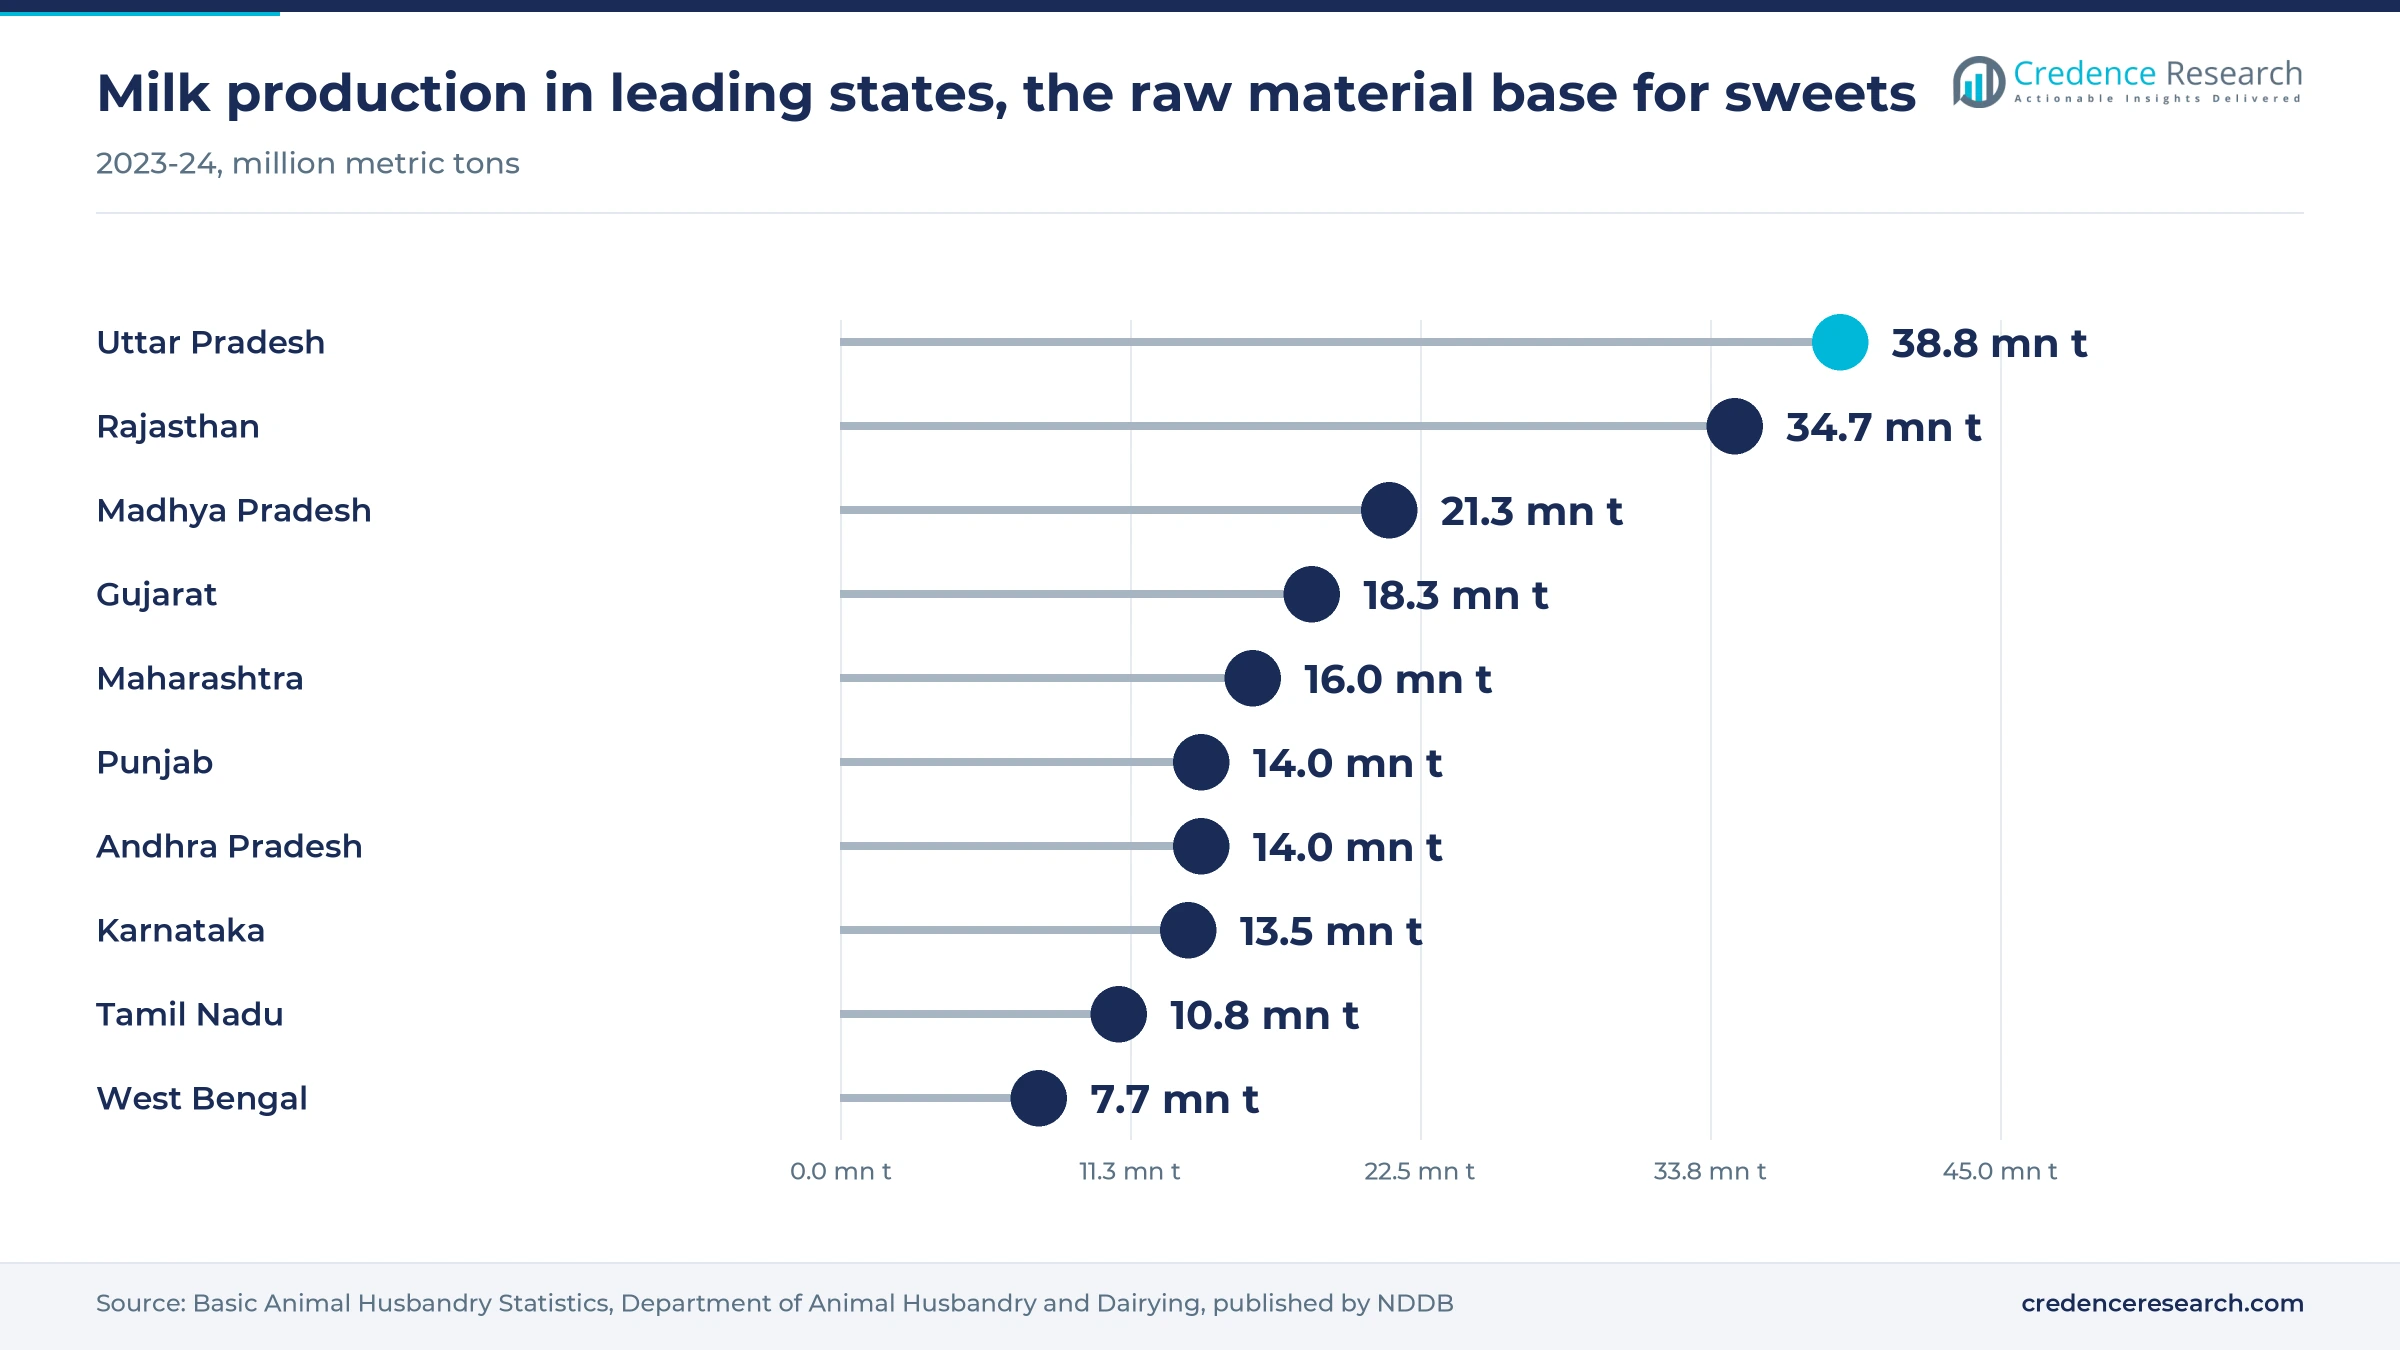
Based on product, the market is categorized into milk sweets, dry sweets and gift boxes. Milk Sweets led with 52.0% of 2025 value because India produced about 239.3 million metric tons of milk in 2023-24, according to Basic Animal Husbandry Statistics, which keeps khoya and chhena within reach of nearly every chain. Dry sweets such as Mysore pak travel better, and Anand Sweets has built its Hosur unit of 1.2 lakh sq ft around such lines, YourStory reported. Gift Boxes grow fastest at 10.30% a year as FoodNavigator reported in October 2025 that Diwali can reach nearly a third of annual sales for a sweet maker.
Own stores lead while online channels grow fastest
Based on channel, the market is categorized into own stores, modern trade and e-commerce or q-commerce. Own Stores led with 68.0% of 2025 value because chains control freshness at the counter, and Ganguram alone runs more than 30 outlets across Kolkata, according to Slurrp. Modern trade widened when Reliance Retail stocked about 100 sweet varieties at Smart Bazaar and Smart stores from October 2022. E-Commerce/Q-Commerce grows fastest at 11.25% a year as India Sweet House already takes about 30% of its sales online, YourStory reported, through Swiggy and Zomato.
West leads the four-zone view and south grows fastest
Based on zone, the market is categorized into north, west, east and south, a four-zone view that folds Central India into west and Northeast India into east. West led with 37.0% of 2025 value because Chitale Bandhu alone runs 17 express stores in Mumbai and 12 across Maharashtra, Indian Retailer reported in March 2025. South grows fastest at 9.38% a year as India Sweet House reached 50 Karnataka stores in about four years, D2C Insider reported in December 2025, while Anand Sweets is exploring Hyderabad and Chennai.
| Segment Group | Leading Sub-segment | Share, 2025 | Fastest-growing Sub-segment | CAGR, 2026–2035 |
|---|---|---|---|---|
| By Product | Milk Sweets | 52.0% | Gift Boxes | 10.30% |
| By Channel | Own Stores | 68.0% | E-Commerce/Q-Commerce | 11.25% |
| By Zone | West | 37.0% | South | 9.38% |
Request a Free Sample
Fill in your details and we'll send you a free sample report.
- Sample data tables & charts
- Research methodology
Gifting, packaging and new channels drive growth
Organized gifting and festive demand raise sales
Festive gifting is the largest single lift for these brands because purchases concentrate in a few weeks when buyers pay for a trusted name. The Confederation of All India Traders put Diwali 2025 goods trade at Rs 5.40 lakh crore, with sweets and namkeen making up 5% of total festive trade. FoodNavigator reported in October 2025 that the season can reach nearly a third of annual sales for a sweet maker, so one good Diwali shapes the whole year. Employers add a second stream through corporate Diwali gifting, which favors sealed boxes with invoices and consistent quality. In the Credence Research model this adds about 3.33 percentage points to annual growth to 2035.
Hygienic packs and premium regional ranges widen appeal
Sealed packs and regional ranges let a brand sell beyond the neighborhood where its name is known. Indian Retailer reported in March 2025 that Chitale Bandhu extended mithai shelf life by up to two months with modified atmosphere packaging, and that this made its pre-packed express stores possible. Reliance Retail set out in October 2022 to upgrade more than 50 regional sweets, with over 500 packs on its shelves and in JioMart. Premium positioning follows, as Anand Sweets uses display-worthy boxes and tins built on its Mysore pak. Better flexible packaging supports the same move by protecting sweets in transit. In the Credence Research model this adds about 2.43 percentage points to annual growth to 2035.
Modern trade and delivery carry brands to new cities
New channels let brands enter cities without funding a full store network there. Amul had placed its traditional sweets in 300 modern trade stores and 35,000 retail touchpoints by April 2021, Dairy News 7x7 reported, while Mother Dairy started with 2,000 touchpoints in North India. Delivery has since widened this reach, and online grocery baskets now include boxed sweets. Unicommerce data published by PTI in October 2025 showed tier II and III cities at about 55% of festive e-commerce orders, with tier II orders up 28%. Delivery reaches many of those towns before a large chain store opens there. In the Credence Research model this adds about 1.80 percentage points to annual growth to 2035.
Investor capital and larger plants raise supply capacity
Fresh capital and larger plants now allow leading brands to supply far more stores from one site. Outlook Business reported in March 2025 that Temasek was buying about 10% of Haldiram Snacks Food at a USD 10 billion valuation, with funds meant for domestic and overseas expansion. Chitale Bandhu put about Rs 250 crore into its 25-acre Ranje Vision Park near Pune, built for 40 metric tons of sweets and savories a day, Punekar News reported in April 2026. Haldiram's already runs 15 manufacturing facilities in India, FoodNavigator reported. D2C Insider reported in December 2025 that India Sweet House is planning a possible 2026 listing, so public capital could soon reach regional chains as well.
Cleaner recipes and fast delivery open new demand
Shift toward jaggery, millet and reduced-sugar recipes
Recipes are shifting toward jaggery, millets and lower-sugar versions as brands seek reasons for buying outside festivals. YourStory reports that India Sweet House sells a jaggery-based kaju katli alongside millet-based cookies, and Anand Sweets, which sells about 500 kg of Mysore pak a day, offers a jaggery version next to its classic line. Amul added a sugar-free and lactose-free peda to a range of close to 30 sweets by November 2020, Dairy News 7x7 reported, which showed that even a dairy cooperative saw room for the format. These versions usually carry a premium, which suits the gifting occasion. Unicommerce also named fusion sweets and millet namkeens among top FMCG lines in the 2025 festive season, so the shift reaches online baskets.
Rise of quick-commerce festive campaigns for sweets
Quick-commerce platforms are turning sweets into a same-hour festive purchase, which reduces the traditional queue at the counter. Unicommerce data published by PTI showed quick-commerce order volumes up 120% in the 2025 festive season, against 8% growth for marketplaces. Platforms also use sweets for promotion, and afaqs reported in October 2024 that Zepto sent free soan papdi with orders above Rs 400 while Blinkit sent surprise Diwali hampers. Dairy News 7x7 reported in January 2025 that a Diwali 2024 tie-up with Blinkit lifted Haldiram's metro sales by 30%. Brands respond with smaller sealed packs built for dark stores, and with brand websites, whose festive orders rose 33%.
Opening for pre-packed outlets in smaller towns and highways
Pre-packed formats give chains an opening in towns and travel locations that cannot support a kitchen-backed store. Restaurant India reported in June 2024 that Bikanervala opened two outlets on the Delhi-Mumbai Expressway and planned at least 50 more outlets that year. Anand Sweets already sells travel-friendly assortments at Ahmedabad and Kochi airports, according to YourStory. Household budgets support the move, because the Ministry of Statistics reported December 2024 survey data showing average rural monthly spending of Rs 4,122 per person in 2023-24, with about 9.84% going to beverages, refreshments and processed food. Small sealed packs fit those budgets better than a one-kilogram counter purchase.
Opening in overseas sales after the India-U.K. trade pact
Overseas demand offers an opening that also lifts utilization at Indian plants between festivals. PTI reported in January 2026 that KC Das is seeking a U.K. partner for a Birmingham base after the India-U.K. trade pact signed in July 2025, under which Indian exporters would get duty-free access for 99% of products, a market KC Das left in 1965. KC Das already exports vacuum-sealed canned rosogollas to buyers around the world. Chitale Bandhu, with over 250 sweet varieties, launched a shop-in-shop format in U.S. Indian grocery stores and plans similar setups in Dubai and Sydney, Indian Retailer reported. FoodNavigator reported in October 2025 that Haldiram's runs a 10,000 sq ft U.K. production and distribution hub, which shows how large the diaspora opportunity has become for scaled brands.
Food safety, milk costs and shelf life limit margins
Adulteration cases weigh on trust in festive sweets
Uttar Pradesh food regulators seized 2,993 quintals of food in the week to Oct. 15, 2025, PTI reported, including 3,000 kg of adulterated rasgulla and gulab jamun in Bulandshahr. Cases like this help brands against loose sellers, but they also make shoppers wary of every sweet. FSSAI ordered a national festive drive with mobile testing vans from Sept. 24, 2025, so branded kitchens face closer sampling. Chitale Bandhu answers with FSSC 22000 and BRC certification at its new plant, although audits like these add cost.
Milk and procurement costs squeeze festive margins
Rural Voice reported that Amul and Mother Dairy raised milk prices by Rs 2 per liter from May 14, 2026, and Mother Dairy said procurement prices had climbed about 6% in a year. Milk sweets carry this cost directly, since khoya and chhena are themselves made from milk. Lakshmikumaran & Sridharan noted that ghee and butter moved to a 5% tax rate from Sept. 22, 2025, which offers partial relief. Chains can reprice festive boxes, but everyday counter lines are harder to lift.
Short shelf life limits reach for fresh milk sweets
Fresh milk sweets remain hard to ship, and even the modified atmosphere packs used by Chitale Bandhu add at most about two months of life, according to Indian Retailer. Labeling rules are also unsettled, because Free Press Journal reported in September 2024 that FSSAI removed mandatory best-before boards on loose sweets pending a scientific panel review. Long-distance sellers therefore rely on canned rasgulla or dry sweets, which narrows the range online and in smaller cities until cold-chain coverage improves.
Chocolates and local sweet shops compete for gifting budgets
Gift budgets are contested from both sides, since Lakshmikumaran & Sridharan listed chocolates among the items moved to the same lower tax rate as ghee from Sept. 22, 2025, narrowing any price gap against boxed sweets. CAIT counted bakery and confectionery at 3% of Diwali 2025 trade, a sizable rival pool. Neighborhood sweet shops also undercut brands on price and freshness, and Mother Dairy said in April 2021 that it was not charging any premium to win share. Brands therefore defend their margin through box design and assured quality rather than price.
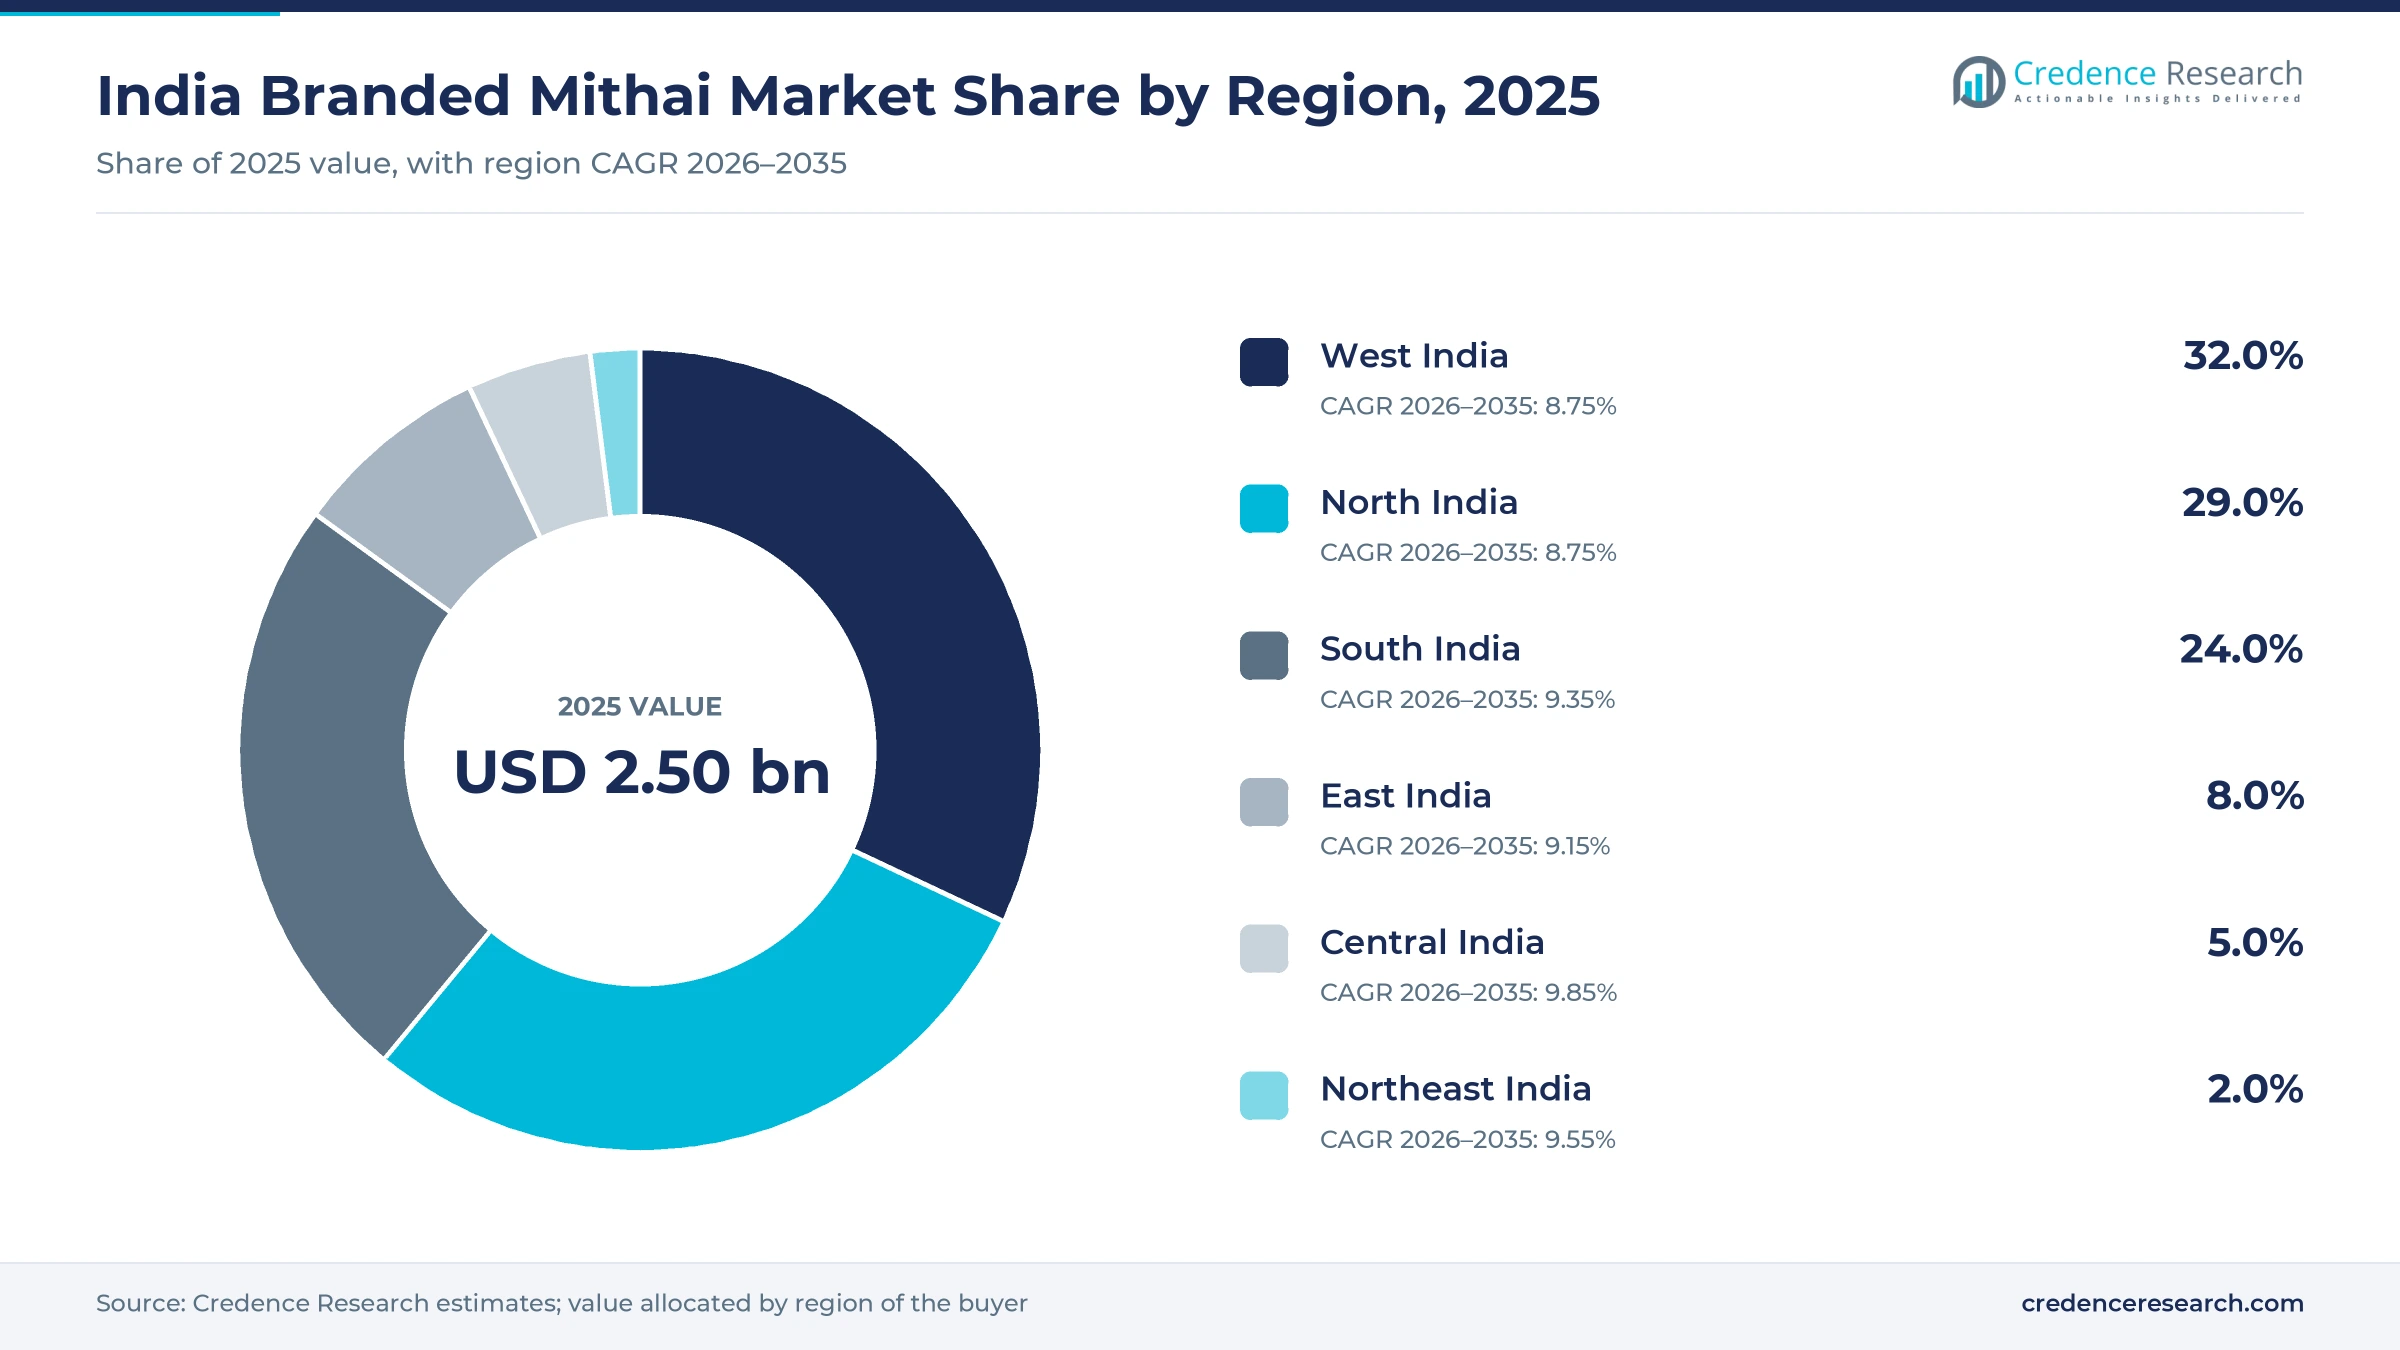
West India leads while Central India grows fastest
| Region | Value, 2025 (USD billion) | Share, 2025 | CAGR, 2026–2035 |
|---|---|---|---|
| West India | 0.80 | 32.0% | 8.75% |
| North India | 0.72 | 29.0% | 8.75% |
| South India | 0.60 | 24.0% | 9.35% |
| East India | 0.20 | 8.0% | 9.15% |
| Central India | 0.12 | 5.0% | 9.85% |
| Northeast India | 0.05 | 2.0% | 9.55% |
West India leads on dense Maharashtra and Gujarat chains
West India held 32.0% of 2025 value and grows at 8.75% a year, helped by chains that pair strong local names with packaged formats. Chitale Bandhu anchors Maharashtra from Pune, and its Ranje plant near the city targets daily output of 40 metric tons. Milk supply is deep, with Gujarat producing about 18.3 million metric tons and Maharashtra about 16.0 million metric tons in 2023-24, according to Basic Animal Husbandry Statistics. Express stores in Mumbai also show how pre-packed formats can work in a dense city.
North India pairs heritage names with the largest milk base
North India held 29.0% of 2025 value and grows at 8.75% a year, reflecting a mature market of large chains. Bikanervala began as a sweet shop in Bikaner in 1905 and targeted Punjab and Jammu and Kashmir in a November 2023 partnership with The Montana Group. Uttar Pradesh produced about 38.8 million metric tons of milk and Rajasthan about 34.7 million metric tons in 2023-24, the two largest state totals. Heavy festive enforcement in Uttar Pradesh also favors brands that can show clean sampling records.
South India scales through Karnataka store networks
South India held 24.0% of 2025 value and grows at 9.35% a year, supported by younger chains that sell through stores and delivery apps. Anand Sweets runs 15 company-owned stores in Bengaluru and produces most of its range at a central unit in the Hosur region, YourStory reported. India Sweet House has built 50 stores across Karnataka towns from Mysuru to Udupi. Andhra Pradesh, Karnataka and Tamil Nadu together produced about 38.3 million metric tons of milk in 2023-24.
East India relies on heritage chhena sweet makers
East India held 8.0% of 2025 value and grows at 9.15% a year, with demand centered on chhena sweets from long-established Kolkata names. Ganguram traces its roots to 1885, Slurrp reported, and KC Das exports vacuum-sealed canned rosogollas. West Bengal produced about 7.65 million metric tons of milk and Odisha about 2.64 million metric tons in 2023-24, a thinner base than the west. Seasonal nolen gur sandesh gives Ganguram a distinctive line, although fresh chhena sweets are harder to ship than canned ones.
Central India grows fastest from a small organized base
Central India held 5.0% of 2025 value and is the fastest-growing zone at 9.85% a year, because organized supply is arriving in cities that had few branded options. Madhya Pradesh produced about 21.3 million metric tons of milk in 2023-24, the third-largest state total, which gives new chains an inexpensive raw material base. Unicommerce showed tier III festive orders up 23% in 2025, so delivery can reach these towns ahead of company stores. Chhattisgarh added about 2.12 million metric tons of milk to the regional supply base.
Northeast India stays small and depends on shipped packs
Northeast India held 2.0% of 2025 value and grows at 9.55% a year from the smallest base among the six zones. Local milk is scarce, as Assam produced about 1.09 million metric tons in 2023-24 and Meghalaya only about 97,000 metric tons, which limits fresh milk sweets at scale. Sales therefore lean on shipped dry sweets and sealed tins rather than fresh counters. Long transit from the main plants means that shelf-stable packs matter more here than in the other five zones.
Capital, plants and enforcement shaped 2025 and 2026
| Development | Status and market relevance |
|---|---|
| In March 2025, Temasek agreed to buy about 10% of Haldiram Snacks Food at a USD 10 billion valuation, Outlook Business reported. | The deal gives the largest branded name fresh funding for domestic expansion. |
| In September 2025, FSSAI ordered a nationwide festive drive on sweets, savories and dairy products with mobile testing vans and same-day digital records. | State teams were told to complete data by Nov. 15, 2025, which raises scrutiny across the trade. |
| In December 2025, D2C Insider reported that India Sweet House had reached 50 stores in Karnataka and was planning a possible 2026 listing. | The plan tests whether public investors will fund a regional sweet chain. |
| In January 2026, PTI reported that KC Das was seeking a U.K. partner for a Birmingham manufacturing base after the India-U.K. trade pact. | The plan remains at the partner search stage. |
| In April 2026, Chitale Bandhu was due to inaugurate its Rs 250 crore Ranje Vision Park near Pune, with output of 40 metric tons a day. | The plant adds separate sweet and savory units certified under FSSC 22000, U.S. FDA and BRC standards. |
Packaging science decides how far fresh sweets travel
- Modified atmosphere packaging replaces the air in a pack with a protective gas mix, and Chitale Bandhu and India Sweet House both use it to sell boxed sweets beyond the day of making.
- Vacuum canning keeps syrup-based sweets stable for long journeys, and KC Das uses it for the canned rosogollas that it exports worldwide.
- Line automation cuts labor at high-volume items, and Indian Retailer reported that four machines lifted Chitale bhakarwadi output from 200 kg a day to 200 kg an hour.
- Digital food safety records now shape inspections, since FSSAI told field teams in September 2025 to log GPS location, photos and test results on its FoSCoS portal or FoSCoRIS app the same evening.
Need a Custom Version of This Report?
Tailor the scope, geography, or segments to your exact requirements.
- Custom geography or segment scope
- Direct access to our analyst team
Heritage chains and snack majors compete on trust
Competition runs between national snack and sweet groups, regional heritage chains, dairy brands and newer retail-led names. Haldiram's has the widest reach, built on 15 manufacturing facilities in India and packaged lines that also sell through Blinkit. Bikanervala combines sweet shops with restaurants, placing it close to quick-service restaurants in the way it picks sites. Chitale Bandhu and Anand Sweets compete mainly on regional loyalty and on a signature product, while Ganguram and KC Das rely on long Kolkata heritage in chhena sweets. Amul and Mother Dairy use their milk supply and retail touchpoints to enter at sharper prices. Rivalry centers on packaging, festive assortments and space on delivery apps, and chains that can show certified plants hold an edge as enforcement tightens. Gift buyers also compare boxed sweets with dry fruit hampers, which sets a ceiling on premium pricing.
Companies profiled and their roles in this market
| Company | Type | Role in the market |
|---|---|---|
| Haldiram's | National sweet and snack group | Runs 15 Indian manufacturing facilities and sells through its own stores, modern trade and quick commerce |
| Bikanervala | Sweet shop and restaurant chain | Operated 175 outlets across India and overseas markets in November 2023 and added expressway sites in 2024 |
| Chitale Bandhu | Regional sweet and savory maker | Pune-based brand with express stores, modified atmosphere packs and the Ranje plant |
| Anand Sweets | Premium regional chain | Runs 15 Bengaluru stores plus airport outlets and is known for Mysore pak gifting |
| Ganguram | Heritage Kolkata sweet maker | Operates more than 30 Kolkata outlets with a sandesh-led range |
| KC Das | Heritage rosogolla brand | Sells vacuum-sealed canned rosogollas worldwide and is seeking a U.K. manufacturing partner |
Analyst view on who wins the shift to branded sweets
Credence Research's view is that scale alone will not decide this market, because mithai remains a local taste purchase with short product life. The stronger position belongs to brands that hold a clear regional signature and also run certified central plants that feed pre-packed stores and delivery apps. Gift boxes offer the best margins, yet they also carry the greatest seasonal risk, so chains need year-round lines such as jaggery sweets and small snack packs. Investors should watch milk costs and festive sampling results closely, since either can damage a season quickly.
How the branded sweets estimates were built
The report uses 2025 as the base year and 2026 to 2035 as the forecast period. Market values come from the Credence Research model, and segment and regional splits are Credence Research estimates informed by public evidence. Sources include government statistics, regulator notices, trade body releases, company statements and business press reports opened during research. No interviews or surveys were conducted for this edition of the report.
Plant scale and delivery reach will shape 2035
By 2035, branded sweets should be a normal part of everyday grocery baskets as well as festive gifting. Central plants like the Ranje facility point to a model where a few large kitchens supply many small pre-packed stores, while delivery apps handle the last mile. Gift boxes, growing at 10.30% a year, and online channels should gain the most share, though own stores will remain the main source of market sales. The largest uncertainties are milk prices, food safety events and whether regional chains can raise public capital without weakening local recipes and quality.
Frequently Asked Questions
How big is the India branded mithai market?
What is driving growth in branded mithai sales?
Which product segment leads the market?
Which sales channel is the largest for these brands?
Which region holds the largest share?
Who are the main companies in this market?
How does packaging change the market?
What are the main risks for branded sweet makers?
Table of Content
Chapter 1 Market Segmentation
- 1.1 Segmentation Framework
- 1.1.1 Product and Service Classification
- 1.1.2 Application and End-Use Classification
- 1.1.3 Technology and Solution Classification
- 1.1.4 Customer and Distribution Channel Classification
- 1.1.5 Geographic Segmentation
- 1.1.6 Market Segment Definitions and Boundaries
- 1.2 By Product
- 1.2.1 Milk Sweets
- 1.2.2 Dry Sweets
- 1.2.3 Gift Boxes
- 1.3 By Channel
- 1.3.1 Own Stores
- 1.3.2 Modern Trade
- 1.3.3 E-Commerce/Q-Commerce
- 1.4 By Zone
- 1.4.1 West
- 1.4.2 North
- 1.4.3 South
- 1.4.4 East
Chapter 2 Introduction
- 2.1 Report Objectives and Scope
- 2.2 Product Definition and Industry Terminology
- 2.3 Market Inclusions and Exclusions
- 2.4 Research Process
- 2.4.1 Primary Research and Expert Interviews
- 2.4.2 Secondary Research and Source Review
- 2.4.3 Top-Down and Bottom-Up Estimation
- 2.4.4 Data Triangulation and Verification
- 2.5 Market Size Measurement Basis
- 2.5.1 2025: USD 2.50 billion → 2035: USD 5.91 billion
- 2.6 Historical and Forecast Reference Periods
- 2.6.1 Historical Period: 2018-2025
- 2.6.2 Base Year: 2025
- 2.6.3 Forecast Period: 2025-2035
- 2.7 Research Assumptions and Limitations
Chapter 3 Executive Summary
- 3.1 Market Snapshot and Key Findings
- 3.2 Base-Year Market Size, 2025
- 3.3 Forecast Market Size, 2035
- 3.4 Revenue and Volume Growth Outlook
- 3.5 Key Demand and Supply Indicators
- 3.6 Leading Market Segments
- 3.7 Fastest-Growing Market Opportunities
- 3.8 Regional Performance Highlights
- 3.9 Technology and Industry Transformation
- 3.10 Competitive Landscape Summary
- 3.11 Analyst View and Strategic Implications
Chapter 4 India Branded Mithai Market Trends and Developments
- 4.1 Historical Industry Development, 2018-2025
- 4.2 Recent Market Trends and Developments
- 4.3 Demand and Customer Behavior Trends
- 4.4 Technology and Product Innovation
- 4.5 Artificial Intelligence, Automation and Digitalization
- 4.6 Local Manufacturing and Supply Chain Realignment
- 4.7 Industry Partnerships, Mergers and Acquisitions
- 4.8 Sustainability and Circular Economy Developments
- 4.9 Government and Private Sector Investment Trends
- 4.10 Emerging Business Models and Commercialization
- 4.11 Industry Developments and Announcements
Chapter 5 India Branded Mithai Market Production, Supply and Demand Analysis
- 5.1 Demand Trend and Consumption Analysis, 2018-2025
- 5.2 Demand Forecast, 2025-2035
- 5.3 Production and Output Trend, 2018-2025
- 5.4 Production and Output Forecast, 2025-2035
- 5.5 Installed Capacity and Capacity Utilization
- 5.6 Company-Wise Production Plants and Statistics
- 5.6.1 Installed Production Capacity
- 5.6.2 Actual Production
- 5.6.3 Planned Capacity and Expansion Targets
- 5.7 Supply Chain Structure and Procurement Trends
- 5.8 Supply-Demand Gap and Bottlenecks
- 5.9 Import Dependence and Sourcing Structure
- 5.10 Contract Manufacturing and Outsourcing
- 5.11 Regional Supply and Demand Concentration
Chapter 6 India Branded Mithai Market Pricing Analysis
- 6.1 Pricing Structure and Measurement
- 6.2 Historical Pricing Trends, 2018-2025
- 6.3 Pricing Outlook, 2025-2035
- 6.4 Average Selling Price and Unit Economics
- 6.5 Pricing by Product and Market Segment
- 6.6 Geographic Pricing Differences
- 6.7 Key Input, Energy, Labor and Logistics Costs
- 6.8 Contract Pricing and Purchasing Models
- 6.9 Pricing Sensitivity and Competitive Positioning
- 6.10 Price, Margin and Profitability Implications
Chapter 7 India Branded Mithai Market Dynamics
- 7.1 Market Growth Drivers
- 7.1.1 Demand-Side Drivers
- 7.1.2 Technology and Innovation Drivers
- 7.1.3 Infrastructure and Investment Drivers
- 7.1.4 Regulatory and Policy Drivers
- 7.2 Market Restraints
- 7.2.1 Cost and Affordability Constraints
- 7.2.2 Technology and Adoption Barriers
- 7.2.3 Supply Chain and Operational Constraints
- 7.3 Market Challenges
- 7.3.1 Competitive Pressure and Margin Erosion
- 7.3.2 Skills, Infrastructure and Implementation Gaps
- 7.4 Emerging Market Opportunities
- 7.5 Market Dynamics Impact and Time-Horizon Assessment
Chapter 8 India Branded Mithai Value Chain Analysis
- 8.1 Industry Value Chain Overview
- 8.2 Upstream Suppliers and Critical Inputs
- 8.3 Technology and Component Providers
- 8.4 Manufacturing or Service Delivery
- 8.5 Distribution, Channel Partners and Integrators
- 8.6 Downstream Applications and End Users
- 8.7 Value Addition and Profit Pools
- 8.8 Vertical Integration and Outsourcing
- 8.9 Supplier Concentration and Risk
- 8.10 Supply Chain Localization and Resilience
Chapter 9 India Branded Mithai Market Regulations and Policies
- 9.1 Relevant Laws, Standards and Compliance Frameworks
- 9.2 Product, Service, Safety and Quality Requirements
- 9.3 Government Policies, Incentives and Subsidies
- 9.4 Imports, Exports and Trade Barriers
- 9.5 Public Procurement and Local Content Requirements
- 9.6 Environmental and Sustainability Compliance
- 9.7 Upcoming Policy Changes and Market Implications
Chapter 10 India Branded Mithai Market Hotspots and Opportunities
- 10.1 Market Opportunity Mapping and Growth Hotspots
- 10.2 High-Growth Applications and Customer Groups
- 10.3 Underserved Markets and White-Space Opportunities
- 10.4 Emerging Technology and Product Opportunities
- 10.5 New Capacity and Investment Hotspots
- 10.6 Market Entry and Expansion Opportunities
- 10.7 Distribution and Partnership Opportunities
- 10.8 Near-Term and Long-Term Commercial Potential
- 10.9 Opportunity Attractiveness and Execution Risks
Chapter 11 India Branded Mithai Market Outlook, 2025-2035
- 11.1 Market Size and Analysis
- 11.1.1 Revenue (Market Measurement: 2025: USD 2.50 billion → 2035: USD 5.91 billion)
- 11.1.2 Market Volume and Quantity Sold
- 11.1.3 Historical Market Size, 2018-2025
- 11.1.4 Base-Year Market Size, 2025
- 11.2 Market Forecast, 2025-2035
- 11.2.1 Revenue Forecast to 2035
- 11.2.2 Volume Forecast to 2035
- 11.2.3 CAGR and Year-on-Year Growth
- 11.2.4 Incremental Revenue Opportunity
- 11.3 Forecast Assumptions and Scenario Analysis
- 11.3.1 Base-Case Forecast
- 11.3.2 Optimistic and Conservative Scenarios
- 11.3.3 Technology, Pricing and Policy Sensitivities
- 11.4 Market Attractiveness and Growth Outlook
Chapter 12 India Branded Mithai Market Segmentation and Outlook
- 12.1 Segmentation Summary and Market Shares, 2025
- 12.2 Largest and Fastest-Growing Segments
- 12.3 By Product - Market Size and Forecast, 2025-2035
- 12.3.1 Segment Definition and Scope
- 12.3.2 Historical Market Size, 2018-2025
- 12.3.3 Revenue Forecast, 2025-2035
- 12.3.4 Volume Forecast, 2025-2035
- 12.3.5 Base-Year Market Share, 2025
- 12.3.6 Segment CAGR and Growth Drivers
- 12.3.7 Subsegment Market Size and Forecast
- 12.3.7.1 Milk Sweets
- 12.3.7.2 Dry Sweets
- 12.3.7.3 Gift Boxes
- 12.3.8 Subsegment Pricing and Adoption Trends
- 12.3.9 Leading Suppliers and Competition
- 12.3.10 Regional Demand and Opportunities
- 12.4 By Channel - Market Size and Forecast, 2025-2035
- 12.4.1 Segment Definition and Scope
- 12.4.2 Historical Market Size, 2018-2025
- 12.4.3 Revenue Forecast, 2025-2035
- 12.4.4 Volume Forecast, 2025-2035
- 12.4.5 Base-Year Market Share, 2025
- 12.4.6 Segment CAGR and Growth Drivers
- 12.4.7 Subsegment Market Size and Forecast
- 12.4.7.1 Own Stores
- 12.4.7.2 Modern Trade
- 12.4.7.3 E-Commerce/Q-Commerce
- 12.4.8 Subsegment Pricing and Adoption Trends
- 12.4.9 Leading Suppliers and Competition
- 12.4.10 Regional Demand and Opportunities
- 12.5 By Zone - Market Size and Forecast, 2025-2035
- 12.5.1 Segment Definition and Scope
- 12.5.2 Historical Market Size, 2018-2025
- 12.5.3 Revenue Forecast, 2025-2035
- 12.5.4 Volume Forecast, 2025-2035
- 12.5.5 Base-Year Market Share, 2025
- 12.5.6 Segment CAGR and Growth Drivers
- 12.5.7 Subsegment Market Size and Forecast
- 12.5.7.1 West
- 12.5.7.2 North
- 12.5.7.3 South
- 12.5.7.4 East
- 12.5.8 Subsegment Pricing and Adoption Trends
- 12.5.9 Leading Suppliers and Competition
- 12.5.10 Regional Demand and Opportunities
- 12.6 Segment Growth Comparison
- 12.7 Segment Attractiveness and Priority Matrix
Chapter 13 India Branded Mithai Geographic Market Outlook, 2025-2035
- 13.1 Domestic Market Distribution and Demand Clusters
- 13.2 State- or Province-Wise Market Size and Forecast, 2025-2035
- 13.3 City and Metropolitan Market Outlook
- 13.4 Industrial, Manufacturing and Commercial Clusters
- 13.5 Geographic Concentration of Key End Users
- 13.6 Local Pricing and Purchasing Differences
- 13.7 Domestic Production Facilities and Capacity Map
- 13.8 Local Infrastructure and Project Pipeline
- 13.9 State-Level Policy and Incentive Differences
- 13.10 Subnational Investment Hotspots and Opportunities
- 13.11 Distribution and Logistics Networks
- 13.12 Domestic Competitive Footprint
Chapter 14 India Branded Mithai Technology, Innovation and Sustainability Outlook
- 14.1 Technology Landscape and Maturity
- 14.2 Product, Process and Service Innovation
- 14.3 AI, Automation and Digital Tools in the Industry
- 14.4 Technology Adoption and Performance Benchmarking
- 14.5 Innovation Pipeline and R&D Investment
- 14.6 Patent and Intellectual Property Trends
- 14.7 Energy Efficiency and Resource Management
- 14.8 Sustainability, Recycling and Circularity
- 14.9 Technology Roadmap, 2025-2035
- 14.10 Risks of Obsolescence and Technology Substitution
Chapter 15 India Branded Mithai Market Key Strategic Imperatives
- 15.1 Growth and Market Entry Priorities
- 15.2 High-Return Products and Segments
- 15.3 Pricing, Profitability and Cost Optimization
- 15.4 Technology Investment and Product Differentiation
- 15.5 Supply Chain Localization and Resilience
- 15.6 Distribution and Customer Acquisition
- 15.7 Partnership, Acquisition and Capacity Strategy
- 15.8 Regional Expansion Priorities
- 15.9 Short-, Medium- and Long-Term Actions
Chapter 16 Competition Outlook
- 16.1 Industry Competition Characteristics
- 16.2 Market Structure and Concentration
- 16.3 Market Share and Competitive Positioning, 2025
- 16.4 Company-Wise Revenue and Product Benchmarking
- 16.5 Production and Service Capacity Benchmarking
- 16.6 Technology, Pricing and Differentiation
- 16.7 Regional Footprint and Distribution Strength
- 16.8 Mergers, Acquisitions and Strategic Alliances
- 16.9 New Entrants and Competitive Threats
- 16.10 Porter's Five Forces and Industry Attractiveness
- 16.11 Competitive Outlook, 2025-2035
Chapter 17 Company Profiles
- 17.1 Company Coverage and Selection Criteria
- 17.2 Haldiram's
- 17.2.1 Business Description
- 17.2.2 Company Ownership and Geographic Presence
- 17.2.3 Product and Service Portfolio
- 17.2.4 Manufacturing and Operating Footprint
- 17.2.5 Production Capacity and Expansion Plans
- 17.2.6 Financial Performance and Investment
- 17.2.7 Market Share and Competitive Position
- 17.2.8 Technology and Innovation Capabilities
- 17.2.9 Strategic Alliances or Partnerships
- 17.2.10 Recent Developments
- 17.2.11 Growth Strategy and Outlook
- 17.3 Bikanervala
- 17.4 Anand Sweets
- 17.5 Ganguram
- 17.6 KC Das
- 17.7 Chitale Bandhu
- 17.8 Other Relevant Market Participants
Note: Every listed company is profiled on the structure shown under the first company. The company list is preliminary and may change based on research findings, market developments, data availability and client requirements.
Chapter 18 Disclaimer
- 18.1 Research and Forecast Disclaimer
- 18.2 Data Source and Estimation Limitations
Note: The depth of individual sections depends on data availability for this market. Volume, capacity, trade and other unit-based metrics are included where applicable.

