Market Overview
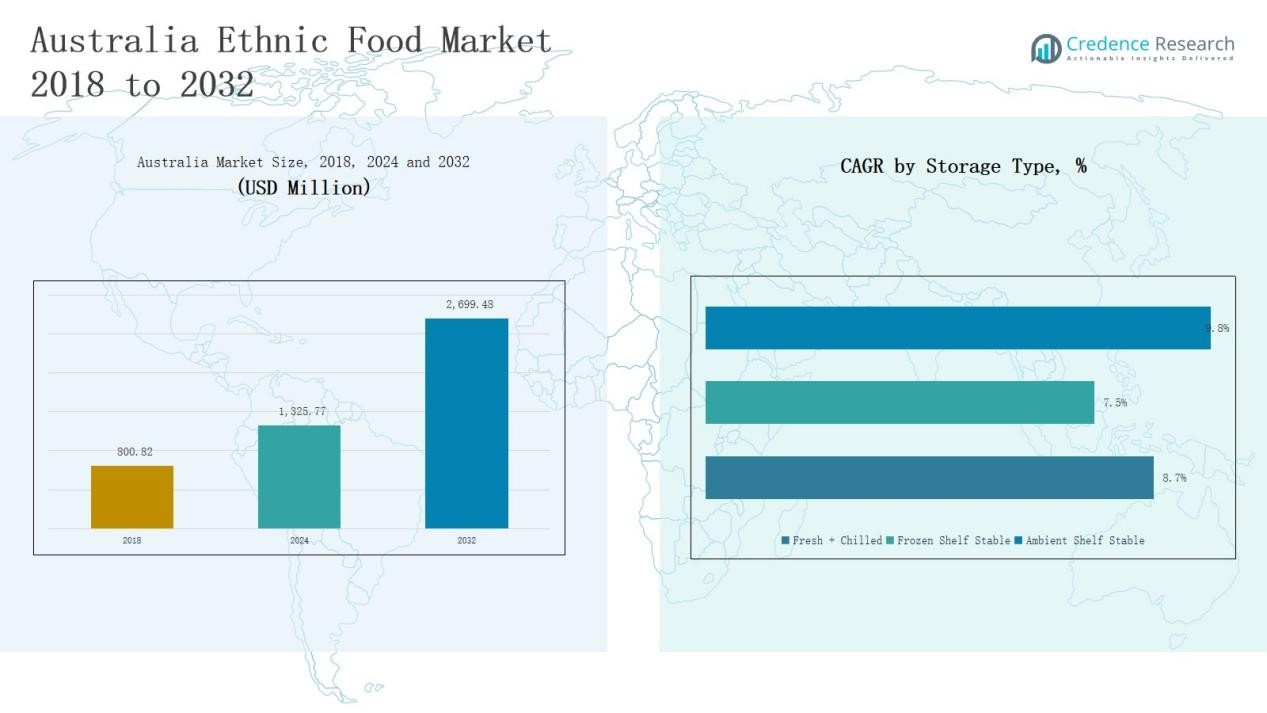
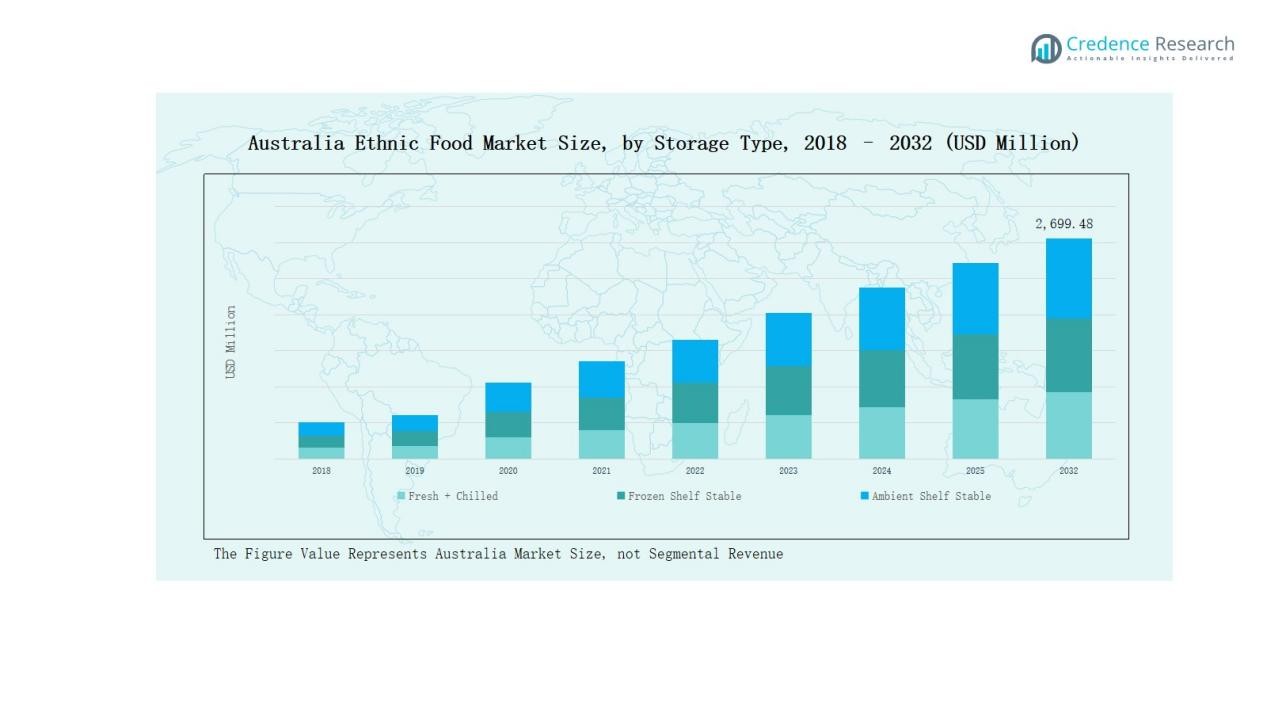
The Australia Ethnic Food Market was valued at USD 800.82 million in 2018, grew to USD 1,325.77 million in 2024, and is projected to reach USD 2,699.48 million by 2032, expanding at a CAGR of 8.66%.
| REPORT ATTRIBUTE |
DETAILS |
| Historical Period |
2020-2023 |
| Base Year |
2024 |
| Forecast Period |
2025-2032 |
| Australia Ethnic Food Market Size 2024 |
USD 1,325.77 Million |
| Australia Ethnic Food Market, CAGR |
8.66% |
| Australia Ethnic Food Market Size 2032 |
USD 2,699.48 Million |
The Australia Ethnic Food Market is driven by key players such as Gourmet Garden AU, SunRice Ltd, Kakadu Plum Co., Unilever PLC, JFC Australia Co Pty Ltd, Nestlé Australia Ltd, Ajinomoto Co., Inc., Mars Food Australia, Simplot Australia Pty Ltd, and Patak’s (AB World Foods Ltd.). These companies strengthen their market positions through diversified product portfolios, innovation in clean-label and plant-based ethnic foods, and robust retail distribution networks. They invest in sustainable sourcing and localized production to meet rising consumer demand for authentic and premium ethnic products. New South Wales emerged as the leading region in 2024, commanding a 33% share of the national market, supported by its dense multicultural population, developed retail infrastructure, and high concentration of ethnic food outlets across metropolitan areas.
Access crucial information at unmatched prices!
Request your sample report today & start making informed decisions powered by Credence Research Inc.!
Download Sample
Market Insights
- The Australia Ethnic Food Market grew from USD 800.82 million in 2018 to USD 1,325.77 million in 2024 and is expected to reach USD 2,699.48 million by 2032, expanding at a CAGR of 8.66%.
- Chinese Cuisine dominated the market with a 4% share in 2024, driven by strong Asian cultural influence, high restaurant presence, and availability of ready-to-cook options.
- The Sauces and Condiments segment held a 1% share, fueled by growing home cooking trends, demand for authentic flavors, and innovation in clean-label, vegan-friendly products.
- The Frozen Shelf-Stable category led storage types with a 7% share, supported by long shelf life, product freshness, and rising consumption of frozen ready meals and snacks.
- New South Wales emerged as the top regional market, holding a 33% share, supported by a multicultural population, developed retail infrastructure, and dense concentration of ethnic food outlets.
Market Segment Insights
By Type:
The Chinese Cuisine segment dominated the Australia Ethnic Food Market in 2024, accounting for 26.4% of the total share. Its popularity stems from the strong Asian population, high restaurant presence, and easy adaptability of Chinese flavors to local tastes. The segment benefits from growing availability of ready-to-cook meals and sauces across supermarkets. Demand for healthier recipes and plant-based Asian dishes further boosts category performance, supported by urban consumers seeking quick, flavorful, and familiar ethnic options.
- For instance, Golden Wok Foods launched its “Ready in Minutes” dumplings in mid-2024, but posts from Golden Wok Foods in mid-2024 indicate a launch of new dumplings at Woolworths
By Product:
The Sauces and Condiments segment led the market in 2024, holding 23.1% of the share. Growth is driven by rising home cooking trends, multicultural households, and consumer demand for authentic international flavors. Ethnic sauces from China, India, and Thailand gain traction for convenience and versatility. Manufacturers focus on clean-label formulations, reduced sodium, and vegan-friendly variants. Product innovation and packaging improvements enhance shelf appeal and drive wider adoption in both household and foodservice sectors.
- For instance, MDH Spices sells a Butter Chicken masala as a powdered blend, with some retailers advertising it as preservative-free. This aligns with clean-label trends, but the company does not offer it as a multi-use paste in a glass jar.
By Storage Type:
The Frozen Shelf-Stable segment accounted for the largest market share of 42.7% in 2024. Its dominance is supported by longer shelf life, ease of distribution, and preservation of product freshness. Rising consumption of frozen ready meals, snacks, and desserts fuels this segment’s growth. Retailers expand freezer space for ethnic foods, while brands innovate with portion-controlled packs and microwaveable options. Increasing preference for convenience and waste reduction continues to strengthen the frozen shelf-stable category’s position.

Key Growth Drivers
Rising Multicultural Population and Migration
Australia’s growing multicultural population continues to expand the consumer base for ethnic food products. Migration from Asia, the Middle East, and Latin America has introduced diverse cuisines, increasing demand for authentic flavors and traditional recipes. Ethnic restaurants, community events, and cultural festivals promote food diversity. This shift drives retail expansion for imported products and encourages domestic producers to develop locally made ethnic alternatives, supporting steady revenue growth and market penetration across metropolitan and suburban regions.
- For instance, Coles partnered with the Filipino brand Mama Sita’s to supply traditional sauces and marinades through its metropolitan outlets.
Expansion of Retail and E-Commerce Channels
Rapid growth in supermarket chains, specialty food stores, and online retail platforms significantly enhances ethnic food accessibility. Major retailers now dedicate specialized shelves for global cuisines, while e-commerce players offer extensive product variety and doorstep delivery. The trend supports smaller brands and imported labels in reaching wider audiences. Increased digital marketing and cross-border online sales further accelerate visibility and availability, making ethnic foods more accessible to Australian households and foodservice operators.
- For instance, Woolworths has increased its variety of international foods sourced through a global supply chain, alongside products from its domestic suppliers.
Consumer Shift Toward Authentic and Premium Offerings
Australian consumers increasingly favor authentic, premium ethnic food products made with traditional recipes and high-quality ingredients. Demand for clean-label, non-GMO, and gluten-free options grows as consumers prioritize health and transparency. Brands leverage storytelling, origin-based marketing, and premium packaging to create trust and appeal. This trend benefits regional producers and international exporters offering specialized or artisanal ethnic foods. The premiumization wave strengthens brand differentiation and drives higher margins in both retail and restaurant segments.
Key Trends & Opportunities
Innovation in Plant-Based and Fusion Ethnic Foods
Plant-based ethnic meals are emerging as a major innovation trend, blending global recipes with health-focused ingredients. Brands introduce vegan curries, meat-free dumplings, and soy-based Mediterranean dishes to meet sustainability goals and dietary preferences. Fusion formats combining Australian flavors with Asian or Latin cuisine attract younger consumers. These innovations enable brands to differentiate products while addressing rising demand for ethical and climate-conscious consumption across both retail and foodservice markets.
- For instance, Nestlé India collaborated with restaurant chains SOCIAL and BOSS Burger in 2024 to test a limited-period menu featuring its new plant-based range, which included a burger patty and mince.
Rising Demand from Foodservice and Ready-to-Eat Formats
The growing popularity of ready-to-eat and restaurant-quality ethnic foods presents strong opportunities for market players. Quick-service restaurants and catering services increasingly integrate global menus, while frozen and microwaveable ethnic meals gain traction among urban professionals. Manufacturers invest in advanced packaging and cold-chain logistics to preserve flavor authenticity. Expanding hospitality sectors and evolving dining habits continue to fuel growth in ethnic food offerings across cafes, hotels, and online delivery platforms.
- For instance, Moti Mahal Delux launched a ready-to-eat packaged food range featuring traditional North Indian vegetarian dishes like Dal and Butter Gravy, leveraging their strong restaurant heritage.
Key Challenges
Supply Chain Dependence on Imports
Australia’s ethnic food market faces challenges from import dependence, particularly for specialty spices, sauces, and ingredients sourced from Asia and Latin America. Fluctuating trade policies, freight costs, and currency variations increase procurement risks. These factors affect pricing stability and supply reliability. Local manufacturers are gradually building domestic alternatives through vertical integration and local farming partnerships, but reliance on imports remains a barrier to consistent supply and scalability across key product segments.
Regulatory and Labeling Compliance Issues
Complex labeling and import regulations pose compliance challenges for ethnic food producers and importers. Meeting Australia’s stringent food safety, allergen disclosure, and ingredient transparency standards requires continuous monitoring. Small and medium enterprises struggle with certification costs and adaptation to local requirements. Non-compliance risks product recalls or import restrictions, impacting brand reputation. Continuous alignment with Food Standards Australia New Zealand (FSANZ) regulations is essential for ensuring market trust and long-term business continuity.
Price Sensitivity and Competition Pressure
Intense competition among international brands, local manufacturers, and private labels creates price pressure in the market. Consumers seek value-driven options amid inflationary trends, making it difficult for premium ethnic food brands to maintain margins. Discount retailers and supermarket promotions amplify competition. To stay competitive, brands focus on product differentiation, localized flavor adaptation, and efficient distribution strategies. Balancing cost efficiency with authenticity and quality remains a core challenge for sustaining growth.

Regional Analysis
New South Wales
New South Wales held the leading position in the Australia Ethnic Food Market with a 33% share in 2024. The region benefits from its diverse population and strong presence of multicultural communities, particularly in Sydney. It supports a wide range of restaurants, specialty stores, and ethnic grocery outlets. The demand for Asian and Middle Eastern cuisines continues to expand due to urbanization and exposure to global flavors. Strong retail infrastructure and distribution networks enhance product accessibility. Continuous innovation in packaging and flavor customization further supports steady market growth in the region.
Victoria
Victoria accounted for 27% of the total market share in 2024, driven by Melbourne’s reputation as a multicultural food hub. It attracts consumers interested in global cuisines, including Indian, Chinese, and Mediterranean dishes. The presence of international students and migrants has contributed to increasing product demand in both retail and foodservice channels. The growing popularity of vegan and organic ethnic options also supports regional sales. Local producers invest in frozen and ready-to-eat categories to meet evolving consumption patterns. The state continues to be a strategic market for global ethnic food brands expanding in Australia.
Queensland
Queensland captured 18% of the Australia Ethnic Food Market in 2024. The region’s growing hospitality sector and tourist population stimulate ethnic food demand. Brisbane and Gold Coast drive the majority of sales through supermarkets and convenience outlets. Rising awareness of international cuisines encourages home cooking using ethnic sauces and condiments. Manufacturers focus on distribution partnerships and locally produced ethnic items to reduce dependency on imports. The region’s climatic diversity also supports the cultivation of select herbs and spices for domestic supply chains.
Western Australia
Western Australia represented 12% of the market share in 2024. Perth’s expanding multicultural base and increasing disposable income promote ethnic food consumption. The retail landscape supports both premium imported products and locally made offerings. Consumers favor ready-to-eat and frozen meals for convenience and longer shelf life. The regional foodservice industry plays a major role in driving demand through restaurants and catering services. Local distributors emphasize flavor authenticity and sustainable sourcing to attract environmentally conscious buyers.
South Australia and Others
South Australia and other smaller regions collectively accounted for 10% of the total market share in 2024. Growth is supported by urban expansion, increasing global trade, and migration-driven food diversity. Ethnic food availability has improved in supermarkets and specialty stores across Adelaide and surrounding cities. Rising consumer preference for Asian and Mediterranean cuisines supports ongoing product innovation. Local partnerships with foodservice providers enhance visibility and access. The steady growth across smaller states reinforces the market’s nationwide expansion potential.

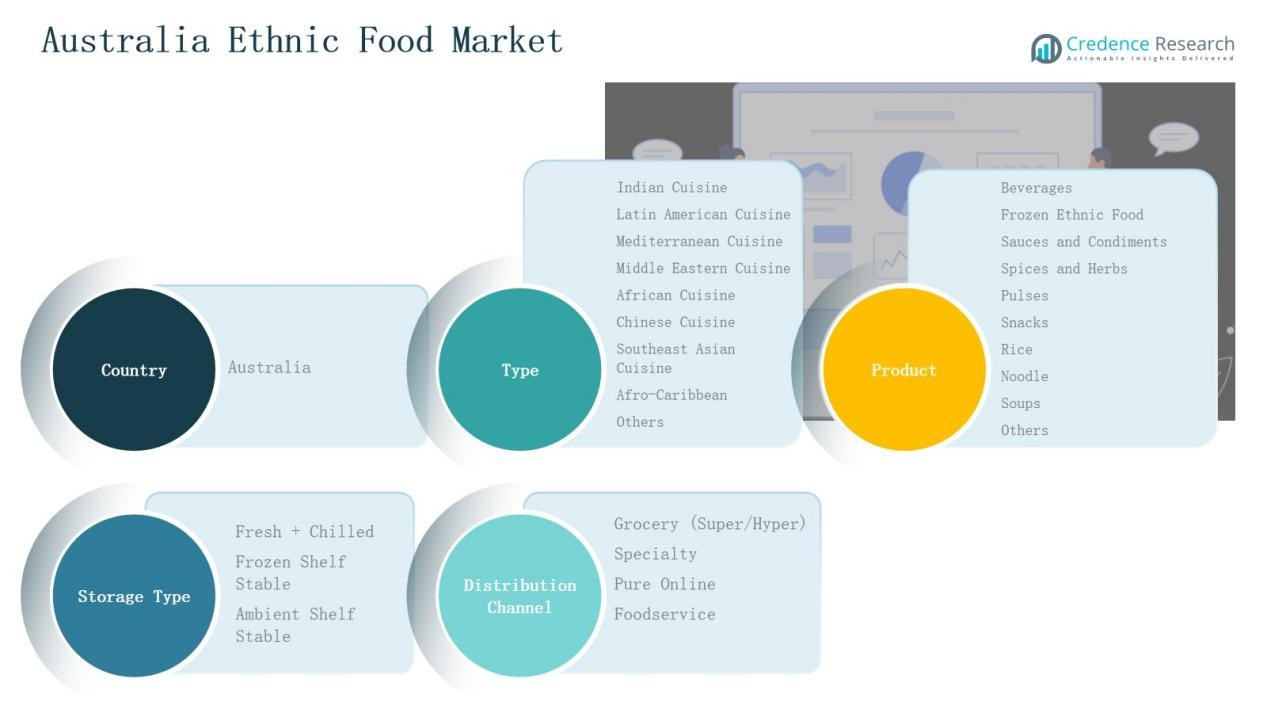
Market Segmentations:
By Type:
- Indian Cuisine
- Latin American Cuisine
- Mediterranean Cuisine
- Middle Eastern Cuisine
- African Cuisine
- Chinese Cuisine
- Southeast Asian Cuisine
- Afro-Caribbean Cuisine
- Others
By Product:
- Beverages
- Frozen Ethnic Food
- Sauces and Condiments
- Spices and Herbs
- Pulses
- Snacks
- Rice
- Noodle
- Soups
- Others
By Storage Type:
- Fresh + Chilled
- Frozen Shelf Stable
- Ambient Shelf Stable
By Distribution Channel:
- Grocery (Supermarkets & Hypermarkets)
- Specialty Stores
- Pure Online Retail
- Food Product Outlets / Foodservice
By Region
- New South Wales
- Victoria
- Queensland
- Westren Australia
- South Australia
- Others
Competitive Landscape
The Australia Ethnic Food Market is moderately fragmented, featuring a mix of global corporations, regional producers, and niche specialty brands. Key players include Gourmet Garden AU, SunRice Ltd, Kakadu Plum Co., Unilever, JFC Australia Co Pty Ltd, Nestlé Australia, and Ajinomoto Co., Inc. These companies compete through product innovation, strong distribution networks, and expanding multicultural product portfolios. Global brands leverage their international presence and R&D capabilities, while local firms focus on native ingredients and regional flavors. Increasing consumer interest in authentic, clean-label, and ready-to-eat ethnic foods drives continuous new product launches and premium product development. Partnerships between food manufacturers and retailers enhance visibility and accessibility across major supermarkets and online platforms. Companies invest in localized production, packaging innovation, and sustainable sourcing to strengthen competitiveness. Continuous innovation and alignment with evolving taste preferences remain critical for maintaining brand leadership and customer loyalty in this dynamic market.
Shape Your Report to Specific Countries or Regions & Enjoy 30% Off!
Key Players
- Gourmet Garden AU
- SunRice Ltd
- Kakadu Plum Co.
- Unilever PLC
- JFC Australia Co Pty Ltd
- Nestlé Australia Ltd
- Ajinomoto Co., Inc.
- Mars Food Australia
- Simplot Australia Pty Ltd
- Patak’s (AB World Foods Ltd.)
- McCormick Foods Australia Pty Ltd
- Kikkoman Australia Pty Ltd
- Monde Nissin Australia Pty Ltd
- Heinz (Kraft Heinz Company)
- Veetee Rice Ltd.
Recent Developments
- In August 2025, v2food acquired Daring Foods and entered a partnership with Ajinomoto to expand plant-based ethnic food offerings across Australia.
- In April 2025, Vow received regulatory approval to launch its cultured quail meat for sale in Australia and New Zealand, marking a milestone in the region’s alternative protein and ethnic food innovation landscape.
- In October 2024, Smart Foods acquired assets, IP, stock, and plant of The Aussie Plant-Based Co (including the vEEF and Love Buds brands).
- In August 2025, Greek-style QSR chain Zeus Street Greek partnered with Woolworths to launch a retail line (pilaf, sauces, pita kits) across Australia.
Report Coverage
The research report offers an in-depth analysis based on Type, Product, Storage Type, Distribution Channel and Region. It details leading market players, providing an overview of their business, product offerings, investments, revenue streams, and key applications. Additionally, the report includes insights into the competitive environment, SWOT analysis, current market trends, as well as the primary drivers and constraints. Furthermore, it discusses various factors that have driven market expansion in recent years. The report also explores market dynamics, regulatory scenarios, and technological advancements that are shaping the industry. It assesses the impact of external factors and global economic changes on market growth. Lastly, it provides strategic recommendations for new entrants and established companies to navigate the complexities of the market.
Future Outlook
- Demand for authentic global cuisines will continue rising across Australian households and restaurants.
- Expansion of multicultural communities will strengthen product diversity in the ethnic food sector.
- Retailers will increase dedicated shelf space for international and fusion food categories.
- Online food delivery and e-commerce platforms will play a larger role in product accessibility.
- Manufacturers will focus on clean-label, organic, and allergen-free ethnic food formulations.
- Local production partnerships will grow to reduce import dependence and enhance freshness.
- Innovation in plant-based and vegan ethnic meals will attract health-conscious consumers.
- Sustainable packaging and ethical sourcing will become key brand differentiation factors.
- Foodservice and hospitality sectors will increasingly integrate global flavors into menus.
- Continuous marketing and flavor localization will drive long-term brand loyalty and market expansion.


