
Solar irrigation and water missions reshape pump demand
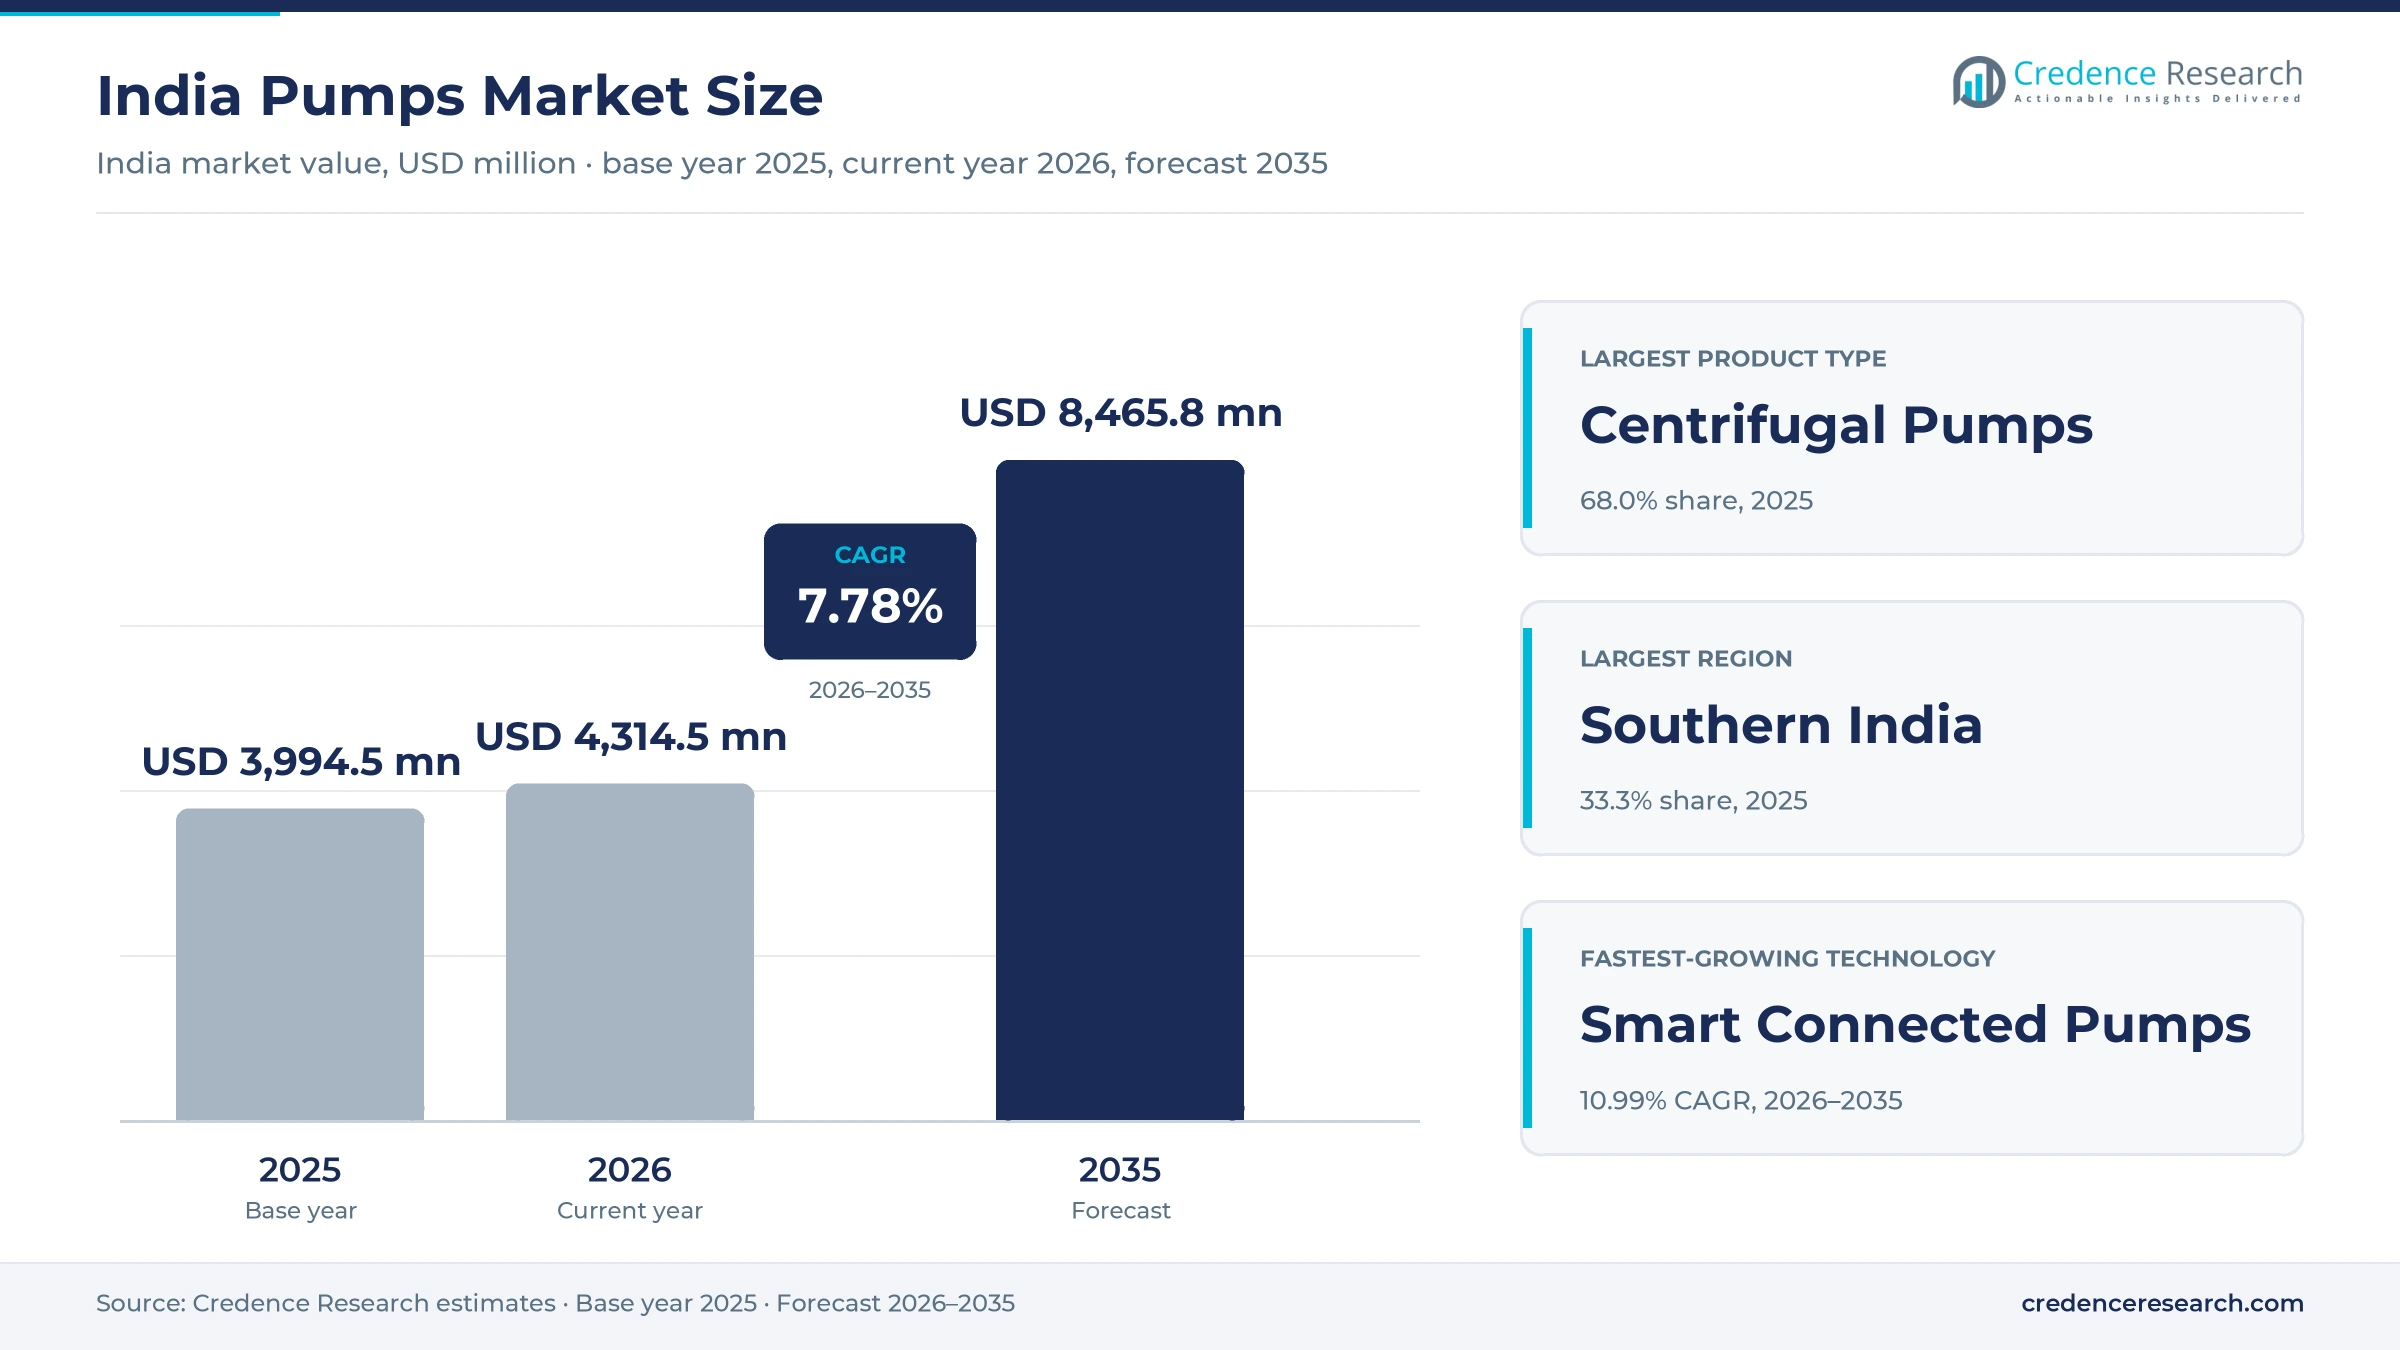
The India pumps market was valued at USD 3.99 billion in 2025 and is projected to increase from USD 4.31 billion in 2026 to USD 8.47 billion by 2035, registering a CAGR of 7.78% during 2026–2035. Demand comes from farmers moving from diesel and grid-fed sets to solar pumping systems, from rural and urban water supply schemes, and from power, process and building projects that need engineered pumps. Southern India held the largest regional share, 33.3% in 2025, because its farm, textile and building markets rely on dense dealer networks for borewell and domestic sets. Eastern India is the fastest-growing region at 8.52% a year, as solar irrigation and river basin sewerage projects expand from a smaller base. Buying patterns have also changed, because state power utilities and energy agencies now award solar pump contracts covering thousands of units at a time. As a result, tender capacity and installation speed decide which suppliers gain share in agriculture.
What does the estimate count, from borewell sets to process pumps?
The estimate measures the value of new pumps sold in India, including centrifugal, rotary and reciprocating positive displacement and special-purpose pumps with their motors, drives and controllers when sold as one set. It covers sales to farmers, municipal utilities, EPC contractors, industrial plants and building owners through direct, dealer, distributor, tender and online channels.
The estimate excludes spare parts, repair and rewinding services, standalone motors, exports and pumps built into vehicles or appliances. The value chain runs from castings, motor and electronics suppliers through pump makers to dealers, system integrators and EPC firms that install and commission the equipment on site.
India Pumps Market Insights
- The India pumps market was valued at USD 3.99 billion in 2025 and is projected to reach USD 8.47 billion by 2035, registering a CAGR of 7.78% during 2026–2035.
- Southern India held a 33.3% share of 2025 value, because farm borewells, textile clusters and building projects rely on dense dealer networks.
- Centrifugal pumps led with 68.0% of 2025 value, because submersible, monoset and split-case designs serve most water lifting and transfer duties.
- Components B and C of PM-KUSUM had 1,439,060 beneficiaries for pump installation or solarization, with 6,430 MW of capacity, as of June 30, 2025, based on a Lok Sabha reply.
- In August 2026, KSB Limited announced a planned 20% capacity expansion at its Shirwal plant in Satara, as power and oil and gas orders grew.
Centrifugal sets lead as smart connected units grow fastest
Why do centrifugal designs carry most of the value?
Based on product type, the market is categorized into centrifugal pumps, rotary positive displacement pumps, reciprocating positive displacement pumps and special-purpose pumps. Centrifugal Pumps led with 68.0% of 2025 value, because submersible, monoset and split-case designs handle most irrigation and water supply duties. Rotary Positive Displacement Pumps grow fastest at 8.48% a year, as wastewater, food and chemical plants need pumps for viscous fluids and sludge.
How do farms and utilities split end-use demand?
Based on end-use industry, the market is categorized into agriculture and irrigation, water and wastewater utilities, process industries and building services and infrastructure. Agriculture & Irrigation led with 38.0% of 2025 value, because borewell and solar pumps serve millions of farm connections. Water & Wastewater Utilities grow fastest at 8.38% a year, as rural tap water and urban sewerage schemes add pumping stations.
How fast are connected and solar pumps gaining ground?
Based on technology, the market is categorized into conventional fixed-speed pumps, variable-speed drive pumps, solar-powered pumps, smart connected pumps and high-efficiency IE3/IE4 pump-motor systems. Conventional Fixed-Speed Pumps led with 52.0% of 2025 value, because price-sensitive farm and domestic buyers still favor simple sets. Smart Connected Pumps grow fastest at 10.99% a year, as utilities and building owners add remote monitoring to cut energy use and downtime.
Which channels move pumps to Indian buyers?
Based on sales channel, the market is categorized into direct OEM sales, authorized distributors, dealer and retail networks, public tenders and EPC procurement, and digital and e-commerce channels. Dealer & Retail Networks led with 30.0% of 2025 value, because farmers and households buy most sets from local shops. Digital & E-Commerce Channels grow fastest at 10.72% a year, as small buyers compare domestic pumps online.
| Segment Group | Leading Sub-segment | Share, 2025 | Fastest-growing Sub-segment | CAGR, 2026–2035 |
|---|---|---|---|---|
| By Product Type | Centrifugal Pumps | 68.0% | Rotary Positive Displacement Pumps | 8.48% |
| By End-Use Industry | Agriculture & Irrigation | 38.0% | Water & Wastewater Utilities | 8.38% |
| By Technology | Conventional Fixed-Speed Pumps | 52.0% | Smart Connected Pumps | 10.99% |
| By Sales Channel | Dealer & Retail Networks | 30.0% | Digital & E-Commerce Channels | 10.72% |
Request a Free Sample
Fill in your details and we'll send you a free sample report.
- Sample data tables & charts
- Research methodology
Solar schemes, water budgets and plant capex lift orders
How is PM-KUSUM turning solar pumps into a volume market?
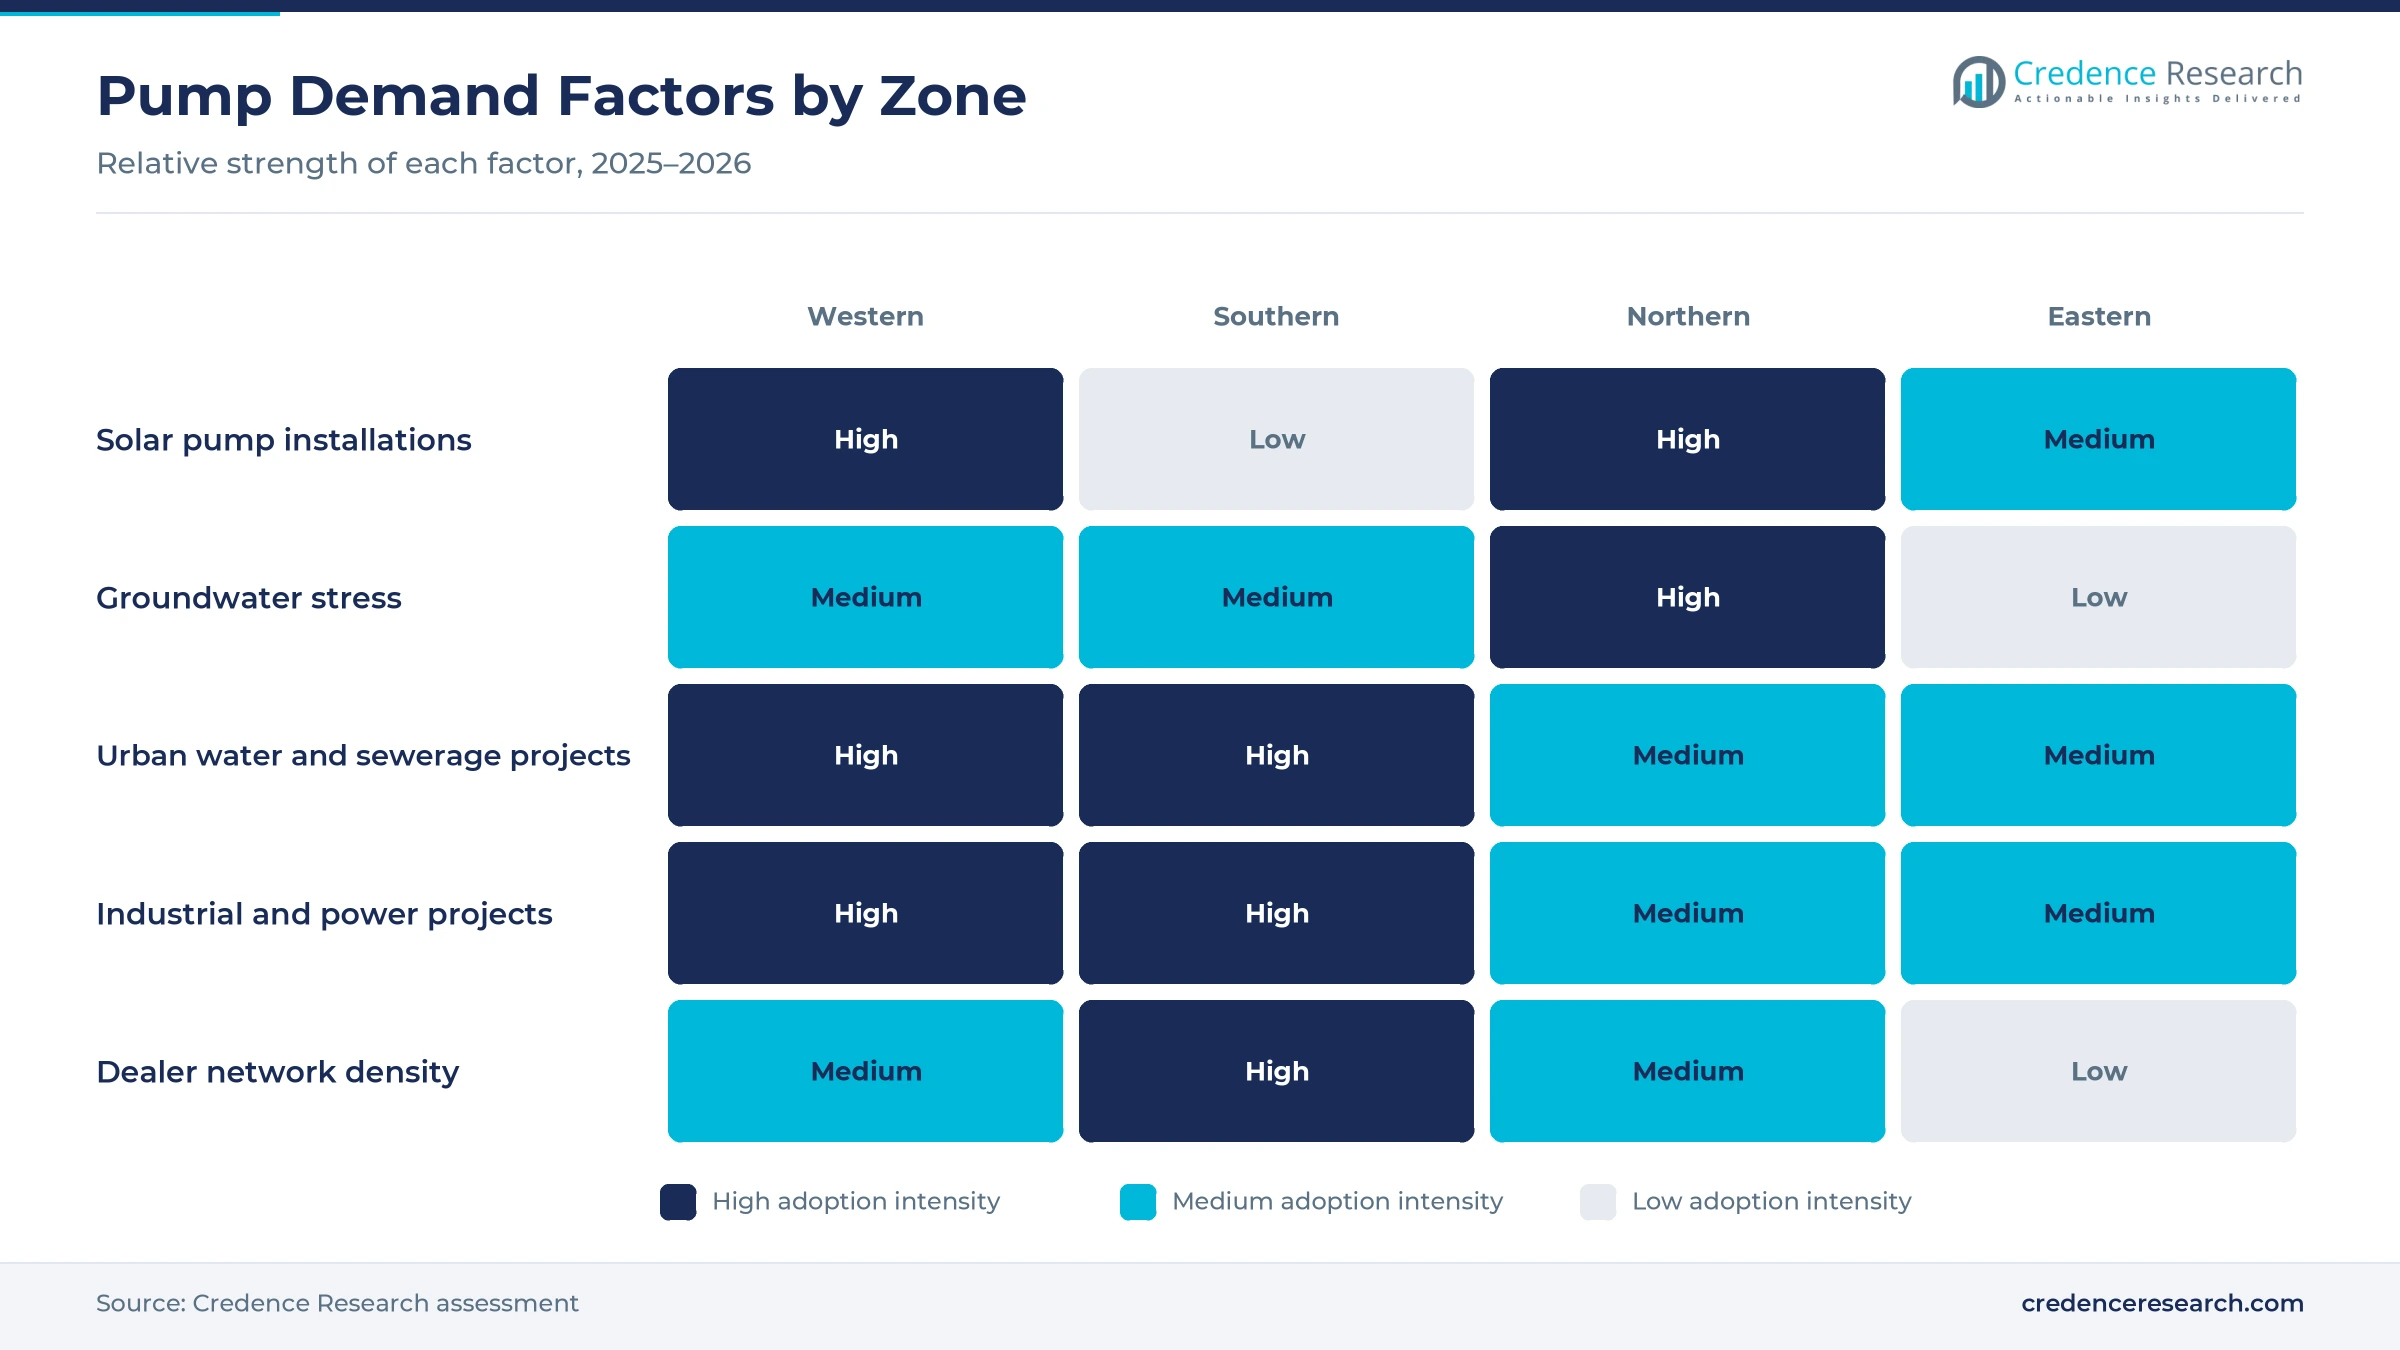
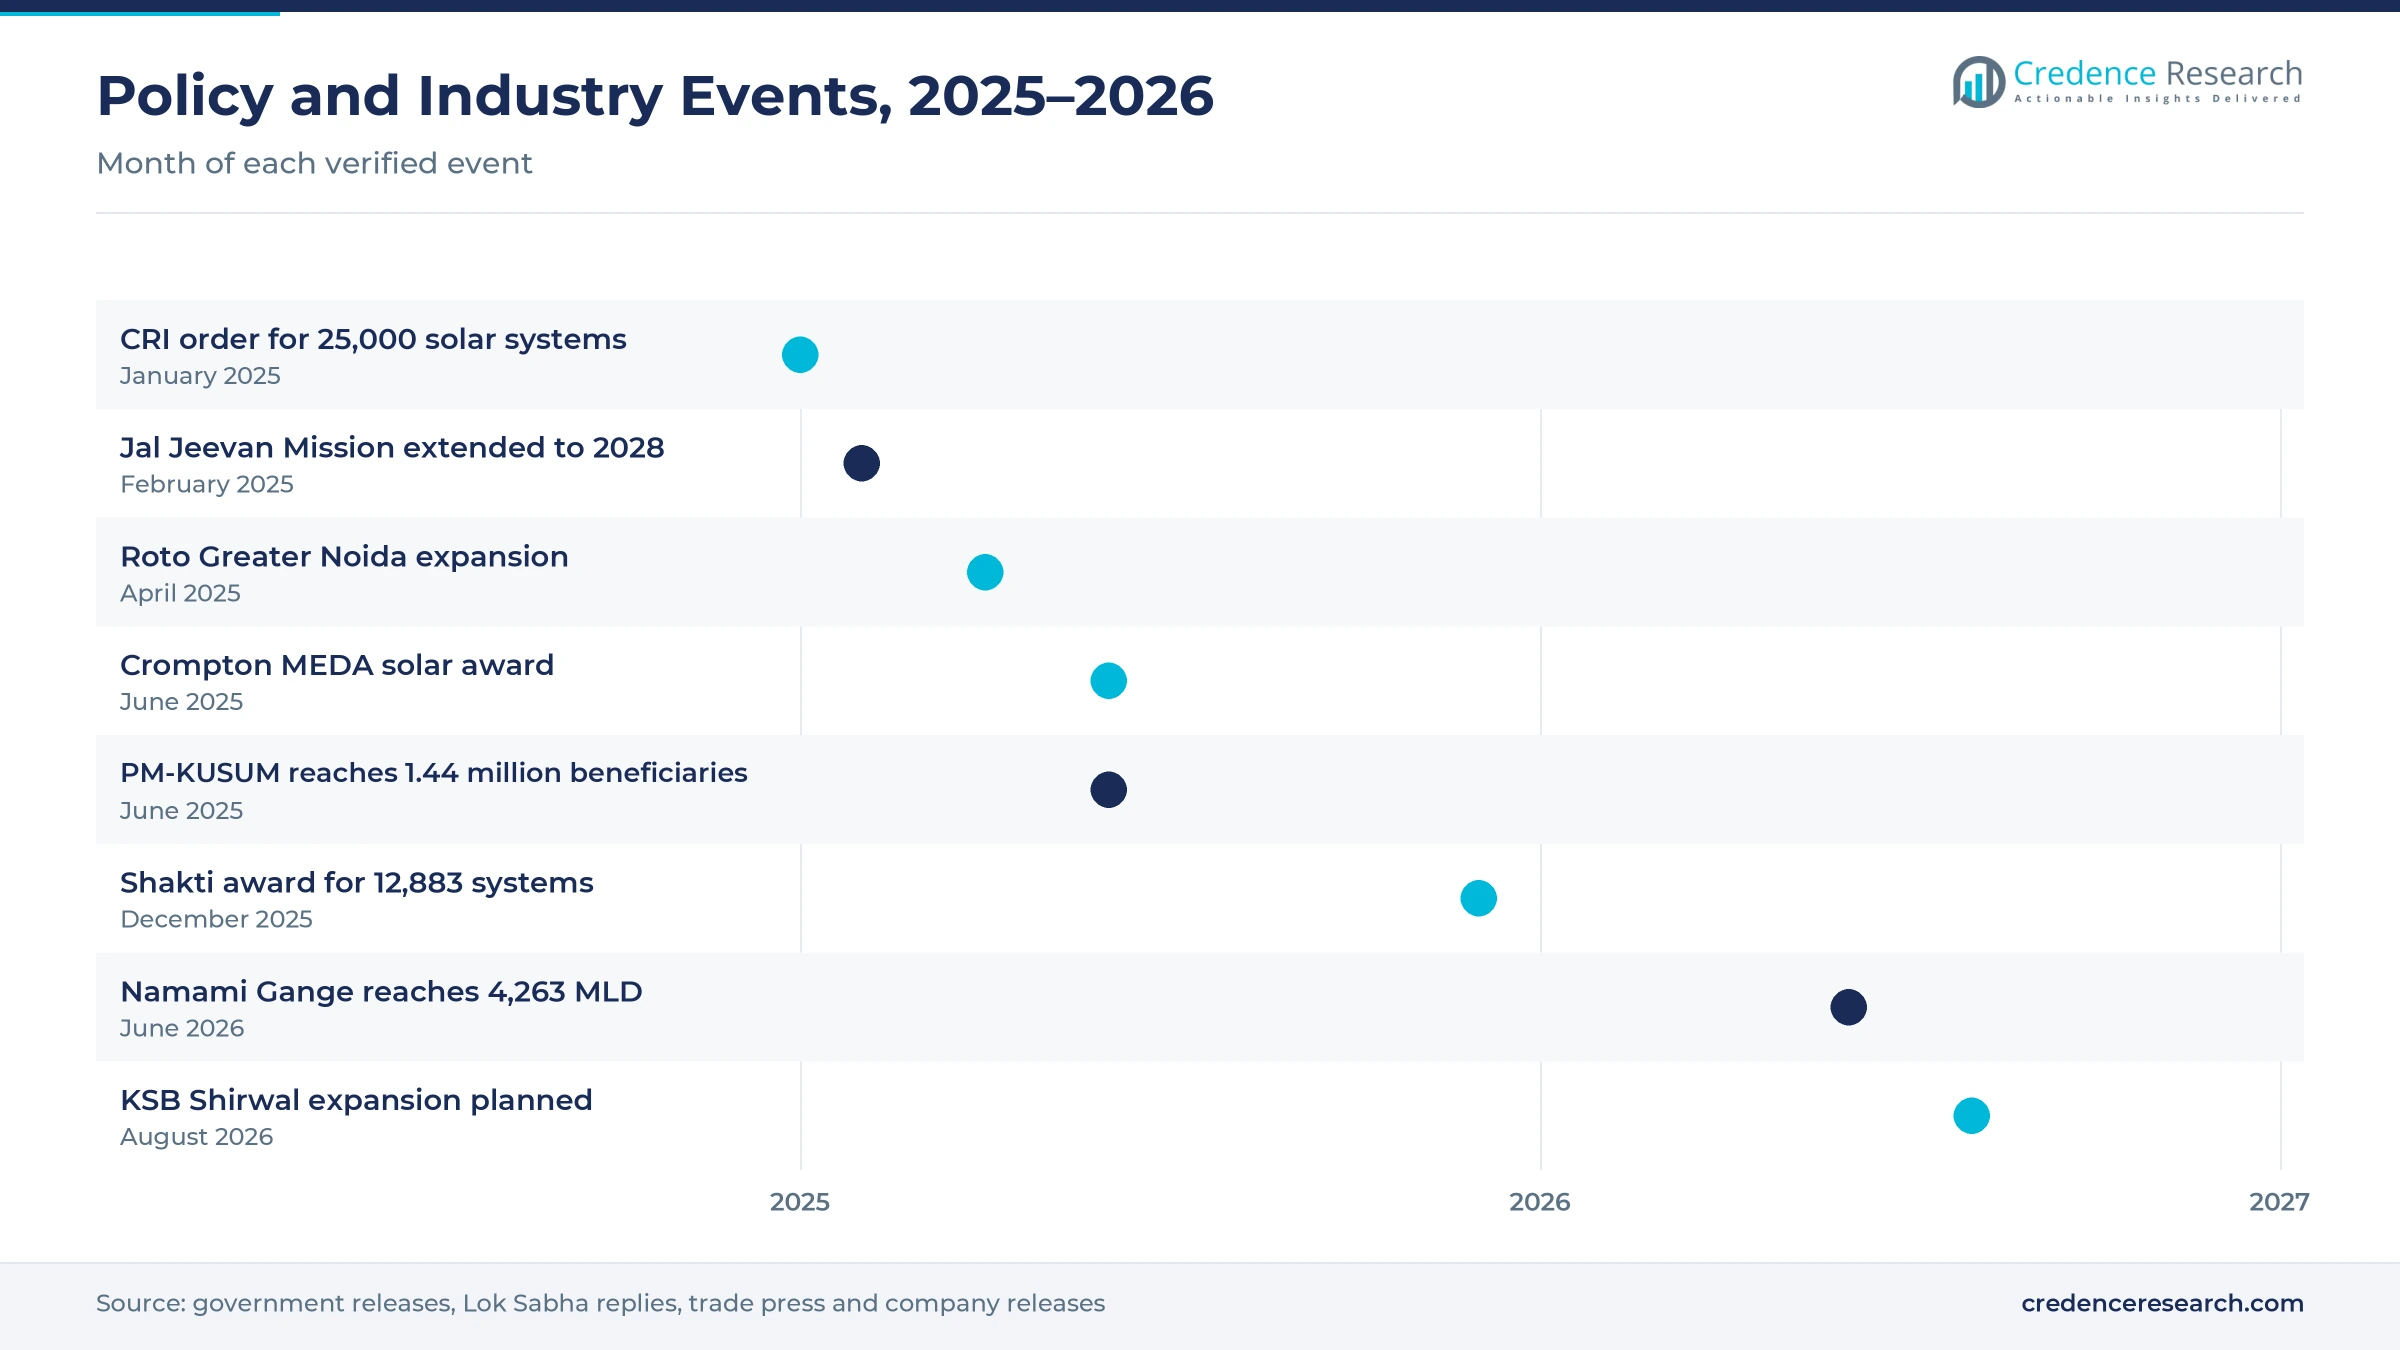
Solar irrigation has become the largest single source of new pump volumes, because state utilities now buy standalone solar pumping systems in tenders covering thousands of units. Off-grid installations under Component B of PM-KUSUM reached 903,000 by September 2025 against a target of 1.4 million, according to Business Standard. Components B and C had 1,439,060 beneficiaries for pump installation or solarization, with 6,430 MW of capacity, as of June 30, 2025, based on a Lok Sabha reply in August 2025. Maharashtra alone accounted for 727,019 of those beneficiaries, which shows how one state program can shape national demand. As a result, solar-powered pumps grow far faster than conventional fixed-speed sets, while agriculture and irrigation remain the largest end use with 38.0% of 2025 value.
Why do water and wastewater budgets keep utility orders flowing?
Public water programs keep a steady pipeline of orders for vertical turbine, split-case and submersible pumps, because every scheme needs intake, transfer and booster stations. The Jal Jeevan Mission had given tap connections to about 15 crore rural households when its deadline moved to 2028 in February 2025, with a 2025-26 outlay of INR 67,000 crore, as reported by Down To Earth. In cities, AMRUT 2.0 carries an indicative outlay of INR 299,000 crore and had approved 3,568 water supply projects and 592 sewerage and septage management projects, according to the Press Information Bureau. Namami Gange had created 4,263 MLD of sewage treatment capacity by June 2026, as reported by NBMCW. In turn, water and wastewater utilities grow fastest by end use at 8.38% a year.
How do industrial capex and efficiency upgrades lift demand?
Industrial buyers are adding capacity and replacing inefficient pump-motor sets at the same time, which lifts demand for engineered pumps and higher-efficiency packages. KSB Limited won an order for shutdown cooling pumps for Kaiga Units 5 and 6 in the June 2026 quarter, and it planned a 20% capacity expansion at its Shirwal plant in Satara for energy and oil and gas demand. Kirloskar Brothers reported orders for more than 100 vertical turbine pumps and 150 split-case pumps in its December 2025 quarter update. Motors and motor-driven systems account for up to 69% of industrial energy use, while 90% to 95% of motors in use are IE1 or below, according to Powerline. As a result, high-efficiency IE3/IE4 pump-motor systems gain share in plant retrofits.
Why does falling groundwater push buyers to deeper-set pumps?
Falling water tables force farmers and towns to lift water from greater depths, which shifts demand toward submersible sets with more stages and higher motor ratings. India extracted 245.64 bcm of groundwater in 2024, up from 241.34 bcm a year earlier, and the stage of extraction rose to 60.47%, according to Factly analysis of the national assessment. The same assessment classed 751 of 6,746 assessment units as over-exploited, with Punjab and Haryana inside the most stressed northwestern belt. Because deeper borewells need longer pump strings and stronger motors, each replacement tends to move farmers to higher-rated sets. In turn, Northern India holds 29.2% of 2025 value, and inverter-duty motors are used where drives run deep-well sets at variable speed.
State tenders, drives and engineered projects set the pace
How are large state solar tenders reshaping supplier ranks?
State utilities and energy agencies have shifted from small subsidy lots to very large solar pump contracts, which rewards suppliers with installation crews and working capital. CRI Pumps received an order for 25,000 solar pumping systems from the Maharashtra power distribution company in January 2025, as reported by Deccan Herald. Crompton Greaves Consumer Electricals won a letter of award from MEDA for 4,500 standalone systems under PM-KUSUM in June 2025. Shakti Pumps received an award for 12,883 systems in December 2025 and said it installed 8,846 units in one month, as Maharashtra set up 45,911 pumps, according to Energetica India. Each system pairs a pump and controller with solar PV modules, so public tenders and EPC procurement grow fastest among the larger channels.
Why is the shift toward drives and connected pumps rising?
Building owners, data center operators and utilities are moving from fixed-speed sets to pumps with integrated drives and remote monitoring, because energy and downtime costs now outweigh purchase price. Grundfos India launched its CUE120 drive in 2025 as a product made in India, and it commissioned 74 pumps in the first phase of a 300-pump IT cooling project. Kirloskar Brothers dispatched 15 smart fire sprinkler sets in its December 2025 quarter, while its KOSi-135 open-well submersible won an award at the National Energy Conservation Awards 2025. The building energy code requires IE3 or higher motors in large new commercial buildings, according to Powerline. As a result, variable-frequency drives are becoming standard in pressure boosting and circulation duties.
Can metros, data centers and nuclear plants open new demand?
Engineered infrastructure projects are an opening for suppliers that can certify pumps for critical duty, because these buyers pay for reliability rather than lowest price. KSB Limited won HVAC pumps for the Delhi Metro, a data center order and a water infrastructure order from Nashik Municipal Corporation for the Kumbh Mela in the June 2026 quarter. Kirloskar Brothers won concrete volute and vertical turbine pump sets for a supercritical thermal power plant in its December 2025 quarter. Grundfos India delivered more than 12 prefabricated pumping stations and 30 sewage pumps to the Panvel underground drainage project in 2025. In turn, building services and infrastructure hold a solid base as metro, building construction and data center pipelines grow.
Is export-grade manufacturing an opening for Indian makers?
Export-grade plants are an opening for Indian makers, because the same quality systems that win overseas orders also win demanding domestic process contracts. Indian pump exports reached USD 707.18 million from April to August of 2024-25, up 7.57% from a year earlier, according to the Engineering Export Promotion Council. Roto Pumps added 40,000 square meters of manufacturing space at Greater Noida in April 2025 and launched its P Range compact pumps for oil and gas, mining, wastewater and food processing. WPIL Limited draws over 70% of revenue from water supply and irrigation while building international business in Africa and Europe. As a result, rotary positive displacement pumps grow fastest by product type at 8.48% a year.
Scheme delays, cheap rivals and old motors cap margins
How do slow scheme components delay solar pump orders?
Solar pump demand depends on scheme budgets and deadlines, so slow execution in some components delays orders for suppliers. PM-KUSUM Component A had installed only 650.49 MW against a 10,000 MW target by September 2025, and officials expected a second deadline extension beyond March 2026. Several states and territories reported no Component B installations at all. As a result, suppliers face lumpy order flows and long payment cycles, which they manage by spreading tenders across several states.
Why does unorganized competition squeeze prices?
Small local assemblers compete hard on price in farm and domestic pumps, which limits pricing power for branded makers. Unorganized players supply nearly half of the price-sensitive agricultural and domestic segments, according to Indian Infrastructure. These sets often use lower-grade windings and castings, so buyers face higher running costs that are hidden at purchase. In turn, branded makers rely on dealer finance, warranties and certified efficiency to defend share, and KSB reported margin pressure in its June 2026 quarter.
How do voluntary labels and old motors slow efficiency gains?
Energy labelling for several pump types remains voluntary, so inefficient sets keep selling in price-led rural markets. The Bureau of Energy Efficiency label for diesel engine monoset farm pumps is voluntary, according to the International Energy Agency. Rewinding old motors can also cut efficiency by up to 5%, as reported by Powerline. As a result, farmers keep paying for wasted power, while utilities and state agencies push replacement through labelled sets in scheme purchases.
Why do long project cycles tie up working capital?
Utility and EPC projects run for years, so pump suppliers carry large order books that convert slowly into cash. WPIL Limited estimated its order book at over INR 4,000 crore in July 2026, and investors focused on execution timelines. Its integrated water supply project in West Bengal is set to run for about 30 months. In turn, smaller suppliers struggle to bid for large packages, which concentrates utility demand among firms with strong balance sheets and project teams.
Southern India leads as Eastern India grows fastest
| Region | Value, 2025 (USD billion) | Share, 2025 | CAGR, 2026–2035 |
|---|---|---|---|
| Southern India | 1.33 | 33.3% | 7.32% |
| Northern India | 1.17 | 29.2% | 7.82% |
| Western India | 0.95 | 23.8% | 7.92% |
| Eastern India | 0.55 | 13.7% | 8.52% |
How do dealer networks keep Southern India in first place?
Southern India held 33.3% of 2025 value and grows at 7.32% a year, because borewell irrigation, textile clusters and urban building projects all buy through dense dealer networks. Texmo Industries opened its 233rd Taro Pumps store at Hoskote in Karnataka in April 2026, after earlier store openings across Tamil Nadu, Karnataka and Telangana. Grundfos India runs its Chennai pump plant, which became the first pump site to earn TRUE Platinum zero-waste certification in 2025. However, Telangana reported no Component B installations by September 2025, according to Business Standard, so solar adds less to the zone than in the west.
Why do solar schemes and groundwater stress lift Northern India?
Northern India held 29.2% of 2025 value and grows at 7.82% a year, because deep borewells and large solar programs support replacement demand. Haryana had 157,073 solar pumps under Components B and C by June 2025, while Rajasthan had 155,909 and Uttar Pradesh 70,408, based on the Lok Sabha reply. Groundwater stress in Punjab and Haryana pushes farmers toward higher-rated submersible sets. Roto Pumps also expanded its Greater Noida plant in April 2025, which strengthens local supply of positive displacement pumps.

How does Maharashtra drive demand in Western India?
Western India held 23.8% of 2025 value and grows at 7.92% a year, because Maharashtra runs the largest solar pump program in the country. Maharashtra had 727,019 solar pumps under Components B and C by June 2025, while Gujarat had 195,541. KSB Limited plans to complete its Shirwal plant expansion in Satara in 2027, and it won a Nashik water infrastructure order for the Kumbh Mela. As a result, the zone combines heavy farm tender volumes with process, power and municipal demand.
Which projects drive the fastest growth in Eastern India?
Eastern India held 13.7% of 2025 value and grows fastest at 8.52% a year, because solar irrigation and river basin sewerage start from smaller bases. Jharkhand had 35,459 solar pumps under Components B and C by June 2025, and Shakti Pumps reported further orders from the state in December 2025. Namami Gange works across the Ganga basin target 6,610 MLD of treatment capacity through 219 sewerage projects. In turn, WPIL Limited is executing an integrated water supply project in West Bengal over about 30 months.

Solar orders, plant expansion and new products, 2025–2026
| Development | Status and market relevance |
|---|---|
| In January 2025, CRI Pumps received an order for 25,000 solar pumping systems from the Maharashtra power distribution company. | Supports the state farm solar pump program |
| In April 2025, Roto Pumps added 40,000 square meters of manufacturing space at Greater Noida and launched its P Range pumps. | Targets wastewater, mining and food processing |
| In June 2025, Crompton Greaves Consumer Electricals won a MEDA award for 4,500 standalone solar pumping systems under PM-KUSUM. | Adds solar volume to its farm pump range |
| In December 2025, Shakti Pumps received a Maharashtra award for 12,883 solar pumping systems. | Follows 8,846 installations in one month |
| In August 2026, KSB Limited planned a 20% capacity expansion at its Shirwal plant in Satara, Maharashtra. | Completion scheduled for 2027 |
Drives, solar controllers and remote monitoring spread
- Submersible borewell sets stack several impellers on a long motor string, which suits farmers drawing water from falling aquifers.
- Solar pump controllers convert panel output into variable motor speed, which lets standalone systems run without grid power or diesel.
- Variable-speed drives match pump speed to demand in buildings and plants, which cuts energy use in boosting and circulation duties.
- Remote monitoring sends pressure, flow and fault data to operators, which helps utilities manage sewer and supply stations.
- IE3 and IE4 motors lower losses compared with older IE1 motors, which matters most for pumps that run long hours.
Need a Custom Version of This Report?
Tailor the scope, geography, or segments to your exact requirements.
- Custom geography or segment scope
- Direct access to our analyst team
Tender wins and dealer reach separate the leaders
Competition centers on tender capacity, dealer reach, product range and certified efficiency, because buyers range from smallholder farmers to nuclear plant operators. Kirloskar Brothers and KSB Limited lead in engineered pumps for power, water and building projects, and both reported strong order books in 2025 and 2026. Shakti Pumps, CRI Pumps and Crompton compete hardest in state solar pump tenders, where installation speed and service networks decide awards. Texmo Industries keeps expanding its Taro Pumps store network in the south. WPIL Limited focuses on large water supply and irrigation packages, while Roto Pumps specializes in progressive cavity and other positive displacement designs. Grundfos India and Xylem India serve buildings, utilities and industry with drives and connected systems. Unorganized assemblers still supply nearly half of farm and domestic sets, so branded makers compete on reliability and warranty.
Companies profiled and their roles in this market
| Company | Type | Role in the market |
|---|---|---|
| Kirloskar Brothers Limited | Pump maker | Vertical turbine, split-case and solar orders; KOSi-135 award in 2025 |
| Shakti Pumps (India) Limited | Solar pump maker | Maharashtra award for 12,883 solar systems in December 2025 |
| KSB Limited | Pump and valve maker | Kaiga nuclear and Delhi Metro orders; Shirwal expansion planned |
| C.R.I. Pumps Private Limited | Pump maker | Order for 25,000 solar pumping systems in January 2025 |
| WPIL Limited | Pump maker and EPC firm | Water supply and irrigation projects, including West Bengal |
| Grundfos Pumps India Private Limited | Pump maker | Chennai plant; CUE120 drive launched in 2025 |
| Texmo Industries | Pump maker | Taro Pumps store network across southern states |
| Crompton Greaves Consumer Electricals Limited | Consumer and farm pump maker | MEDA award for 4,500 solar systems in June 2025 |
| Roto Pumps Limited | Positive displacement pump maker | Greater Noida expansion and P Range launch in April 2025 |
| Xylem Water Solutions India Private Limited | Water technology firm | Pump plant in Vadodara, Gujarat |
Credence Research view on Indian pump demand
Credence Research's view is that the India pumps market will grow steadily, because solar irrigation, rural and urban water schemes and industrial capacity additions all need new pumping equipment at the same time. Centrifugal designs keep most of the value, while smart connected and solar-powered pumps gain share from smaller bases. Southern India should stay the largest zone, while Eastern India grows fastest as solar and sewerage projects spread. Makers that combine tender capacity, certified efficiency and dealer service should gain the most share through the forecast period.
Scheme data, project records and filings anchor the model
The report uses 2025 as the base year on a calendar basis, and market values come from the Credence Research model. That model combines government scheme data, parliamentary replies, national groundwater and export statistics, and company filings and announcements. Segment splits and zone growth rates are Credence Research estimates, and regional shares are Credence Research estimates. Sources used are government releases, the International Energy Agency, trade press and company releases, and no interviews or surveys were used.
Solar, water and efficiency demand carry growth to 2035
Pump sales in India are expected to reach USD 8.47 billion by 2035, a 7.78% CAGR during 2026–2035, as solar irrigation, water supply and sewerage schemes and industrial projects keep orders flowing. Growth should stay strong while PM-KUSUM, the Jal Jeevan Mission and AMRUT 2.0 continue to fund new connections and stations. After that, replacement of old motors, wider use of drives and remote monitoring will set the pace. Faster scheme execution would lift volumes, while delays in subsidy payments would slow farm demand. Smart connected pumps are expected to gain the most share through 2035.
Frequently Asked Questions
How big is the India pumps market?
Which product type leads demand in India?
Which region leads the Indian market?
How many farmers have solar pumps under PM-KUSUM?
Why are water and wastewater utilities the fastest-growing end use?
How does groundwater depletion affect pump demand?
Who are the leading pump makers in India?
What are the main challenges for the market?
Table of Content
Chapter 1 Market Segmentation
- 1.1 Segmentation Framework
- 1.1.1 Product and Service Classification
- 1.1.2 Application and End-Use Classification
- 1.1.3 Technology and Solution Classification
- 1.1.4 Customer and Distribution Channel Classification
- 1.1.5 Geographic Segmentation
- 1.1.6 Market Segment Definitions and Boundaries
- 1.2 By Product Type
- 1.2.1 Centrifugal Pumps
- 1.2.2 Rotary Positive Displacement Pumps
- 1.2.3 Reciprocating Positive Displacement Pumps
- 1.2.4 Special-Purpose Pumps
- 1.3 By End-Use Industry
- 1.3.1 Agriculture & Irrigation
- 1.3.2 Water & Wastewater Utilities
- 1.3.3 Process Industries
- 1.3.4 Building Services & Infrastructure
- 1.4 By Technology
- 1.4.1 Conventional Fixed-Speed Pumps
- 1.4.2 Variable-Speed Drive Pumps
- 1.4.3 Solar-Powered Pumps
- 1.4.4 Smart Connected Pumps
- 1.4.5 High-Efficiency IE3/IE4 Pump-Motor Systems
- 1.5 By Sales Channel
- 1.5.1 Direct OEM Sales
- 1.5.2 Authorized Distributors
- 1.5.3 Dealer & Retail Networks
- 1.5.4 Public Tenders & EPC Procurement
- 1.5.5 Digital & E-Commerce Channels
Chapter 2 Introduction
- 2.1 Report Objectives and Scope
- 2.2 Product Definition and Industry Terminology
- 2.3 Market Inclusions and Exclusions
- 2.4 Research Process
- 2.4.1 Primary Research and Expert Interviews
- 2.4.2 Secondary Research and Source Review
- 2.4.3 Top-Down and Bottom-Up Estimation
- 2.4.4 Data Triangulation and Verification
- 2.5 Market Size Measurement Basis
- 2.5.1 2025: USD 3.99 billion → 2035: USD 8.47 billion
- 2.6 Historical and Forecast Reference Periods
- 2.6.1 Historical Period: 2018-2025
- 2.6.2 Base Year: 2025
- 2.6.3 Forecast Period: 2025-2035
- 2.7 Research Assumptions and Limitations
Chapter 3 Executive Summary
- 3.1 Market Snapshot and Key Findings
- 3.2 Base-Year Market Size, 2025
- 3.3 Forecast Market Size, 2035
- 3.4 Revenue and Volume Growth Outlook
- 3.5 Key Demand and Supply Indicators
- 3.6 Leading Market Segments
- 3.7 Fastest-Growing Market Opportunities
- 3.8 Regional Performance Highlights
- 3.9 Technology and Industry Transformation
- 3.10 Competitive Landscape Summary
- 3.11 Analyst View and Strategic Implications
Chapter 4 India Pumps Market Trends and Developments
- 4.1 Historical Industry Development, 2018-2025
- 4.2 Recent Market Trends and Developments
- 4.3 Demand and Customer Behavior Trends
- 4.4 Technology and Product Innovation
- 4.5 Artificial Intelligence, Automation and Digitalization
- 4.6 Local Manufacturing and Supply Chain Realignment
- 4.7 Industry Partnerships, Mergers and Acquisitions
- 4.8 Sustainability and Circular Economy Developments
- 4.9 Government and Private Sector Investment Trends
- 4.10 Emerging Business Models and Commercialization
- 4.11 Industry Developments and Announcements
Chapter 5 India Pumps Market Production, Supply and Demand Analysis
- 5.1 Demand Trend and Consumption Analysis, 2018-2025
- 5.2 Demand Forecast, 2025-2035
- 5.3 Production and Output Trend, 2018-2025
- 5.4 Production and Output Forecast, 2025-2035
- 5.5 Installed Capacity and Capacity Utilization
- 5.6 Company-Wise Production Plants and Statistics
- 5.6.1 Installed Production Capacity
- 5.6.2 Actual Production
- 5.6.3 Planned Capacity and Expansion Targets
- 5.7 Supply Chain Structure and Procurement Trends
- 5.8 Supply-Demand Gap and Bottlenecks
- 5.9 Import Dependence and Sourcing Structure
- 5.10 Contract Manufacturing and Outsourcing
- 5.11 Regional Supply and Demand Concentration
Chapter 6 India Pumps Market Pricing Analysis
- 6.1 Pricing Structure and Measurement
- 6.2 Historical Pricing Trends, 2018-2025
- 6.3 Pricing Outlook, 2025-2035
- 6.4 Average Selling Price and Unit Economics
- 6.5 Pricing by Product and Market Segment
- 6.6 Geographic Pricing Differences
- 6.7 Key Input, Energy, Labor and Logistics Costs
- 6.8 Contract Pricing and Purchasing Models
- 6.9 Pricing Sensitivity and Competitive Positioning
- 6.10 Price, Margin and Profitability Implications
Chapter 7 India Pumps Market Dynamics
- 7.1 Market Growth Drivers
- 7.1.1 Demand-Side Drivers
- 7.1.2 Technology and Innovation Drivers
- 7.1.3 Infrastructure and Investment Drivers
- 7.1.4 Regulatory and Policy Drivers
- 7.2 Market Restraints
- 7.2.1 Cost and Affordability Constraints
- 7.2.2 Technology and Adoption Barriers
- 7.2.3 Supply Chain and Operational Constraints
- 7.3 Market Challenges
- 7.3.1 Competitive Pressure and Margin Erosion
- 7.3.2 Skills, Infrastructure and Implementation Gaps
- 7.4 Emerging Market Opportunities
- 7.5 Market Dynamics Impact and Time-Horizon Assessment
Chapter 8 India Pumps Value Chain Analysis
- 8.1 Industry Value Chain Overview
- 8.2 Upstream Suppliers and Critical Inputs
- 8.3 Technology and Component Providers
- 8.4 Manufacturing or Service Delivery
- 8.5 Distribution, Channel Partners and Integrators
- 8.6 Downstream Applications and End Users
- 8.7 Value Addition and Profit Pools
- 8.8 Vertical Integration and Outsourcing
- 8.9 Supplier Concentration and Risk
- 8.10 Supply Chain Localization and Resilience
Chapter 9 India Pumps Market Regulations and Policies
- 9.1 Relevant Laws, Standards and Compliance Frameworks
- 9.2 Product, Service, Safety and Quality Requirements
- 9.3 Government Policies, Incentives and Subsidies
- 9.4 Imports, Exports and Trade Barriers
- 9.5 Public Procurement and Local Content Requirements
- 9.6 Environmental and Sustainability Compliance
- 9.7 Upcoming Policy Changes and Market Implications
Chapter 10 India Pumps Market Hotspots and Opportunities
- 10.1 Market Opportunity Mapping and Growth Hotspots
- 10.2 High-Growth Applications and Customer Groups
- 10.3 Underserved Markets and White-Space Opportunities
- 10.4 Emerging Technology and Product Opportunities
- 10.5 New Capacity and Investment Hotspots
- 10.6 Market Entry and Expansion Opportunities
- 10.7 Distribution and Partnership Opportunities
- 10.8 Near-Term and Long-Term Commercial Potential
- 10.9 Opportunity Attractiveness and Execution Risks
Chapter 11 India Pumps Market Outlook, 2025-2035
- 11.1 Market Size and Analysis
- 11.1.1 Revenue (Market Measurement: 2025: USD 3.99 billion → 2035: USD 8.47 billion)
- 11.1.2 Market Volume and Quantity Sold
- 11.1.3 Historical Market Size, 2018-2025
- 11.1.4 Base-Year Market Size, 2025
- 11.2 Market Forecast, 2025-2035
- 11.2.1 Revenue Forecast to 2035
- 11.2.2 Volume Forecast to 2035
- 11.2.3 CAGR and Year-on-Year Growth
- 11.2.4 Incremental Revenue Opportunity
- 11.3 Forecast Assumptions and Scenario Analysis
- 11.3.1 Base-Case Forecast
- 11.3.2 Optimistic and Conservative Scenarios
- 11.3.3 Technology, Pricing and Policy Sensitivities
- 11.4 Market Attractiveness and Growth Outlook
Chapter 12 India Pumps Market Segmentation and Outlook
- 12.1 Segmentation Summary and Market Shares, 2025
- 12.2 Largest and Fastest-Growing Segments
- 12.3 By Product Type - Market Size and Forecast, 2025-2035
- 12.3.1 Segment Definition and Scope
- 12.3.2 Historical Market Size, 2018-2025
- 12.3.3 Revenue Forecast, 2025-2035
- 12.3.4 Volume Forecast, 2025-2035
- 12.3.5 Base-Year Market Share, 2025
- 12.3.6 Segment CAGR and Growth Drivers
- 12.3.7 Subsegment Market Size and Forecast
- 12.3.7.1 Centrifugal Pumps
- 12.3.7.2 Rotary Positive Displacement Pumps
- 12.3.7.3 Reciprocating Positive Displacement Pumps
- 12.3.7.4 Special-Purpose Pumps
- 12.3.8 Subsegment Pricing and Adoption Trends
- 12.3.9 Leading Suppliers and Competition
- 12.3.10 Regional Demand and Opportunities
- 12.4 By End-Use Industry - Market Size and Forecast, 2025-2035
- 12.4.1 Segment Definition and Scope
- 12.4.2 Historical Market Size, 2018-2025
- 12.4.3 Revenue Forecast, 2025-2035
- 12.4.4 Volume Forecast, 2025-2035
- 12.4.5 Base-Year Market Share, 2025
- 12.4.6 Segment CAGR and Growth Drivers
- 12.4.7 Subsegment Market Size and Forecast
- 12.4.7.1 Agriculture & Irrigation
- 12.4.7.2 Water & Wastewater Utilities
- 12.4.7.3 Process Industries
- 12.4.7.4 Building Services & Infrastructure
- 12.4.8 Subsegment Pricing and Adoption Trends
- 12.4.9 Leading Suppliers and Competition
- 12.4.10 Regional Demand and Opportunities
- 12.5 By Technology - Market Size and Forecast, 2025-2035
- 12.5.1 Segment Definition and Scope
- 12.5.2 Historical Market Size, 2018-2025
- 12.5.3 Revenue Forecast, 2025-2035
- 12.5.4 Volume Forecast, 2025-2035
- 12.5.5 Base-Year Market Share, 2025
- 12.5.6 Segment CAGR and Growth Drivers
- 12.5.7 Subsegment Market Size and Forecast
- 12.5.7.1 Conventional Fixed-Speed Pumps
- 12.5.7.2 Variable-Speed Drive Pumps
- 12.5.7.3 Solar-Powered Pumps
- 12.5.7.4 Smart Connected Pumps
- 12.5.7.5 High-Efficiency IE3/IE4 Pump-Motor Systems
- 12.5.8 Subsegment Pricing and Adoption Trends
- 12.5.9 Leading Suppliers and Competition
- 12.5.10 Regional Demand and Opportunities
- 12.6 By Sales Channel - Market Size and Forecast, 2025-2035
- 12.6.1 Segment Definition and Scope
- 12.6.2 Historical Market Size, 2018-2025
- 12.6.3 Revenue Forecast, 2025-2035
- 12.6.4 Volume Forecast, 2025-2035
- 12.6.5 Base-Year Market Share, 2025
- 12.6.6 Segment CAGR and Growth Drivers
- 12.6.7 Subsegment Market Size and Forecast
- 12.6.7.1 Direct OEM Sales
- 12.6.7.2 Authorized Distributors
- 12.6.7.3 Dealer & Retail Networks
- 12.6.7.4 Public Tenders & EPC Procurement
- 12.6.7.5 Digital & E-Commerce Channels
- 12.6.8 Subsegment Pricing and Adoption Trends
- 12.6.9 Leading Suppliers and Competition
- 12.6.10 Regional Demand and Opportunities
- 12.7 Segment Growth Comparison
- 12.8 Segment Attractiveness and Priority Matrix
Chapter 13 India Pumps End-Use and Application Market Outlook
- 13.1 End-Use Industry and Customer Demand Structure
- 13.2 Leading Applications and Customer Groups
- 13.3 End-Use Market Size, Share and Forecast
- 13.4 Major End-Use Industry Deep Dives
- 13.4.1 Customer Requirements and Use Cases
- 13.4.2 Demand and Replacement Cycles
- 13.4.3 Technical and Regulatory Considerations
- 13.4.4 Purchasing and Procurement Models
- 13.4.5 Leading Vendors and Distribution Channels
- 13.4.6 Forecast and Commercial Opportunities
- 13.5 Emerging Applications and Cross-Segment Demand
- 13.6 End-Use Industry Investment Priorities
Chapter 14 India Pumps Geographic Market Outlook, 2025-2035
- 14.1 Domestic Market Distribution and Demand Clusters
- 14.2 State- or Province-Wise Market Size and Forecast, 2025-2035
- 14.3 City and Metropolitan Market Outlook
- 14.4 Industrial, Manufacturing and Commercial Clusters
- 14.5 Geographic Concentration of Key End Users
- 14.6 Local Pricing and Purchasing Differences
- 14.7 Domestic Production Facilities and Capacity Map
- 14.8 Local Infrastructure and Project Pipeline
- 14.9 State-Level Policy and Incentive Differences
- 14.10 Subnational Investment Hotspots and Opportunities
- 14.11 Distribution and Logistics Networks
- 14.12 Domestic Competitive Footprint
Chapter 15 India Pumps Technology, Innovation and Sustainability Outlook
- 15.1 Technology Landscape and Maturity
- 15.2 Product, Process and Service Innovation
- 15.3 AI, Automation and Digital Tools in the Industry
- 15.4 Technology Adoption and Performance Benchmarking
- 15.5 Innovation Pipeline and R&D Investment
- 15.6 Patent and Intellectual Property Trends
- 15.7 Energy Efficiency and Resource Management
- 15.8 Sustainability, Recycling and Circularity
- 15.9 Technology Roadmap, 2025-2035
- 15.10 Risks of Obsolescence and Technology Substitution
Chapter 16 India Pumps Market Key Strategic Imperatives
- 16.1 Growth and Market Entry Priorities
- 16.2 High-Return Products and Segments
- 16.3 Pricing, Profitability and Cost Optimization
- 16.4 Technology Investment and Product Differentiation
- 16.5 Supply Chain Localization and Resilience
- 16.6 Distribution and Customer Acquisition
- 16.7 Partnership, Acquisition and Capacity Strategy
- 16.8 Regional Expansion Priorities
- 16.9 Short-, Medium- and Long-Term Actions
Chapter 17 Competition Outlook
- 17.1 Industry Competition Characteristics
- 17.2 Market Structure and Concentration
- 17.3 Market Share and Competitive Positioning, 2025
- 17.4 Company-Wise Revenue and Product Benchmarking
- 17.5 Production and Service Capacity Benchmarking
- 17.6 Technology, Pricing and Differentiation
- 17.7 Regional Footprint and Distribution Strength
- 17.8 Mergers, Acquisitions and Strategic Alliances
- 17.9 New Entrants and Competitive Threats
- 17.10 Porter's Five Forces and Industry Attractiveness
- 17.11 Competitive Outlook, 2025-2035
Chapter 18 Company Profiles
- 18.1 Company Coverage and Selection Criteria
- 18.2 Kirloskar Brothers Limited
- 18.2.1 Business Description
- 18.2.2 Company Ownership and Geographic Presence
- 18.2.3 Product and Service Portfolio
- 18.2.4 Manufacturing and Operating Footprint
- 18.2.5 Production Capacity and Expansion Plans
- 18.2.6 Financial Performance and Investment
- 18.2.7 Market Share and Competitive Position
- 18.2.8 Technology and Innovation Capabilities
- 18.2.9 Strategic Alliances or Partnerships
- 18.2.10 Recent Developments
- 18.2.11 Growth Strategy and Outlook
- 18.3 Shakti Pumps (India) Limited
- 18.4 KSB Limited
- 18.5 C.R.I. Pumps Private Limited
- 18.6 WPIL Limited
- 18.7 Grundfos Pumps India Private Limited
- 18.8 Texmo Industries
- 18.9 Crompton Greaves Consumer Electricals Limited
- 18.10 Roto Pumps Limited
- 18.11 Xylem Water Solutions India Private Limited
- 18.12 Other Relevant Market Participants
Note: Every listed company is profiled on the structure shown under the first company. The company list is preliminary and may change based on research findings, market developments, data availability and client requirements.
Chapter 19 Disclaimer
- 19.1 Research and Forecast Disclaimer
- 19.2 Data Source and Estimation Limitations
Note: The depth of individual sections depends on data availability for this market. Volume, capacity, trade and other unit-based metrics are included where applicable.

