
Market Overview
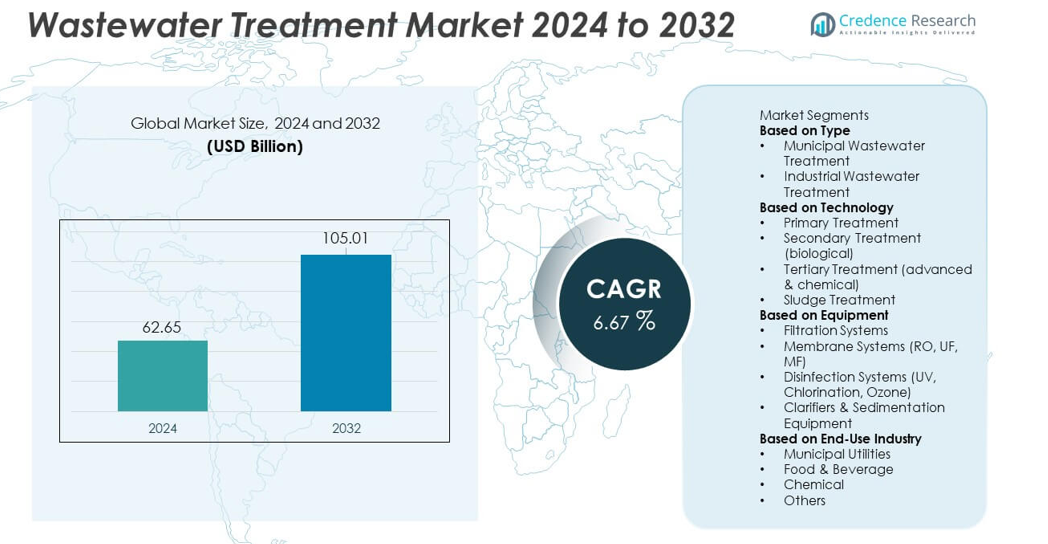
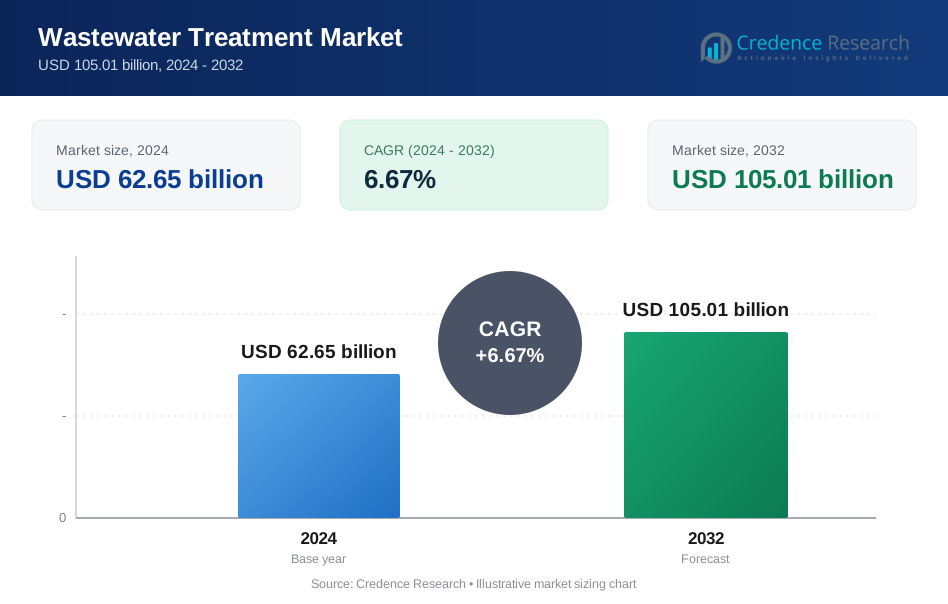
The Wastewater Treatment market size reached USD 62.65 billion in 2024 and is projected to reach USD 105.01 billion by 2032, supported by a 6.67% CAGR during the forecast period.
| REPORT ATTRIBUTE | DETAILS |
|---|---|
| Historical Period | 2020-2023 |
| Base Year | 2024 |
| Forecast Period | 2025-2032 |
| Wastewater Treatment market Size 2024 | USD 62.65 billion |
| Wastewater Treatment market, CAGR | 6.67% |
| Wastewater Treatment market Size 2032 | USD 105.01 billion |
Top players in the Wastewater Treatment market include leading global providers that focus on membrane systems, biological treatment technologies, and advanced sludge management solutions. These companies strengthen their presence through large municipal contracts, industrial partnerships, and investments in smart monitoring platforms that enhance energy efficiency and regulatory compliance. North America leads the market with a 34% share, driven by stringent discharge norms and modernization of aging treatment plants. Europe follows with a 30% share, supported by strong sustainability mandates and advanced nutrient-removal systems. Asia Pacific holds a 28% share, expanding rapidly due to rising urbanization, industrial growth, and large government-backed wastewater infrastructure projects.
Market Insights
- The Wastewater Treatment market reached USD 62.65 billion in 2024 and is set to grow at a 6.67% CAGR, driven by rising global demand for efficient water management.
- Strong market growth comes from expanding municipal wastewater needs and industrial compliance requirements, pushing adoption of advanced biological, membrane, and tertiary treatment systems.
- Key trends include smart monitoring, digital automation, and rising investment in membrane technologies, with secondary treatment leading the technology segment with a 48% share.
- Competitive activity intensifies as major players invest in energy-efficient systems, sludge-to-resource solutions, and long-term service contracts to support operational reliability across large utilities.
- North America leads with a 34% share, followed by Europe at 30% and Asia Pacific at 28%, while membrane systems dominate the equipment segment with a 39% share, supported by growing water reuse and high-purity treatment demand.
Market Segmentation Analysis:
By Type
Municipal wastewater treatment leads the segment with a 61% share, driven by rising urban populations, stricter discharge norms, and expanding public infrastructure. Governments invest heavily in treatment plants to manage domestic sewage and prevent contamination of surface and groundwater sources. Aging municipal networks in developed regions create strong demand for upgrades, while developing economies expand new capacity to meet sanitation goals. Industrial wastewater treatment holds the remaining share, supported by growing effluent output from chemicals, food processing, pharmaceuticals, and power plants. Rising compliance pressure and zero-liquid-discharge initiatives continue to boost investment across industrial facilities.
- For instance, Veolia deployed a biological treatment upgrade using a 245,000 m³/day capacity system at the Doha South facility (or a similar Veolia project site) or, more accurately, the Doha North Sewage Treatment Works (STW), which has a peak design capacity of 439,000 m³/day and was developed by Keppel Seghers for the public works authority in Qatar.
By Technology
Secondary treatment dominates the technology segment with a 48% share, supported by its essential role in biological degradation of organic pollutants across both municipal and industrial systems. Growing adoption of activated sludge, MBBR, and sequencing batch reactors strengthens its position. Primary treatment remains vital for solid removal and sedimentation but holds a smaller share as regulations push plants toward advanced purification stages. Tertiary treatment expands steadily due to rising demand for nutrient removal, disinfection, and water reuse. Sludge treatment gains traction as operators adopt efficient dewatering and anaerobic digestion to reduce disposal risks.
- For instance, the Brightwater Wastewater Treatment Facility in King County, Washington, is a large operating facility utilizing Membrane Bioreactor (MBR) technology in North America, with a design average flow capacity of 36 mgd (million gallons per day).
By Equipment
Membrane systems lead the equipment segment with a 39% share, driven by strong demand for RO, UF, and MF technologies used in water reuse, desalination, and high-purity industrial processes. Their ability to remove fine particles, pathogens, and dissolved solids supports widespread adoption. Filtration systems hold a steady share as they provide essential primary and secondary clarification functions. Disinfection systems grow due to increasing reliance on UV, ozone, and chlorination for safe effluent discharge. Clarifiers and sedimentation equipment remain critical in early treatment stages. Rising focus on reclaimed water and advanced purification continues to boost membrane system deployment.
Key Growth Drivers
Rising Urbanization and Expanding Municipal Wastewater Needs
Rapid urban expansion increases sewage generation and places greater pressure on municipal utilities, driving strong demand for advanced wastewater treatment systems. Cities invest in modern plants to manage rising loads, upgrade aging networks, and comply with stricter environmental regulations. Population growth and new residential developments require added treatment capacity and improved sanitation infrastructure. Governments also prioritize sustainable water management, encouraging recycling and reuse programs. These factors collectively strengthen the need for reliable municipal wastewater treatment solutions across both developed and developing regions.
- For instance, SUEZ is supplying equipment for the new Buaran III water treatment plant in Jakarta, which is designed to handle an additional 260,000 m³/day of clean water supply.
Stringent Environmental Regulations and Industrial Compliance Requirements
Tightening discharge standards push industries to adopt advanced wastewater treatment technologies that reduce pollutants, meet compliance targets, and support safer effluent disposal. Sectors such as chemicals, pharmaceuticals, food processing, and oil and gas face strict monitoring requirements that demand robust treatment systems. Regulatory bodies enforce penalties for non-compliance, compelling companies to upgrade outdated facilities. Zero-liquid-discharge initiatives and sustainability commitments further motivate industries to invest in modern treatment solutions. This ongoing compliance pressure drives continuous adoption of efficient and high-performance wastewater treatment technologies.
- For instance, Aquatech installed a ZLD system processing 22,000 m³/day for a major petrochemical complex.
Growing Focus on Water Reuse and Resource Recovery
Rising water scarcity encourages industries and municipalities to invest in systems that enable wastewater reuse for irrigation, cooling, and industrial processes. Advanced technologies such as membrane filtration, UV disinfection, and tertiary treatment support high-quality reclaimed water. Facilities also explore resource recovery through sludge-to-energy processes, nutrient extraction, and biogas generation, reducing operational costs and enhancing sustainability. The shift toward circular water management strengthens demand for efficient treatment solutions that maximize water reuse and minimize waste. This trend significantly boosts long-term market growth.
Key Trends & Opportunities
Adoption of Smart Monitoring and Automation Technologies
Digital transformation accelerates the use of automation, sensors, and real-time monitoring systems across wastewater treatment facilities. Smart controllers enhance process accuracy, reduce energy consumption, and support predictive maintenance. IoT-enabled platforms allow operators to detect performance issues early and optimize chemical dosing, aeration, and filtration. These advancements reduce operational costs and improve treatment efficiency. As water utilities modernize and industrial plants embrace digitalization, smart wastewater solutions create strong opportunities for advanced technology providers.
- For instance, Xylem acquired Sensus, a company whose smart metering devices support digital monitoring in utility networks, and are installed in the millions globally.
Expansion of Advanced Treatment and Membrane-Based Solutions
Growing demand for high-quality effluent and water reuse pushes facilities toward advanced treatment systems, including RO, UF, MF, and tertiary purification technologies. Membrane systems gain traction due to improved durability, lower maintenance needs, and better contaminant removal. Industries adopting zero-liquid-discharge strategies rely heavily on advanced filtration and evaporation techniques. These innovations open new opportunities in industrial clusters, desalination-linked facilities, and municipalities seeking to enhance water recovery rates. Continued R&D in membrane efficiency and fouling resistance further boosts this trend.
- For instance, DuPont Water Solutions provides many RO and UF membrane elements for reuse and ZLD operations globally. They have worked on significant projects, including a plant for Reliance Industries using up to 20,000 elements and a major desalination facility in Israel using 40,000 elements.
Key Challenges
High Capital Costs and Operational Expenses
Wastewater treatment plants often require significant upfront investment in equipment, construction, and advanced technology integration. Operational costs remain high due to energy-intensive processes, specialized labor needs, and ongoing maintenance requirements. Smaller municipalities and industries face financial barriers that delay upgrades or limit adoption of modern systems. Budget constraints also affect long-term sustainability of treatment operations. These cost-related challenges slow adoption, especially in developing regions with limited infrastructure spending.
Complex Sludge Management and Disposal Issues
Sludge generated during wastewater treatment presents handling, transportation, and disposal challenges that increase operational complexity. Environmental regulations restrict landfilling and promote safe disposal methods, forcing facilities to adopt costly dewatering, digestion, or thermal treatment technologies. Industrial sludge containing hazardous substances complicates treatment further. Odor control, storage, and compliance with disposal standards require ongoing investment. Effective sludge management remains one of the most demanding issues for treatment operators, impacting both cost and operational performance.
Regional Analysis
North America
North America holds a 34% share of the Wastewater Treatment market, driven by strict regulatory frameworks, advanced municipal infrastructure, and ongoing investments in upgrading aging treatment plants. The United States leads due to strong enforcement of the Clean Water Act and rising demand for nutrient removal technologies. Industrial sectors such as chemicals, pharmaceuticals, and food processing invest heavily in compliance-focused treatment systems. Growth in water reuse projects and smart monitoring technologies strengthens market expansion. Canada contributes through modernization of municipal facilities and increasing adoption of membrane filtration and disinfection systems across urban regions.
Europe
Europe accounts for a 30% share, supported by stringent wastewater directives, strong sustainability goals, and high adoption of advanced treatment technologies. Countries such as Germany, France, and the Netherlands invest in nutrient removal, tertiary treatment, and large-scale reuse initiatives. The region benefits from robust industrial wastewater regulations that drive adoption of high-performance biological and chemical treatment systems. EU funding programs support modernization of sewer networks and treatment infrastructure in Eastern Europe. A strong focus on circular water management and resource recovery further reinforces Europe’s leadership in advanced wastewater treatment solutions.
Asia Pacific
Asia Pacific holds a 28% share, driven by rapid urbanization, industrialization, and government-led investments in municipal sewage treatment infrastructure. China and India lead with large-scale construction of treatment plants to address pollution and improve water security. ASEAN countries expand capacity to support industrial growth in textiles, chemicals, and food processing. Rising awareness of water reuse and adoption of membrane-based technologies strengthen market momentum. Growing population density and expanding megacities continue to increase wastewater volumes, pushing the region toward higher investment in modern treatment and sludge management systems.
Latin America
Latin America represents a 5% share, driven by rising urban water demand, growing pollution concerns, and government initiatives to expand wastewater treatment coverage. Brazil and Mexico lead adoption as cities modernize sewer networks and industries upgrade effluent treatment systems to meet tightening regulations. Mining, food processing, and oil and gas sectors contribute significantly to industrial wastewater treatment needs. Limited infrastructure in rural areas presents challenges but also opens opportunities for decentralized treatment solutions. Continued investment in water quality improvement and public health initiatives supports steady market growth across the region.
Middle East & Africa
The Middle East & Africa region accounts for a 3% share, supported by increasing focus on water scarcity, desalination-linked wastewater reuse, and industrial development. Gulf countries such as the UAE and Saudi Arabia invest in advanced tertiary treatment and membrane technologies to support irrigation and non-potable reuse programs. Africa experiences growing demand due to urban expansion and the need to improve sanitation infrastructure, particularly in South Africa, Kenya, and Nigeria. Industrial zones adopt modern treatment systems to meet environmental standards. Rising investments in water recycling and sustainable resource management continue to shape long-term growth.
Market Segmentations:
By Type
- Municipal Wastewater Treatment
- Industrial Wastewater Treatment
By Technology
- Primary Treatment
- Secondary Treatment (biological)
- Tertiary Treatment (advanced & chemical)
- Sludge Treatment
By Equipment
- Filtration Systems
- Membrane Systems (RO, UF, MF)
- Disinfection Systems (UV, Chlorination, Ozone)
- Clarifiers & Sedimentation Equipment
By End-Use Industry
- Municipal Utilities
- Food & Beverage
- Chemical
- Others
By Geography
- North America
- U.S.
- Canada
- Mexico
- Europe
- Germany
- France
- U.K.
- Italy
- Spain
- Rest of Europe
- Asia Pacific
- China
- Japan
- India
- South Korea
- South-east Asia
- Rest of Asia Pacific
- Latin America
- Brazil
- Argentina
- Rest of Latin America
- Middle East & Africa
- GCC Countries
- South Africa
- Rest of the Middle East and Africa
Competitive Landscape
Major players in the Wastewater Treatment market include Veolia, SUEZ, Xylem, Ecolab, Pentair, DuPont Water Solutions, Aquatech International, Evoqua Water Technologies, Toshiba Water Solutions, and Kurita Water Industries. These companies strengthen their competitive positions through advanced membrane technologies, high-efficiency biological systems, and smart monitoring solutions that address rising municipal and industrial demand. Many invest in R&D to enhance nutrient removal, sludge management, and water reuse capabilities. Strategic partnerships with governments and industrial clients support long-term service contracts and large-scale EPC projects. Players also expand their global footprint through acquisitions, digital optimization platforms, and energy-efficient treatment solutions. As regulations tighten and water scarcity intensifies, leading companies focus on sustainable designs, modular systems, and decentralized treatment units to meet evolving client needs. Continuous innovation and service-oriented business models shape competition across global markets.
Key Player Analysis
- Veolia
- SUEZ
- Xylem
- Ecolab
- Pentair
- DuPont Water Solutions
- Aquatech International
- Evoqua Water Technologies
- Toshiba Water Solutions
- Kurita Water Industries
Recent Developments
- In November 2025, Xylem (along with peers like Veolia) was identified among leading firms in a market report related to the expansion of the mobile-water-treatment market and the advancement of membrane technology.
- In May 2025, Aquatech International was named “Water Technology Company of the Year” at the Global Water Summit, part of the Global Water Awards, for its various innovations including its BioMOD (modular, biological treatment solution), BioCon (integrated fixed-film activated sludge systems), and the development of AquaODA (high-purity water solutions for the semiconductor industry).
- In June 2024, Veolia Water Technologies & Solutions signed a global collaboration with Capture6 to deploy carbon dioxide removal alongside wastewater and industrial-water treatment operations.
Report Coverage
The research report offers an in-depth analysis based on Type, Technology, Equipment, End-Use Industry and Geography. It details leading market players, providing an overview of their business, product offerings, investments, revenue streams, and key applications. Additionally, the report includes insights into the competitive environment, SWOT analysis, current market trends, as well as the primary drivers and constraints. Furthermore, it discusses various factors that have driven market expansion in recent years. The report also explores market dynamics, regulatory scenarios, and technological advancements that are shaping the industry. It assesses the impact of external factors and global economic changes on market growth. Lastly, it provides strategic recommendations for new entrants and established companies to navigate the complexities of the market.
Future Outlook
- Demand for advanced treatment technologies will rise as water scarcity intensifies worldwide.
- Municipal utilities will invest more in modern plants and upgraded sewer networks.
- Adoption of membrane filtration and tertiary treatment will increase due to rising reuse needs.
- Industrial sectors will deploy high-performance systems to meet stricter discharge regulations.
- Smart monitoring and automation will expand to improve operational efficiency and reduce downtime.
- Decentralized and modular treatment units will gain popularity in developing regions.
- Sludge-to-energy and resource recovery solutions will see wider adoption across facilities.
- Energy-efficient treatment technologies will grow as utilities aim to reduce operating costs.
- Public-private partnerships will increase to support large infrastructure projects.
- Climate resilience programs will accelerate the need for robust and future-ready wastewater systems.
Request a Free Sample
Fill in your details and we'll send you a free sample report.
- Sample data tables & charts
- Research methodology
Need a Custom Version of This Report?
Tailor the scope, geography, or segments to your exact requirements.
- Custom geography or segment scope
- Direct access to our analyst team
Frequently Asked Questions
What is the current market size for the Wastewater Treatment market, and what is its projected size in 2032?
At what Compound Annual Growth Rate is the Wastewater Treatment market projected to grow between 2025 and 2032?
Which segment is leading the market share in terms of the type of wastewater?
Which region commanded the largest share of the Wastewater Treatment market in 2024?
Who are the leading companies in the Wastewater Treatment market?
Table of Content
Chapter 1. Report Introduction
- 1.1 Report Description & Purpose
- 1.1.1 Report Title & Market Definition
- 1.1.2 Unique Selling Propositions (USP) & Key Differentiators
- 1.1.3 Value Proposition for Stakeholders
- 1.2 Research Objectives
- 1.2.1 Market Sizing Objectives (Volume & Revenue) (Volume Where Applicable)
- 1.2.2 Segmentation Objectives
- 1.2.3 Competitive Intelligence Objectives
- 1.2.4 Forecast & Scenario Objectives
- 1.3 Report Scope
- 1.3.1 Wastewater Treatment Scope – Segments & Subsegments Covered
- 1.3.2 Geographic Scope – Regions & Countries Covered
- 1.3.3 Historical Period, Base Year & Forecast Period (2024; forecast to 2032)
- 1.3.4 Inclusions & Exclusions
- 1.4 Industry Classification & Applicable Codes
- 1.5 Currency, Measurement Units & Valuation Basis
- 1.6 Target Stakeholders
- 1.7 Limitations & Assumptions
Chapter 2. Executive Summary
- 2.1 Global Wastewater Treatment Market Snapshot
- 2.1.1 Market Size – Historical (2024) & Forecast (2024-2032) (2024: USD 62.65 billion → 2032: USD 105.01 billion)
- 2.1.2 Volume & Revenue – Global Totals (Volume Where Applicable)
- 2.1.3 Key Market Highlights – Top Five Facts
- 2.2 Wastewater Treatment Market Segmentation Snapshot
- 2.2.1 Market Split by Region – 2024 vs. 2032
- 2.3 Competitive Snapshot
- 2.3.1 Top 10 Players by Revenue Share – 2024
- 2.3.2 Top 10 Players by Volume Share – 2024 (Volume Where Applicable)
- 2.3.3 Recent Strategic Developments (18-Month Summary)
- 2.4 Key Investment Highlights & Strategic Conclusions
Chapter 3. Wastewater Treatment Market Dynamics & Industry Analysis
- 3.1 Market Overview & Context
- 3.1.1 Wastewater Treatment Market Position in the Broader Industry Value Chain
- 3.1.2 Demand Structure & Purchasing Dynamics
- 3.1.3 Market Maturity & Development Stage by Region
- 3.2 Wastewater Treatment Market Drivers
- 3.3 Wastewater Treatment Market Restraints & Challenges
- 3.4 Wastewater Treatment Market Opportunities
- 3.5 Porter's Five Forces Analysis
- 3.5.1 Threat of New Entrants
- 3.5.2 Bargaining Power of Suppliers
- 3.5.3 Bargaining Power of Buyers
- 3.5.4 Threat of Substitutes
- 3.5.5 Competitive Rivalry – Intensity Assessment
- 3.6 Wastewater Treatment Value Chain Analysis
- 3.6.1 Upstream – Key Inputs, Resources & Suppliers
- 3.6.1.1 Key Input/Resource 1
- 3.6.1.2 Key Input/Resource 2
- 3.6.1.3 Key Input/Resource 3
- 3.6.2 Midstream – Core Operations & Value Creation
- 3.6.2.1 Operating Model & Process Overview
- 3.6.2.2 Key Operating Locations & Capabilities by Company
- 3.6.3 Downstream – Market Channels & End Users
- 3.6.3.1 Direct Sales & Customer Engagement Channels
- 3.6.3.2 Indirect Sales, Intermediaries & Partner Channels
- 3.6.4 Value Chain Profitability Analysis
- 3.6.1 Upstream – Key Inputs, Resources & Suppliers
- 3.7 PESTEL Analysis
- 3.7.1 Political Factors
- 3.7.2 Economic Factors
- 3.7.3 Social Factors
- 3.7.4 Technological Factors
- 3.7.5 Environmental Factors
- 3.7.6 Legal Factors
- 3.8 Wastewater Treatment Supply Chain Analysis
- 3.8.1 Critical Input & Resource Availability Risk Assessment
- 3.8.2 Supplier & Operational Concentration Risk (Geographic Exposure)
- 3.8.3 Supply & Service Disruption Impact Analysis
- 3.9 Regulatory & Policy Landscape
Note: The regulatory and policy landscape section covers regulations based on their applicability to the market, Wastewater Treatment category, geography, and scope of the study. Only regulatory frameworks with a material impact on operations, compliance, trade, sustainability, or market access are analyzed in detail.
Chapter 4. Key Investment Pockets & Opportunity Analysis
- 4.1 Wastewater Treatment Market Attractiveness Analysis
- 4.1.1 By Region – Investment Attractiveness Matrix (Market Size × CAGR)
- 4.2 Absolute Revenue Growth Opportunity
- 4.2.1 By Region – Absolute Revenue Growth Through 2032
- 4.3 Incremental Demand Opportunity
- 4.3.1 By Region – Incremental Demand Through 2032
- 4.3.2 Segment – Incremental Demand
- 4.4 Emerging Submarket Opportunity Deep Dive (Subject to Applicability)
- 4.5 Priority Market Opportunity Scorecards
- 4.5.1 United States
- 4.5.2 Europe
- 4.5.3 Asia
- 4.5.4 Middle East & Africa
Note: Priority market opportunity scorecards reflect the geographic scope and strategic relevance of the study. Listed markets are indicative and may be adapted to the industry.
Chapter 5. Wastewater Treatment Cross-Border Trade & Market Access Analysis
- 5.1 International Trade & Cross-Border Activity Overview
- 5.1.1 Global Export Value by Country (2024)
- 5.1.2 Global Export Volume by Country (2024) (Volume Where Applicable)
- 5.1.3 Global Import Value by Country (2024)
- 5.1.4 Global Import Volume by Country (2024) (Volume Where Applicable)
- 5.1.5 Net Trade Balance by Country (2024)
- 5.2 Export Analysis – Segment
- 5.2.1 Category 1 (Applicable Classification Code)
- 5.2.2 Category 2 (Applicable Classification Code)
- 5.2.3 Category 3 (Applicable Classification Code)
- 5.2.4 Category 4 (Applicable Classification Code)
- 5.2.5 Category 5 (Applicable Classification Code)
- 5.3 Import Analysis – Segment
- 5.3.1 Category 1 (Applicable Classification Code)
- 5.3.2 Category 2 (Applicable Classification Code)
- 5.3.3 Category 3 (Applicable Classification Code)
- 5.3.4 Category 4 (Applicable Classification Code)
- 5.3.5 Category 5 (Applicable Classification Code)
- 5.4 Cross-Border Pricing & Transaction Benchmarks
- 5.4.1 Export Pricing – Segment & Country
- 5.4.2 Import Pricing – Segment & Source Country
- 5.4.3 Price Trends (2024)
- 5.5 Key Cross-Border Trade & Delivery Routes
- 5.5.1 Cross-Border Trade/Delivery Route 1
- 5.5.2 Cross-Border Trade/Delivery Route 2
- 5.5.3 Cross-Border Trade/Delivery Route 3
- 5.5.4 Cross-Border Trade/Delivery Route 4
- 5.5.5 Cross-Border Trade/Delivery Route 5
- 5.6 Trade Policy & Market Access Impact Assessment
- 5.6.1 Tariff & Non-Tariff Barriers
- 5.6.2 Regional Trade & Economic Integration Frameworks
- 5.6.3 Bilateral & Multilateral Trade Agreements
- 5.6.4 Cross-Border Operating, Licensing & Localization Requirements
Note: This chapter applies where cross-border trade or delivery is relevant to Wastewater Treatment. Goods, services, and digital offerings are assessed using applicable classifications and transaction measures. Import-export volumes, trade balances, and route analyses are included only where meaningful to the market.
Chapter 6. Competitive Landscape & Company Benchmarking
- 6.1 Wastewater Treatment Market Concentration & Structure
- 6.1.1 Herfindahl-Hirschman Index (HHI) – vs. 2024
- 6.1.2 Leading, Mid-Sized & Emerging Player Structure
- 6.1.3 Global, Regional & Local Player Dynamics
- 6.2 Wastewater Treatment Market Share Analysis – 2024
- 6.2.1 Global Revenue Share by Company
- 6.2.2 Global Volume Share by Company (Volume Where Applicable)
- 6.2.3 Regional Revenue Share
- 6.2.4 Market Share Evolution ( vs. 2024)
- 6.2.5 Company Market Share by Key Segment
- 6.2.6 Company Market Share by Customer Group
- 6.3 Operating Scale, Capacity & Infrastructure Analysis
- 6.3.1 Global Operating Scale & Supply Capacity
- 6.3.2 Resource Utilization & Operating Efficiency
- 6.3.3 Output, Service Delivery & Activity Metrics
- 6.3.4 Operating Footprint & Infrastructure Map
- 6.3.5 Planned Operational & Capacity Expansion
- 6.4 Wastewater Treatment Competitive Benchmarking Matrix
- 6.4.1 Revenue, Growth, Profitability & Operating Metric Comparison
- 6.4.2 Channel Revenue Mix
- 6.4.3 Geographic Revenue Exposure
- 6.4.4 R&D Intensity
- 6.4.5 Sustainability Maturity
- 6.5 Strategic Developments in Wastewater Treatment (Last 24 Months)
- 6.5.1 Mergers, Acquisitions & Divestments
- 6.5.2 New Products, Services & Solutions in Wastewater Treatment
- 6.5.3 Operational & Infrastructure Expansions
- 6.5.4 Strategic Alliances, Joint Ventures & Partnerships
- 6.5.5 Distribution Expansion & Market Entry
- 6.5.6 Sustainability & ESG Initiatives
- 6.6 Competitive Strategy Mapping
- 6.6.1 Leader, Challenger, Follower & Niche Classification
- 6.6.2 Pricing Strategy Comparison
- 6.6.3 Channel Strategy Matrix
Note: Strategic developments are included based on their materiality and the availability of reliable information.
Chapter 7. Global Wastewater Treatment Market – By Sales & Delivery Channel
- 7.1 Segment Overview
- 7.1.1 Volume & Revenue Split by Channel (2024 & 2032) (Volume Where Applicable)
- 7.1.2 Channel Mix Evolution (2024-2032)
Chapter 8. Regional Market Analysis – Global Overview
- 8.1 Global Regional Overview
- 8.1.1 Regional Volume Share (Volume Where Applicable)
- 8.1.2 Regional Revenue Share
- 8.1.3 Regional Volume by Region (Volume Where Applicable)
- 8.1.4 Regional Revenue by Region
- 8.1.5 Regional Forecast Through 2032
- 8.2 Cross-Regional Segment Analysis
- 8.2.1 By Sales & Delivery Channel
- 8.2.2 By Competitive Positioning & Price Tier
Chapter 9. North America Wastewater Treatment Market
- 9.1 United States
- 9.2 Canada
- 9.3 Mexico
Chapter 10. Europe Wastewater Treatment Market
- 10.1 Germany
- 10.2 France
- 10.3 Italy
- 10.4 United Kingdom
- 10.5 Spain
- 10.6 Poland
- 10.7 Russia
- 10.8 Netherlands
- 10.9 Belgium
- 10.10 Sweden
- 10.11 Denmark
- 10.12 Norway
- 10.13 Rest of Europe
Chapter 11. Asia Pacific Wastewater Treatment Market
- 11.1 China
- 11.2 India
- 11.3 Japan
- 11.4 South Korea
- 11.5 Thailand
- 11.6 Indonesia
- 11.7 Vietnam
- 11.8 Malaysia
- 11.9 Australia
- 11.10 Rest of Asia Pacific
Chapter 12. Latin America Wastewater Treatment Market
- 12.1 Brazil
- 12.2 Argentina
- 12.3 Colombia
- 12.4 Chile
- 12.5 Rest of Latin America
Chapter 13. Middle East Wastewater Treatment Market
- 13.1 Saudi Arabia
- 13.2 United Arab Emirates
- 13.3 Turkey
- 13.4 Israel
- 13.5 Iran
- 13.6 Rest of the Middle East
Chapter 14. Africa Wastewater Treatment Market
- 14.1 South Africa
- 14.2 Egypt
- 14.3 Nigeria
- 14.4 Morocco
- 14.5 Rest of Africa
Chapter 15. Wastewater Treatment Company Profiles
- 15.1 [Company 01]
- 15.1.1 Company Overview
- 15.1.2 Key Management Personnel
- 15.1.3 Products & Services Portfolio
- 15.1.4 Financial Performance
- 15.1.5 Key Market Focus & Geographic Presence
- 15.1.6 Recent Developments & Strategic Initiatives
Note: The company profile list is preliminary and may change based on research findings, market developments, data availability, and client requirements.
Chapter 16. Appendices
- Appendix A – List of Abbreviations & Acronyms
- Appendix B – Industry Classification Code Reference – Full Series
- Appendix C – Supply, Output & Operating Capacity Data Tables
- Appendix D – End-Use & Demand Base Tables
- Appendix E – Demand, Adoption & Usage Assumptions
- Appendix F – Pricing & Revenue Metric Reference Tables
- Appendix G – Company Operations & Infrastructure Database
- Appendix H – Cross-Border Trade & Activity Data Tables (Where Applicable)
- Appendix I – Regulatory Summary Tables
- Appendix J – Primary Research Participant List (Anonymized)
- Appendix K – Primary Research Questionnaire Framework
- Appendix L – Data Sources & Bibliography
- Appendix M – Market Size Divergence & Source Comparison
Chapter 17. Research Methodology
- 17.1 Research Framework & Philosophy
- 17.2 Secondary Research – Sources, Hierarchy & Data Extraction
- 17.3 Data Modeling – Bottom-Up & Top-Down Market Sizing
- 17.4 Primary Research – Stakeholder Framework, LOI & Sample Sizes
- 17.5 Forecast Methodology – Regression, Scenario & Sensitivity Analysis
- 17.6 Quality Control – Four-Layer Validation Framework
- 17.7 Limitations & Standard Assumptions
- 17.8 Disclaimer
