
Sustainable Palm Oil Market Overview:
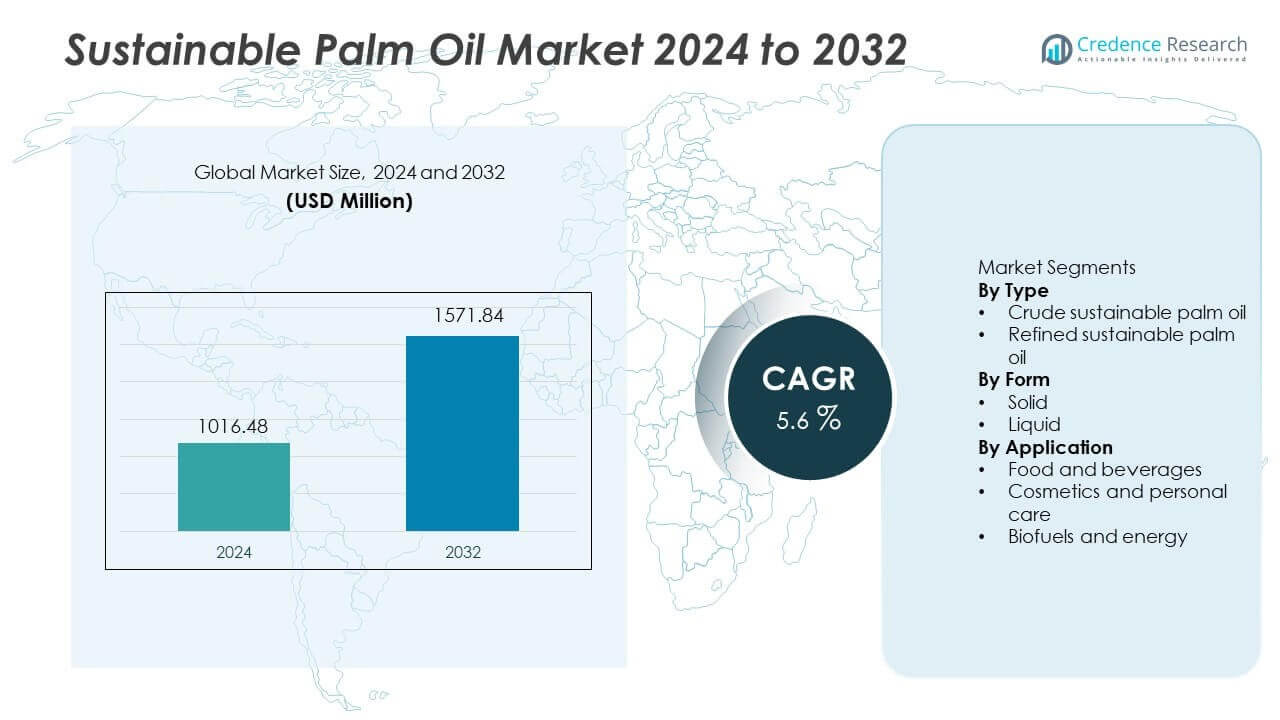
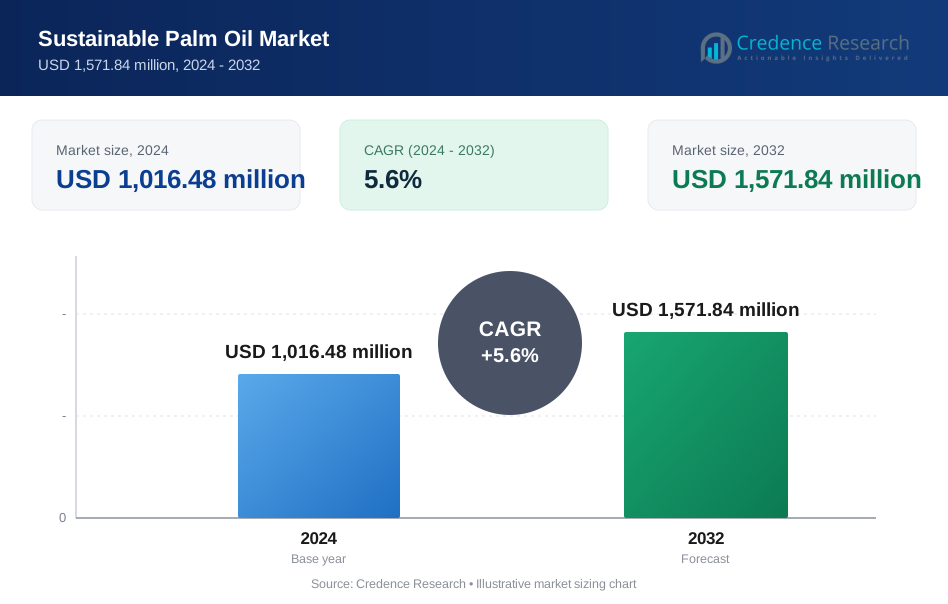
The sustainable palm oil market was valued at USD 1,016.48 million in 2024 and is expected to reach USD 1,571.84 million by 2032, growing at a CAGR of 5.6% during the forecast period. (Credence Research)
| REPORT ATTRIBUTE | DETAILS |
|---|---|
| Historical Period | 2020-2023 |
| Base Year | 2024 |
| Forecast Period | 2025-2032 |
| Sustainable Palm Oil Market Size 2024 | USD 1,016.48 million |
| Sustainable Palm Oil Market, CAGR | 5.6% |
| Sustainable Palm Oil Market Size 2032 | USD 1,571.84 million |
Sustainable Palm Oil Market Insights
- Strong sustainability commitments from food, cosmetics, and consumer goods companies act as a key market driver, with refined sustainable palm oil leading the type segment at a 64% share due to wide industrial acceptance.
- Major market trends include rising demand for liquid sustainable palm oil, which holds a 71% segment share, supported by ease of handling and compatibility with food, personal care, and energy applications.
- Competitive analysis shows a moderately consolidated market led by global plantation and agribusiness players focusing on certified sourcing, traceability systems, and long-term supply contracts.
- Regional analysis indicates Asia Pacific leads with a 38% market share, followed by Europe at 34%, North America at 18%, Latin America at 6%, and the Middle East and Africa at 4%.
Sustainable Palm Oil Market Segmentation Analysis:
By Type
By type, refined sustainable palm oil dominates the sustainable palm oil market, accounting for 64% market share. Strong demand comes from food processing, cosmetics, and industrial applications that require consistent quality, neutral odor, and stable shelf life. Refining removes impurities and improves functional performance, making the product suitable for large-scale manufacturing. Food producers prefer refined variants for bakery, confectionery, and packaged foods. Cosmetics manufacturers rely on refined oil for soaps, creams, and personal care formulations. Regulatory compliance and certification standards further support refined oil adoption. Crude sustainable palm oil holds the remaining share, mainly used in basic processing and energy-related applications.
- For instance, Wilmar International Limited reports extensive refining capacity across its global operations, which supports large downstream supply needs.
By Form
By form, liquid sustainable palm oil leads with a 71% market share, driven by its ease of handling, blending efficiency, and wide industrial usability. Liquid form integrates smoothly into food, cosmetic, and biofuel formulations, reducing processing time and energy costs. Food manufacturers favor liquid palm oil for frying, baking, and emulsification processes. The cosmetics sector uses liquid palm oil for lotions, shampoos, and cleansing products. Solid form maintains demand in margarine, shortening, and specialty fat applications where texture and structure matter. However, liquid dominance remains strong due to operational flexibility and compatibility with continuous processing systems.
- For instance, Golden Agri-Resources Ltd. processes a vast volume of palm oil products, supporting high-volume liquid applications across the food and personal care sectors.
By Application
By application, food and beverages hold the largest share at 59%, supported by rising demand for certified sustainable ingredients. Palm oil plays a key role in bakery, confectionery, snacks, and ready-to-eat foods due to its stability and cost efficiency. Sustainability commitments from global food brands accelerate certified palm oil adoption. Cosmetics and personal care follow, driven by use in soaps, detergents, and skincare products aligned with ethical sourcing goals. Biofuels and energy represent a smaller share but show steady growth, supported by renewable energy policies and sustainable fuel blending initiatives.
Key Growth Drivers
Rising Corporate Commitments to Sustainable Sourcing
Global brands increasingly commit to certified sustainable palm oil sourcing, driving strong market growth. Food, cosmetic, and consumer goods companies adopt sustainability policies to meet regulatory, investor, and consumer expectations. Certification schemes strengthen supply chain transparency and responsible production practices. Retailers and manufacturers actively shift procurement toward traceable palm oil to reduce deforestation and social risks. These commitments create stable demand for certified suppliers. Long-term sourcing contracts and supplier audits further support market expansion. This driver remains strong as sustainability reporting and environmental accountability gain importance across global value chains.
- For instance, Unilever sourced a vast volume of palm oil and palm kernel oil, achieving nearly total traceability to the mill and ensuring the vast majority of these supply flows are verified as deforestation-free.
Strengthening Regulatory Support and Certification Frameworks
Government policies and international sustainability standards actively support the sustainable palm oil market. Regulations increasingly favor certified raw materials across food, cosmetics, and energy sectors. Mandatory sustainability disclosures and import requirements encourage compliance. Certification frameworks improve credibility and market acceptance of sustainable palm oil. Producers invest in compliance systems to access premium markets. Regulatory clarity reduces uncertainty and supports long-term investments. This driver enhances market stability by aligning environmental protection goals with commercial sourcing strategies across major consuming regions.
- For instance, Sime Darby Plantation Berhad achieved certification for 248,219 hectares under the Roundtable on Sustainable Palm Oil in 2023, meeting strict criteria for social and environmental safeguards.
Growing Consumer Demand for Ethical and Eco-Friendly Products
Consumer awareness of environmental and social issues drives demand for responsibly sourced ingredients. Shoppers increasingly favor products labeled as sustainable and deforestation-free. Sustainable palm oil helps brands meet ethical positioning and improve trust. This trend remains strong in personal care, packaged foods, and household products. Rising preference for transparency strengthens demand for certified ingredients. Brand reputation benefits support premium product offerings. Consumer-driven demand reinforces long-term market growth and encourages wider adoption of sustainable palm oil across industries.
Key Trends and Opportunities
Expansion of Sustainable Palm Oil in Biofuels and Renewable Energy
Biofuels create new opportunities for sustainable palm oil adoption. Renewable energy targets increase demand for certified feedstocks. Sustainable palm oil supports lower environmental impact compared to conventional alternatives. Governments promote renewable fuel blending and cleaner energy solutions. Producers invest in traceable supply chains to serve energy markets. This trend opens diversification opportunities beyond traditional food and cosmetic uses. Energy sector demand supports volume growth and improves utilization of sustainable palm oil production capacity.
- For instance, Neste utilizes a diverse range of waste and residue raw materials for its renewable diesel and jet fuel production, supported by strict sustainability and traceability controls that ensure all feedstocks are fully traceable to their origin.
Advancements in Traceability and Digital Supply Chain Solutions
Digital tools strengthen transparency across palm oil supply chains. Blockchain and data platforms improve traceability from plantation to end use. These systems enhance compliance monitoring and risk management. Buyers gain confidence in sourcing practices through verified data. Technology adoption reduces fraud and improves sustainability reporting. This trend creates opportunities for producers offering fully traceable solutions. Enhanced transparency supports regulatory compliance and strengthens long-term buyer relationships.
- For instance, Musim Mas Group tracked 2,077,000 metric tons of palm oil products through its traceability-to-mill program in 2023, supported by satellite monitoring and digital mapping to verify supply origins.
Key Challenges
Higher Production Costs and Price Sensitivity
Sustainable palm oil production involves higher operational costs. Certification, auditing, and compliance increase expenses for producers. Smallholder farmers face financial barriers to certification adoption. Price-sensitive buyers may resist premium pricing. Cost pressures limit rapid adoption in emerging markets. Balancing affordability with sustainability remains a key challenge. Producers must improve efficiency and scale to manage cost competitiveness while maintaining certification standards.
Supply Chain Complexity and Smallholder Inclusion Issues
Complex supply chains challenge sustainable palm oil adoption. Palm oil production involves many smallholders with varying compliance levels. Ensuring traceability and consistent standards requires extensive coordination. Limited access to training and finance affects smallholder participation. Supply disruptions risk certification gaps. Addressing inclusion remains essential for long-term market growth. Companies must invest in farmer support programs and supply chain integration to ensure stable and responsible sourcing.
Regional Analysis
North America
North America holds 18% market share in the sustainable palm oil market, driven by strong corporate sustainability commitments and strict sourcing policies. Food, personal care, and consumer goods companies increasingly require certified sustainable palm oil to meet ESG goals. Regulatory pressure and retailer sustainability standards support adoption. Demand remains strong in packaged foods, cosmetics, and household products. Large multinational brands influence supply chain compliance through long-term sourcing contracts. Consumer awareness of ethical sourcing further supports market growth. The region relies heavily on imports, making traceability and certification critical for supplier selection.
Europe
Europe accounts for 34% market share, making it the leading region in the sustainable palm oil market. Strict environmental regulations and deforestation-free import policies drive high adoption. Food manufacturers, cosmetics brands, and biofuel producers actively source certified palm oil. Consumer preference for eco-friendly and transparent products strengthens demand. Sustainability labeling and corporate accountability play a central role in procurement decisions. Biofuels demand also supports volume growth under renewable energy mandates. Strong collaboration between governments, NGOs, and industry players reinforces Europe’s leadership position.
Asia Pacific
Asia Pacific holds 38% market share, supported by its role as both a major producer and consumer of sustainable palm oil. Countries such as Indonesia and Malaysia lead certified production efforts. Growing domestic demand from food processing, personal care, and energy sectors supports market expansion. Export demand from Europe and North America drives certification adoption. Governments promote sustainable practices to improve global market access. Investments in traceability systems and smallholder inclusion programs strengthen supply chain stability. The region remains central to global sustainable palm oil supply.
Latin America
Latin America represents 6% market share, driven by emerging sustainable palm oil production in countries such as Colombia and Guatemala. Favorable climatic conditions support palm cultivation with lower deforestation risk. Producers focus on certified plantations to access premium export markets. Regional demand grows steadily from food processing and bioenergy applications. Government support for sustainable agriculture strengthens adoption. While scale remains smaller than Asia Pacific, Latin America benefits from strong sustainability positioning and increasing foreign investment in certified palm oil projects.
Middle East and Africa
The Middle East and Africa account for 4% market share, supported by rising imports of certified palm oil for food and consumer goods manufacturing. Limited local production increases reliance on imports from Asia Pacific. Growing urban populations and packaged food consumption support demand. Sustainability awareness among multinational brands operating in the region drives certified sourcing. Investments in refining and distribution infrastructure improve market access. Long-term growth potential remains strong as sustainability standards gradually strengthen across regional supply chains.
Sustainable Palm Oil Market Segmentations:
By Type
- Crude sustainable palm oil
- Refined sustainable palm oil
By Form
- Solid
- Liquid
By Application
- Food and beverages
- Cosmetics and personal care
- Biofuels and energy
By Geography
- North America
- U.S.
- Canada
- Mexico
- Europe
- Germany
- France
- U.K.
- Italy
- Spain
- Rest of Europe
- Asia Pacific
- China
- Japan
- India
- South Korea
- South-east Asia
- Rest of Asia Pacific
- Latin America
- Brazil
- Argentina
- Rest of Latin America
- Middle East & Africa
- GCC Countries
- South Africa
- Rest of the Middle East and Africa
Competitive Landscape
Competitive landscape analysis highlights a moderately consolidated sustainable palm oil market led by key players including Wilmar International Limited, Golden Agri-Resources Ltd., Sime Darby Plantation Berhad, IOI Corporation Berhad, Musim Mas Group, Kuala Lumpur Kepong Berhad, Astra Agro Lestari, Bumitama Agri Ltd., United Plantations Berhad, and Indofood Agri Resources Ltd. These companies compete through certified production capacity, strong plantation management, and global supply networks. Leading players invest heavily in traceability systems, sustainability certifications, and smallholder inclusion programs to meet buyer requirements. Long-term supply agreements with food, cosmetic, and biofuel manufacturers strengthen market position. Companies also focus on yield improvement, methane capture, and deforestation-free commitments to enhance environmental performance. Smaller players compete by offering region-specific sourcing, niche certifications, and flexible supply solutions.
Key Player Analysis
- Wilmar International Limited
- Golden Agri-Resources Ltd.
- Sime Darby Plantation Berhad
- IOI Corporation Berhad
- Musim Mas Group
- Kuala Lumpur Kepong Berhad
- Astra Agro Lestari
- Bumitama Agri Ltd.
- United Plantations Berhad
- Indofood Agri Resources Ltd.
Recent Developments
- In October 2025, Astra Agro Lestari reaffirmed its commitment to sustainable palm oil productivity, focusing on technology and inclusive practices across its operations.
- In 2025, IOI Corporation Berhad published its sustainability strategy blending engineered and nature-based solutions to build resilience and transparency in its palm oil supply chain.
- In December 2024, Wilmar International Limited continued to uphold its No Deforestation, No Peat & No Exploitation focus and aligned its palm oil business with universal social and environmental standards.
Report Coverage
The research report offers an in-depth analysis based on Type, Form, Application and Geography. It details leading market players, providing an overview of their business, product offerings, investments, revenue streams, and key applications. Additionally, the report includes insights into the competitive environment, SWOT analysis, current market trends, as well as the primary drivers and constraints. Furthermore, it discusses various factors that have driven market expansion in recent years. The report also explores market dynamics, regulatory scenarios, and technological advancements that are shaping the industry. It assesses the impact of external factors and global economic changes on market growth. Lastly, it provides strategic recommendations for new entrants and established companies to navigate the complexities of the market.
Future Outlook
- Certified sustainable sourcing will become a standard requirement across global palm oil supply chains.
- Demand from food and personal care industries will continue to drive volume growth.
- Asia Pacific will strengthen its role as the primary production and export hub.
- Europe will maintain strong demand due to strict sustainability and deforestation regulations.
- Investment in traceability and digital monitoring systems will increase across producers.
- Smallholder inclusion programs will expand to ensure long-term supply stability.
- Biofuel and renewable energy applications will create additional demand opportunities.
- Producers will focus on yield improvement to balance sustainability and cost efficiency.
- Corporate sustainability reporting will influence long-term sourcing contracts.
- Regulatory alignment across regions will improve market transparency and investor confidence.
Request a Free Sample
Fill in your details and we'll send you a free sample report.
- Sample data tables & charts
- Research methodology
Need a Custom Version of This Report?
Tailor the scope, geography, or segments to your exact requirements.
- Custom geography or segment scope
- Direct access to our analyst team
Frequently Asked Questions
What is the current market size for the Sustainable Palm Oil market, and what is its projected size in 2032?
At what Compound Annual Growth Rate is the Sustainable Palm Oil market projected to grow between 2024 and 2032?
Which Sustainable Palm Oil market segment held the largest share in 2024?
What are the primary factors fueling the growth of the Sustainable Palm Oil market?
Who are the leading companies in the Sustainable Palm Oil market?
Which region commanded the largest share of the Sustainable Palm Oil market in 2024?
Table of Content
Chapter 1. Report Introduction
- 1.1 Report Description & Purpose
- 1.1.1 Report Title & Market Definition
- 1.1.2 Unique Selling Propositions (USP) & Key Differentiators
- 1.1.3 Value Proposition for Stakeholders
- 1.2 Research Objectives
- 1.2.1 Market Sizing Objectives (Volume & Revenue) (Volume Where Applicable)
- 1.2.2 Segmentation Objectives
- 1.2.3 Competitive Intelligence Objectives
- 1.2.4 Forecast & Scenario Objectives
- 1.3 Report Scope
- 1.3.1 Sustainable Palm Oil Scope – Segments & Subsegments Covered
- 1.3.2 Geographic Scope – Regions & Countries Covered
- 1.3.3 Historical Period, Base Year & Forecast Period (2024; forecast to 2032)
- 1.3.4 Inclusions & Exclusions
- 1.4 Industry Classification & Applicable Codes
- 1.5 Currency, Measurement Units & Valuation Basis
- 1.6 Target Stakeholders
- 1.7 Limitations & Assumptions
Chapter 2. Executive Summary
- 2.1 Global Sustainable Palm Oil Market Snapshot
- 2.1.1 Market Size – Historical (2024) & Forecast (2024-2032) (2024: USD 1,016.48 million → 2032: USD 1,571.84 million)
- 2.1.2 Volume & Revenue – Global Totals (Volume Where Applicable)
- 2.1.3 Key Market Highlights – Top Five Facts
- 2.2 Sustainable Palm Oil Market Segmentation Snapshot
- 2.2.1 Market Split by Region – 2024 vs. 2032
- 2.3 Competitive Snapshot
- 2.3.1 Top 10 Players by Revenue Share – 2024
- 2.3.2 Top 10 Players by Volume Share – 2024 (Volume Where Applicable)
- 2.3.3 Recent Strategic Developments (18-Month Summary)
- 2.4 Key Investment Highlights & Strategic Conclusions
Chapter 3. Sustainable Palm Oil Market Dynamics & Industry Analysis
- 3.1 Market Overview & Context
- 3.1.1 Sustainable Palm Oil Market Position in the Broader Industry Value Chain
- 3.1.2 Demand Structure & Purchasing Dynamics
- 3.1.3 Market Maturity & Development Stage by Region
- 3.2 Sustainable Palm Oil Market Drivers
- 3.3 Sustainable Palm Oil Market Restraints & Challenges
- 3.4 Sustainable Palm Oil Market Opportunities
- 3.5 Porter's Five Forces Analysis
- 3.5.1 Threat of New Entrants
- 3.5.2 Bargaining Power of Suppliers
- 3.5.3 Bargaining Power of Buyers
- 3.5.4 Threat of Substitutes
- 3.5.5 Competitive Rivalry – Intensity Assessment
- 3.6 Sustainable Palm Oil Value Chain Analysis
- 3.6.1 Upstream – Key Inputs, Resources & Suppliers
- 3.6.1.1 Key Input/Resource 1
- 3.6.1.2 Key Input/Resource 2
- 3.6.1.3 Key Input/Resource 3
- 3.6.2 Midstream – Core Operations & Value Creation
- 3.6.2.1 Operating Model & Process Overview
- 3.6.2.2 Key Operating Locations & Capabilities by Company
- 3.6.3 Downstream – Market Channels & End Users
- 3.6.3.1 Direct Sales & Customer Engagement Channels
- 3.6.3.2 Indirect Sales, Intermediaries & Partner Channels
- 3.6.4 Value Chain Profitability Analysis
- 3.6.1 Upstream – Key Inputs, Resources & Suppliers
- 3.7 PESTEL Analysis
- 3.7.1 Political Factors
- 3.7.2 Economic Factors
- 3.7.3 Social Factors
- 3.7.4 Technological Factors
- 3.7.5 Environmental Factors
- 3.7.6 Legal Factors
- 3.8 Sustainable Palm Oil Supply Chain Analysis
- 3.8.1 Critical Input & Resource Availability Risk Assessment
- 3.8.2 Supplier & Operational Concentration Risk (Geographic Exposure)
- 3.8.3 Supply & Service Disruption Impact Analysis
- 3.9 Regulatory & Policy Landscape
Note: The regulatory and policy landscape section covers regulations based on their applicability to the market, Sustainable Palm Oil category, geography, and scope of the study. Only regulatory frameworks with a material impact on operations, compliance, trade, sustainability, or market access are analyzed in detail.
Chapter 4. Key Investment Pockets & Opportunity Analysis
- 4.1 Sustainable Palm Oil Market Attractiveness Analysis
- 4.1.1 By Region – Investment Attractiveness Matrix (Market Size × CAGR)
- 4.2 Absolute Revenue Growth Opportunity
- 4.2.1 By Region – Absolute Revenue Growth Through 2032
- 4.3 Incremental Demand Opportunity
- 4.3.1 By Region – Incremental Demand Through 2032
- 4.3.2 Segment – Incremental Demand
- 4.4 Emerging Submarket Opportunity Deep Dive (Subject to Applicability)
- 4.5 Priority Market Opportunity Scorecards
- 4.5.1 United States
- 4.5.2 Europe
- 4.5.3 Asia
- 4.5.4 Middle East & Africa
Note: Priority market opportunity scorecards reflect the geographic scope and strategic relevance of the study. Listed markets are indicative and may be adapted to the industry.
Chapter 5. Sustainable Palm Oil Cross-Border Trade & Market Access Analysis
- 5.1 International Trade & Cross-Border Activity Overview
- 5.1.1 Global Export Value by Country (2024)
- 5.1.2 Global Export Volume by Country (2024) (Volume Where Applicable)
- 5.1.3 Global Import Value by Country (2024)
- 5.1.4 Global Import Volume by Country (2024) (Volume Where Applicable)
- 5.1.5 Net Trade Balance by Country (2024)
- 5.2 Export Analysis – Segment
- 5.2.1 Category 1 (Applicable Classification Code)
- 5.2.2 Category 2 (Applicable Classification Code)
- 5.2.3 Category 3 (Applicable Classification Code)
- 5.2.4 Category 4 (Applicable Classification Code)
- 5.2.5 Category 5 (Applicable Classification Code)
- 5.3 Import Analysis – Segment
- 5.3.1 Category 1 (Applicable Classification Code)
- 5.3.2 Category 2 (Applicable Classification Code)
- 5.3.3 Category 3 (Applicable Classification Code)
- 5.3.4 Category 4 (Applicable Classification Code)
- 5.3.5 Category 5 (Applicable Classification Code)
- 5.4 Cross-Border Pricing & Transaction Benchmarks
- 5.4.1 Export Pricing – Segment & Country
- 5.4.2 Import Pricing – Segment & Source Country
- 5.4.3 Price Trends (2024)
- 5.5 Key Cross-Border Trade & Delivery Routes
- 5.5.1 Cross-Border Trade/Delivery Route 1
- 5.5.2 Cross-Border Trade/Delivery Route 2
- 5.5.3 Cross-Border Trade/Delivery Route 3
- 5.5.4 Cross-Border Trade/Delivery Route 4
- 5.5.5 Cross-Border Trade/Delivery Route 5
- 5.6 Trade Policy & Market Access Impact Assessment
- 5.6.1 Tariff & Non-Tariff Barriers
- 5.6.2 Regional Trade & Economic Integration Frameworks
- 5.6.3 Bilateral & Multilateral Trade Agreements
- 5.6.4 Cross-Border Operating, Licensing & Localization Requirements
Note: This chapter applies where cross-border trade or delivery is relevant to Sustainable Palm Oil. Goods, services, and digital offerings are assessed using applicable classifications and transaction measures. Import-export volumes, trade balances, and route analyses are included only where meaningful to the market.
Chapter 6. Competitive Landscape & Company Benchmarking
- 6.1 Sustainable Palm Oil Market Concentration & Structure
- 6.1.1 Herfindahl-Hirschman Index (HHI) – vs. 2024
- 6.1.2 Leading, Mid-Sized & Emerging Player Structure
- 6.1.3 Global, Regional & Local Player Dynamics
- 6.2 Sustainable Palm Oil Market Share Analysis – 2024
- 6.2.1 Global Revenue Share by Company
- 6.2.2 Global Volume Share by Company (Volume Where Applicable)
- 6.2.3 Regional Revenue Share
- 6.2.4 Market Share Evolution ( vs. 2024)
- 6.2.5 Company Market Share by Key Segment
- 6.2.6 Company Market Share by Customer Group
- 6.3 Operating Scale, Capacity & Infrastructure Analysis
- 6.3.1 Global Operating Scale & Supply Capacity
- 6.3.2 Resource Utilization & Operating Efficiency
- 6.3.3 Output, Service Delivery & Activity Metrics
- 6.3.4 Operating Footprint & Infrastructure Map
- 6.3.5 Planned Operational & Capacity Expansion
- 6.4 Sustainable Palm Oil Competitive Benchmarking Matrix
- 6.4.1 Revenue, Growth, Profitability & Operating Metric Comparison
- 6.4.2 Channel Revenue Mix
- 6.4.3 Geographic Revenue Exposure
- 6.4.4 R&D Intensity
- 6.4.5 Sustainability Maturity
- 6.5 Strategic Developments in Sustainable Palm Oil (Last 24 Months)
- 6.5.1 Mergers, Acquisitions & Divestments
- 6.5.2 New Products, Services & Solutions in Sustainable Palm Oil
- 6.5.3 Operational & Infrastructure Expansions
- 6.5.4 Strategic Alliances, Joint Ventures & Partnerships
- 6.5.5 Distribution Expansion & Market Entry
- 6.5.6 Sustainability & ESG Initiatives
- 6.6 Competitive Strategy Mapping
- 6.6.1 Leader, Challenger, Follower & Niche Classification
- 6.6.2 Pricing Strategy Comparison
- 6.6.3 Channel Strategy Matrix
Note: Strategic developments are included based on their materiality and the availability of reliable information.
Chapter 7. Global Sustainable Palm Oil Market – By Sales & Delivery Channel
- 7.1 Segment Overview
- 7.1.1 Volume & Revenue Split by Channel (2024 & 2032) (Volume Where Applicable)
- 7.1.2 Channel Mix Evolution (2024-2032)
Chapter 8. Regional Market Analysis – Global Overview
- 8.1 Global Regional Overview
- 8.1.1 Regional Volume Share (Volume Where Applicable)
- 8.1.2 Regional Revenue Share
- 8.1.3 Regional Volume by Region (Volume Where Applicable)
- 8.1.4 Regional Revenue by Region
- 8.1.5 Regional Forecast Through 2032
- 8.2 Cross-Regional Segment Analysis
- 8.2.1 By Sales & Delivery Channel
- 8.2.2 By Competitive Positioning & Price Tier
Chapter 9. North America Sustainable Palm Oil Market
- 9.1 United States
- 9.2 Canada
- 9.3 Mexico
Chapter 10. Europe Sustainable Palm Oil Market
- 10.1 Germany
- 10.2 France
- 10.3 Italy
- 10.4 United Kingdom
- 10.5 Spain
- 10.6 Poland
- 10.7 Russia
- 10.8 Netherlands
- 10.9 Belgium
- 10.10 Sweden
- 10.11 Denmark
- 10.12 Norway
- 10.13 Rest of Europe
Chapter 11. Asia Pacific Sustainable Palm Oil Market
- 11.1 China
- 11.2 India
- 11.3 Japan
- 11.4 South Korea
- 11.5 Thailand
- 11.6 Indonesia
- 11.7 Vietnam
- 11.8 Malaysia
- 11.9 Australia
- 11.10 Rest of Asia Pacific
Chapter 12. Latin America Sustainable Palm Oil Market
- 12.1 Brazil
- 12.2 Argentina
- 12.3 Colombia
- 12.4 Chile
- 12.5 Rest of Latin America
Chapter 13. Middle East Sustainable Palm Oil Market
- 13.1 Saudi Arabia
- 13.2 United Arab Emirates
- 13.3 Turkey
- 13.4 Israel
- 13.5 Iran
- 13.6 Rest of the Middle East
Chapter 14. Africa Sustainable Palm Oil Market
- 14.1 South Africa
- 14.2 Egypt
- 14.3 Nigeria
- 14.4 Morocco
- 14.5 Rest of Africa
Chapter 15. Sustainable Palm Oil Company Profiles
- 15.1 [Company 01]
- 15.1.1 Company Overview
- 15.1.2 Key Management Personnel
- 15.1.3 Products & Services Portfolio
- 15.1.4 Financial Performance
- 15.1.5 Key Market Focus & Geographic Presence
- 15.1.6 Recent Developments & Strategic Initiatives
Note: The company profile list is preliminary and may change based on research findings, market developments, data availability, and client requirements.
Chapter 16. Appendices
- Appendix A – List of Abbreviations & Acronyms
- Appendix B – Industry Classification Code Reference – Full Series
- Appendix C – Supply, Output & Operating Capacity Data Tables
- Appendix D – End-Use & Demand Base Tables
- Appendix E – Demand, Adoption & Usage Assumptions
- Appendix F – Pricing & Revenue Metric Reference Tables
- Appendix G – Company Operations & Infrastructure Database
- Appendix H – Cross-Border Trade & Activity Data Tables (Where Applicable)
- Appendix I – Regulatory Summary Tables
- Appendix J – Primary Research Participant List (Anonymized)
- Appendix K – Primary Research Questionnaire Framework
- Appendix L – Data Sources & Bibliography
- Appendix M – Market Size Divergence & Source Comparison
Chapter 17. Research Methodology
- 17.1 Research Framework & Philosophy
- 17.2 Secondary Research – Sources, Hierarchy & Data Extraction
- 17.3 Data Modeling – Bottom-Up & Top-Down Market Sizing
- 17.4 Primary Research – Stakeholder Framework, LOI & Sample Sizes
- 17.5 Forecast Methodology – Regression, Scenario & Sensitivity Analysis
- 17.6 Quality Control – Four-Layer Validation Framework
- 17.7 Limitations & Standard Assumptions
- 17.8 Disclaimer
