Market Overview
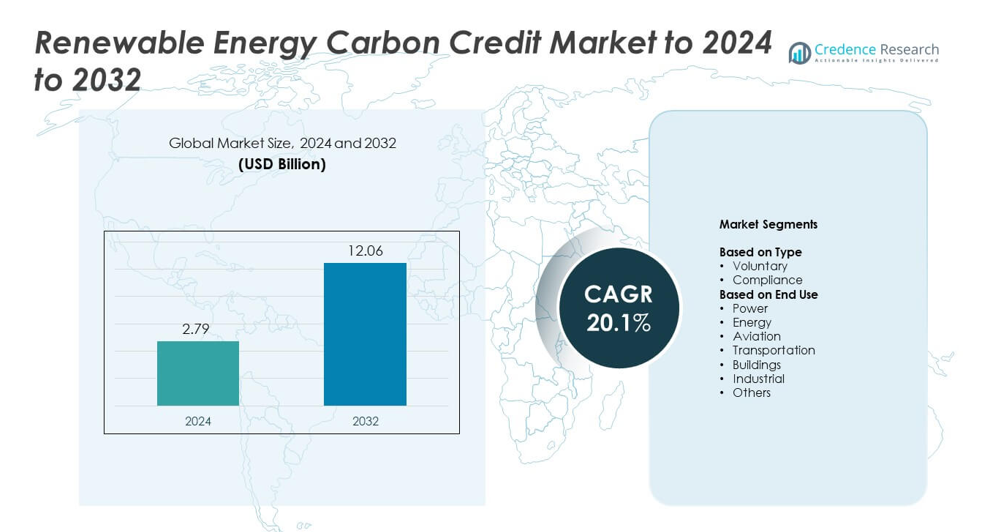
Renewable Energy Carbon Credit Market size was valued USD 2.79 billion in 2024 and is anticipated to reach USD 12.06 billion by 2032, at a CAGR of 20.1% during the forecast period.
| REPORT ATTRIBUTE | DETAILS |
|---|---|
| Historical Period | 2020-2023 |
| Base Year | 2024 |
| Forecast Period | 2025-2032 |
| Renewable Energy Carbon Credit Market Size 2024 | USD 2.79 billion |
| Renewable Energy Carbon Credit Market , CAGR | 20.1% |
| Renewable Energy Carbon Credit Market Size 2032 | USD 12.06 billion |
The renewable energy carbon credit market features key players such as South Pole, Climeworks, 3Degrees, Atmosfair, EcoAct, and Climate Impact Partners. These companies lead through advanced carbon offset solutions, renewable project financing, and blockchain-based verification platforms that enhance transparency and accountability. They focus on expanding renewable energy portfolios across wind, solar, and biomass projects while aligning with global decarbonization targets. North America dominated the market in 2024 with a 37% share, driven by strong regulatory frameworks and corporate net-zero commitments. Europe followed with a 31% share, supported by stringent emission policies and active participation in cross-border carbon trading initiatives.
Market Insights
- The renewable energy carbon credit market was valued at USD 2.79 billion in 2024 and is projected to reach USD 12.06 billion by 2032, growing at a CAGR of 20.1%.
- Strong decarbonization commitments, government emission trading schemes, and renewable project expansion are key drivers of market growth.
- Increasing adoption of blockchain and AI in verification systems is shaping market trends, enhancing transparency and transaction efficiency.
- The market is highly competitive, with global players focusing on renewable project financing, technology integration, and digital trading platforms to strengthen credit credibility.
- North America led with a 37% share in 2024, followed by Europe at 31% and Asia-Pacific at 24%, while the compliance segment dominated overall with a 63% market share.
Market Segmentation Analysis:
By Type
The compliance segment dominated the renewable energy carbon credit market with a 63% share in 2024. This dominance stems from mandatory emission reduction programs and regulatory frameworks such as the EU Emissions Trading System and California’s Cap-and-Trade. These programs drive demand for verified carbon credits among corporations seeking to meet legally binding emission targets. Voluntary credits are expanding as companies pursue net-zero goals and adopt internal carbon pricing models, but compliance markets continue to hold the largest volume due to government-enforced participation and transparent verification standards.
- For instance, VisEra Technologies bought 13,903,000 kWh with T-RECs and 50 VERs in 2023. Verification recorded 6,881.985 tonnes CO₂e avoided that year.
By End Use
The power sector held the leading position in 2024, accounting for 39% of the total market share. This leadership is driven by large-scale renewable energy adoption, including solar, wind, and hydroelectric projects replacing fossil-based generation. Utilities are increasingly purchasing carbon credits to offset emissions during transitional phases toward full renewable integration. Sectors such as aviation and industrial manufacturing are emerging users, investing in certified credits to balance hard-to-abate emissions, yet the power industry remains the primary driver of structured credit trading and certification growth.
- For instance, NextEra Energy Resources added ~5,000 MW of renewables and storage in 2023. Its backlog expanded by ~9,000 MW during 2023. These figures reflect utility-scale project growth.
Key Growth Drivers
Rising Corporate Decarbonization Commitments
Global corporations are setting science-based targets and investing in renewable energy carbon credits to meet net-zero goals. These commitments are accelerating credit demand, particularly among firms in energy, manufacturing, and technology sectors. Companies are increasingly aligning sustainability goals with renewable energy sourcing and verified offset programs. This surge in private-sector participation is strengthening market liquidity and boosting credit issuance from renewable projects, reinforcing the market’s long-term expansion.
- For instance, Apple and suppliers had 17.8 GW online in 2024. Supplier clean energy avoided 21.8 million tonnes CO₂e that year.
Government Policies and Emission Trading Regulations
National and regional governments are strengthening carbon pricing mechanisms to curb greenhouse gas emissions. Policies like the EU ETS, China’s National Carbon Market, and India’s Renewable Energy Certificate program are key enablers of market growth. Regulatory frameworks promote transparency and accountability in credit trading, ensuring standardized emission reductions. This compliance-driven demand is enhancing participation from high-emission sectors and stimulating investments in renewable generation and verification systems.
- For instance, SP Group’s blockchain REC marketplace issues 1 REC per 1 MWh. The platform supports fractional trades down to 0.001 units.
Technological Integration in Credit Verification
The integration of blockchain, AI, and IoT technologies is revolutionizing carbon credit validation and trading efficiency. These tools provide transparent, traceable, and tamper-proof verification of renewable energy generation and carbon offset activities. Automation reduces administrative costs and enhances trust among buyers and regulators. Technology-driven validation platforms are fostering investor confidence and enabling seamless credit exchange, driving scalability in the renewable energy carbon credit ecosystem.
Key Trends and Opportunities
Expansion of Voluntary Carbon Markets
Voluntary carbon markets are rapidly expanding as organizations seek flexible and reputation-driven offset options. With growing awareness of sustainability and investor scrutiny, companies are purchasing voluntary credits to supplement regulatory compliance. The entry of new intermediaries and certification platforms enhances accessibility and liquidity. This trend supports innovative credit structures tied to renewable energy projects, offering both environmental impact and brand differentiation opportunities.
- For instance, Shell retired 17.3 million carbon credits in 2024, which included retirements from the VCS, ACR, Gold Standard, and ACCUs registries.
Integration of Nature-Based and Hybrid Credits
The market is witnessing the rise of hybrid credit models combining renewable energy with nature-based solutions such as reforestation and soil carbon capture. These diversified credits attract global buyers seeking holistic sustainability outcomes. Integration of renewable and natural offsets provides broader ecological benefits while improving project funding. This convergence of clean energy and environmental restoration is creating new investment opportunities within the carbon ecosystem.
- For instance, Microsoft agreed to buy 1,600,000 carbon removal credits from a Panama reforestation project. The project covers 10,000 hectares and plans 6,000,000 trees, targeting 3,200,000 tonnes removed.
Key Challenges
Lack of Global Standardization
The absence of uniform standards across carbon credit registries and trading systems limits transparency and interoperability. Varying methodologies for calculating emission reductions create confusion and hinder cross-border transactions. This inconsistency reduces investor confidence and delays project certification timelines. Establishing global frameworks and unified verification protocols remains essential to ensure credibility and comparability in carbon credit markets.
Price Volatility and Market Speculation
Fluctuating carbon credit prices driven by policy changes, supply constraints, and speculative trading undermine market stability. Investors face uncertainty in long-term returns, discouraging renewable project developers. Market imbalances between compliance and voluntary segments can further distort pricing. Ensuring consistent regulatory oversight and transparent pricing mechanisms is critical to sustaining confidence and encouraging steady capital flow into renewable carbon credit projects.
Regional Analysis
North America
North America accounted for a 37% share of the renewable energy carbon credit market in 2024. The region’s growth is driven by strong federal and state policies promoting renewable integration and carbon neutrality. The U.S. leads with active participation in voluntary and compliance programs, while Canada advances through renewable portfolio standards. Major corporations are adopting internal carbon pricing and renewable offset programs to meet sustainability targets. Increasing investment in wind and solar projects supports continuous credit generation, reinforcing the region’s dominant position in the global market.
Europe
Europe held a 31% share in 2024, supported by the European Union’s robust Emissions Trading System and green transition goals. Strict emission regulations and renewable integration targets have accelerated demand for verified carbon credits. Countries like Germany, France, and the U.K. are investing heavily in clean energy projects and cross-border credit trading platforms. Corporate sustainability initiatives and green finance frameworks further drive participation. The region’s well-established verification standards and transparent compliance structure continue to make it a key hub for renewable carbon credit development and trading.
Asia-Pacific
Asia-Pacific captured a 24% market share in 2024, propelled by rapid industrialization and renewable expansion across China, India, and Japan. China’s national carbon trading program and large-scale solar investments are key contributors to credit generation. India’s Renewable Energy Certificate (REC) mechanism is expanding participation from power producers and industrial firms. Japan’s voluntary market is strengthening as corporations commit to emission neutrality. The region’s fast adoption of renewable infrastructure and government-backed green policies enhance its role as a major growth driver in the global carbon credit ecosystem.
Middle East and Africa
The Middle East and Africa region accounted for a 5% share in 2024, reflecting early-stage but rising participation in renewable credit markets. Gulf nations such as the UAE and Saudi Arabia are integrating carbon trading mechanisms aligned with their long-term net-zero commitments. Renewable projects in solar and green hydrogen are fostering regional credit generation. African countries, particularly South Africa and Kenya, are developing carbon offset programs through clean power initiatives. Increasing foreign investment and regional policy alignment are expected to strengthen market engagement over the forecast period.
Latin America
Latin America represented a 3% market share in 2024, driven by renewable project investments across Brazil, Chile, and Mexico. The region benefits from abundant solar and hydroelectric potential, facilitating credit generation for export to global markets. Brazil’s voluntary market expansion and participation in international carbon programs are supporting steady growth. Local policies promoting green energy financing and emission reduction certification are strengthening credit trading frameworks. As awareness of carbon neutrality increases among regional industries, Latin America is poised for gradual but consistent growth within the renewable energy credit landscape.
Market Segmentations:
By Type
- Voluntary
- Compliance
By End Use
- Power
- Energy
- Aviation
- Transportation
- Buildings
- Industrial
- Others
By Geography
- North America
- U.S.
- Canada
- Europe
- Germany
- France
- Italy
- U.K.
- Russia
- Rest of Europe
- Asia-Pacific
- India
- China
- Japan
- Rest of Asia-Pacific
- Latin America
- Brazil
- Mexico
- Rest of Latin America
- Middle East and Africa
- GCC Countries
- South Africa
- Rest of Middle East and Africa
Competitive Landscape
The renewable energy carbon credit market is highly competitive, with major participants such as South Pole, Climeworks, 3Degrees, Atmosfair, EcoAct, Climate Impact Partners, Carbon Direct, The Carbon Trust, Green Mountain Energy Company, CarbonClear, TerraPass, PwC, ALLCOT, Carbon Better, Native Energy, ClimeCo LLC, Sterling Planet Inc., Carbon Credit Capital, WayCarbon, Allotrope Partners LLC, Ecosecurities, and The Carbon Collective Company. Market competition centers on verified credit issuance, transparent trading mechanisms, and integration of digital verification technologies. Companies focus on expanding renewable project portfolios, enhancing credit traceability, and ensuring compliance with international sustainability standards. Strategic partnerships with governments, corporations, and financial institutions strengthen credit trading platforms and encourage cross-border participation. Firms are also prioritizing blockchain-enabled verification and AI-driven monitoring to maintain data integrity. The competitive environment continues to evolve as participants invest in technology innovation, global project development, and climate-aligned investment frameworks to capture long-term growth opportunities in renewable energy carbon trading.
Key Player Analysis
- South Pole
- Climeworks
- 3Degrees
- Atmosfair
- EcoAct
- Climate Impact Partners
- Carbon Direct
- The Carbon Trust
- Green Mountain Energy Company
- CarbonClear
- TerraPass
- PwC
- ALLCOT
- Carbon Better
- Native Energy
- ClimeCo LLC
- Sterling Planet Inc.
- Carbon Credit Capital, LLC.
- WayCarbon
- Allotrope Partners LLC
- Ecosecurities
- The Carbon Collective Company
Recent Developments
- In 2025, Climate Impact Partners Announced the Panna afforestation project in India, a partnership with Microsoft that secures a long-term offtake agreement for carbon removal credits.
- In 2024, Climeworks revealed its Generation 3 DAC technology, which is more efficient and uses less energy, significantly reducing capture costs.
- In 2023, Allotrope Partners LLC Partnered with Axens North America and Sumitomo Corporation of Americas to explore a commercial-scale cellulosic ethanol plant in California, a project that could produce both biofuels and renewable energy credits.
Report Coverage
The research report offers an in-depth analysis based on Type, End-Use and Geography. It details leading market players, providing an overview of their business, product offerings, investments, revenue streams, and key applications. Additionally, the report includes insights into the competitive environment, SWOT analysis, current market trends, as well as the primary drivers and constraints. Furthermore, it discusses various factors that have driven market expansion in recent years. The report also explores market dynamics, regulatory scenarios, and technological advancements that are shaping the industry. It assesses the impact of external factors and global economic changes on market growth. Lastly, it provides strategic recommendations for new entrants and established companies to navigate the complexities of the market.
Future Outlook
- Global participation in carbon credit trading will expand through stronger renewable integration.
- Governments will introduce more standardized carbon pricing and trading frameworks.
- Corporate net-zero commitments will drive continuous demand for verified renewable credits.
- Blockchain and AI-based verification platforms will enhance market transparency and trust.
- Cross-border carbon credit exchanges will become more common among developed and emerging economies.
- Hybrid credits combining renewable and nature-based projects will gain wider adoption.
- Investment in solar, wind, and hydrogen projects will generate new credit opportunities.
- Regional cooperation on climate financing will support credit market stability and growth.
- Voluntary carbon markets will attract increased participation from small and mid-sized enterprises.
- Enhanced monitoring standards will strengthen credibility and reduce risks of double counting.

Request a Free Sample
Fill in your details and we'll send you a free sample report.
- Sample data tables & charts
- Research methodology
Need a Custom Version of This Report?
Tailor the scope, geography, or segments to your exact requirements.
- Custom geography or segment scope
- Direct access to our analyst team
Frequently Asked Questions
What is the current market size for Renewable Energy Carbon Credit Market, and what is its projected size in 2032?
At what Compound Annual Growth Rate is the Renewable Energy Carbon Credit Market projected to grow between 2025 and 2032?
Which Renewable Energy Carbon Credit Market segment held the largest share in 2024?
What are the primary factors fueling the growth of the Renewable Energy Carbon Credit Market?
Who are the leading companies in the Renewable Energy Carbon Credit Market?
Table of Content
Chapter 1 Market Segmentation
- 1.1 Segmentation Framework
- 1.1.1 Product and Service Classification
- 1.1.2 Application and End-Use Classification
- 1.1.3 Technology and Solution Classification
- 1.1.4 Customer and Distribution Channel Classification
- 1.1.5 Geographic Segmentation
- 1.1.6 Market Segment Definitions and Boundaries
Chapter 2 Introduction
- 2.1 Report Objectives and Scope
- 2.2 Product Definition and Industry Terminology
- 2.3 Market Inclusions and Exclusions
- 2.4 Research Process
- 2.4.1 Primary Research and Expert Interviews
- 2.4.2 Secondary Research and Source Review
- 2.4.3 Top-Down and Bottom-Up Estimation
- 2.4.4 Data Triangulation and Verification
- 2.5 Market Size Measurement Basis
- 2.5.1 2024: USD 2.79 billion → 2032: USD 12.06 billion
- 2.6 Historical and Forecast Reference Periods
- 2.6.1 Base Year: 2024
- 2.6.2 Forecast Period: 2024-2032
- 2.7 Research Assumptions and Limitations
Chapter 3 Executive Summary
- 3.1 Market Snapshot and Key Findings
- 3.2 Base-Year Market Size, 2024
- 3.3 Forecast Market Size, 2032
- 3.4 Revenue and Volume Growth Outlook
- 3.5 Key Demand and Supply Indicators
- 3.6 Leading Market Segments
- 3.7 Fastest-Growing Market Opportunities
- 3.8 Regional Performance Highlights
- 3.9 Technology and Industry Transformation
- 3.10 Competitive Landscape Summary
- 3.11 Analyst View and Strategic Implications
Chapter 4 Global Renewable Energy Carbon Credit Market Trends and Developments
- 4.1 Historical Industry Development
- 4.2 Recent Market Trends and Developments
- 4.3 Demand and Customer Behavior Trends
- 4.4 Technology and Product Innovation
- 4.5 Artificial Intelligence, Automation and Digitalization
- 4.6 Local Manufacturing and Supply Chain Realignment
- 4.7 Industry Partnerships, Mergers and Acquisitions
- 4.8 Sustainability and Circular Economy Developments
- 4.9 Government and Private Sector Investment Trends
- 4.10 Emerging Business Models and Commercialization
- 4.11 Industry Developments and Announcements
Chapter 5 Global Renewable Energy Carbon Credit Market Production, Supply and Demand Analysis
- 5.1 Demand Trend and Consumption Analysis
- 5.2 Demand Forecast, 2024-2032
- 5.3 Production and Output Trend
- 5.4 Production and Output Forecast, 2024-2032
- 5.5 Installed Capacity and Capacity Utilization
- 5.6 Company-Wise Production Plants and Statistics
- 5.6.1 Installed Production Capacity
- 5.6.2 Actual Production
- 5.6.3 Planned Capacity and Expansion Targets
- 5.7 Supply Chain Structure and Procurement Trends
- 5.8 Supply-Demand Gap and Bottlenecks
- 5.9 Import Dependence and Sourcing Structure
- 5.10 Contract Manufacturing and Outsourcing
- 5.11 Regional Supply and Demand Concentration
Chapter 6 Global Renewable Energy Carbon Credit Market Pricing Analysis
- 6.1 Pricing Structure and Measurement
- 6.2 Historical Pricing Trends
- 6.3 Pricing Outlook, 2024-2032
- 6.4 Average Selling Price and Unit Economics
- 6.5 Pricing by Product and Market Segment
- 6.6 Geographic Pricing Differences
- 6.7 Key Input, Energy, Labor and Logistics Costs
- 6.8 Contract Pricing and Purchasing Models
- 6.9 Pricing Sensitivity and Competitive Positioning
- 6.10 Price, Margin and Profitability Implications
Chapter 7 Global Renewable Energy Carbon Credit Market Dynamics
- 7.1 Market Growth Drivers
- 7.1.1 Demand-Side Drivers
- 7.1.2 Technology and Innovation Drivers
- 7.1.3 Infrastructure and Investment Drivers
- 7.1.4 Regulatory and Policy Drivers
- 7.2 Market Restraints
- 7.2.1 Cost and Affordability Constraints
- 7.2.2 Technology and Adoption Barriers
- 7.2.3 Supply Chain and Operational Constraints
- 7.3 Market Challenges
- 7.3.1 Competitive Pressure and Margin Erosion
- 7.3.2 Skills, Infrastructure and Implementation Gaps
- 7.4 Emerging Market Opportunities
- 7.5 Market Dynamics Impact and Time-Horizon Assessment
Chapter 8 Global Renewable Energy Carbon Credit Value Chain Analysis
- 8.1 Industry Value Chain Overview
- 8.2 Upstream Suppliers and Critical Inputs
- 8.3 Technology and Component Providers
- 8.4 Manufacturing or Service Delivery
- 8.5 Distribution, Channel Partners and Integrators
- 8.6 Downstream Applications and End Users
- 8.7 Value Addition and Profit Pools
- 8.8 Vertical Integration and Outsourcing
- 8.9 Supplier Concentration and Risk
- 8.10 Supply Chain Localization and Resilience
Chapter 9 Global Renewable Energy Carbon Credit Market Regulations and Policies
- 9.1 Relevant Laws, Standards and Compliance Frameworks
- 9.2 Product, Service, Safety and Quality Requirements
- 9.3 Government Policies, Incentives and Subsidies
- 9.4 Imports, Exports and Trade Barriers
- 9.5 Public Procurement and Local Content Requirements
- 9.6 Environmental and Sustainability Compliance
- 9.7 Upcoming Policy Changes and Market Implications
Chapter 10 Global Renewable Energy Carbon Credit Market Hotspots and Opportunities
- 10.1 Market Opportunity Mapping and Growth Hotspots
- 10.2 High-Growth Applications and Customer Groups
- 10.3 Underserved Markets and White-Space Opportunities
- 10.4 Emerging Technology and Product Opportunities
- 10.5 New Capacity and Investment Hotspots
- 10.6 Market Entry and Expansion Opportunities
- 10.7 Distribution and Partnership Opportunities
- 10.8 Near-Term and Long-Term Commercial Potential
- 10.9 Opportunity Attractiveness and Execution Risks
Chapter 11 Global Renewable Energy Carbon Credit Market Outlook, 2024-2032
- 11.1 Market Size and Analysis
- 11.1.1 Revenue (Market Measurement: 2024: USD 2.79 billion → 2032: USD 12.06 billion)
- 11.1.2 Market Volume and Quantity Sold
- 11.1.3 Historical Market Size
- 11.1.4 Base-Year Market Size, 2024
- 11.2 Market Forecast, 2024-2032
- 11.2.1 Revenue Forecast to 2032
- 11.2.2 Volume Forecast to 2032
- 11.2.3 CAGR and Year-on-Year Growth
- 11.2.4 Incremental Revenue Opportunity
- 11.3 Forecast Assumptions and Scenario Analysis
- 11.3.1 Base-Case Forecast
- 11.3.2 Optimistic and Conservative Scenarios
- 11.3.3 Technology, Pricing and Policy Sensitivities
- 11.4 Market Attractiveness and Growth Outlook
Chapter 12 Global Renewable Energy Carbon Credit Market Segmentation and Outlook
- 12.1 Segmentation Summary and Market Shares, 2024
- 12.2 Largest and Fastest-Growing Segments
- 12.3 Segment Growth Comparison
- 12.4 Segment Attractiveness and Priority Matrix
Chapter 13 Global Renewable Energy Carbon Credit Geographic Market Outlook, 2024-2032
- 13.1 Regional Market Size and Share, 2024
- 13.2 Regional Market Forecast, 2024-2032
- 13.3 Regional Pricing, Production and Demand Differences
- 13.4 North America
- 13.4.1 United States
- 13.4.2 Canada
- 13.4.3 Mexico
- 13.5 Europe
- 13.5.1 Germany
- 13.5.2 France
- 13.5.3 Italy
- 13.5.4 United Kingdom
- 13.5.5 Spain
- 13.5.6 Poland
- 13.5.7 Russia
- 13.5.8 Netherlands
- 13.5.9 Belgium
- 13.5.10 Sweden
- 13.5.11 Denmark
- 13.5.12 Norway
- 13.5.13 Rest of Europe
- 13.6 Asia Pacific
- 13.6.1 China
- 13.6.2 India
- 13.6.3 Japan
- 13.6.4 South Korea
- 13.6.5 Thailand
- 13.6.6 Indonesia
- 13.6.7 Vietnam
- 13.6.8 Malaysia
- 13.6.9 Australia
- 13.6.10 Rest of Asia Pacific
- 13.7 Latin America
- 13.7.1 Brazil
- 13.7.2 Argentina
- 13.7.3 Colombia
- 13.7.4 Chile
- 13.7.5 Rest of Latin America
- 13.8 Middle East
- 13.8.1 Saudi Arabia
- 13.8.2 United Arab Emirates
- 13.8.3 Turkey
- 13.8.4 Israel
- 13.8.5 Iran
- 13.8.6 Rest of the Middle East
- 13.9 Africa
- 13.9.1 South Africa
- 13.9.2 Egypt
- 13.9.3 Nigeria
- 13.9.4 Morocco
- 13.9.5 Rest of Africa
- 13.10 Regional Investment, Policy and Supply Chain Differences
- 13.11 Regional Competitive Landscape
- 13.12 Geographic Growth Hotspots
Chapter 14 Global Renewable Energy Carbon Credit Technology, Innovation and Sustainability Outlook
- 14.1 Technology Landscape and Maturity
- 14.2 Product, Process and Service Innovation
- 14.3 AI, Automation and Digital Tools in the Industry
- 14.4 Technology Adoption and Performance Benchmarking
- 14.5 Innovation Pipeline and R&D Investment
- 14.6 Patent and Intellectual Property Trends
- 14.7 Energy Efficiency and Resource Management
- 14.8 Sustainability, Recycling and Circularity
- 14.9 Technology Roadmap, 2024-2032
- 14.10 Risks of Obsolescence and Technology Substitution
Chapter 15 Global Renewable Energy Carbon Credit Market Key Strategic Imperatives
- 15.1 Growth and Market Entry Priorities
- 15.2 High-Return Products and Segments
- 15.3 Pricing, Profitability and Cost Optimization
- 15.4 Technology Investment and Product Differentiation
- 15.5 Supply Chain Localization and Resilience
- 15.6 Distribution and Customer Acquisition
- 15.7 Partnership, Acquisition and Capacity Strategy
- 15.8 Regional Expansion Priorities
- 15.9 Short-, Medium- and Long-Term Actions
Chapter 16 Competition Outlook
- 16.1 Industry Competition Characteristics
- 16.2 Market Structure and Concentration
- 16.3 Market Share and Competitive Positioning, 2024
- 16.4 Company-Wise Revenue and Product Benchmarking
- 16.5 Production and Service Capacity Benchmarking
- 16.6 Technology, Pricing and Differentiation
- 16.7 Regional Footprint and Distribution Strength
- 16.8 Mergers, Acquisitions and Strategic Alliances
- 16.9 New Entrants and Competitive Threats
- 16.10 Porter's Five Forces and Industry Attractiveness
- 16.11 Competitive Outlook, 2024-2032
Chapter 17 Company Profiles
- 17.1 Company Coverage and Selection Criteria
- 17.2 Leading Market Participants – Standard Profile Structure
- 17.2.1 Business Description
- 17.2.2 Company Ownership and Geographic Presence
- 17.2.3 Product and Service Portfolio
- 17.2.4 Manufacturing and Operating Footprint
- 17.2.5 Production Capacity and Expansion Plans
- 17.2.6 Financial Performance and Investment
- 17.2.7 Market Share and Competitive Position
- 17.2.8 Technology and Innovation Capabilities
- 17.2.9 Strategic Alliances or Partnerships
- 17.2.10 Recent Developments
- 17.2.11 Growth Strategy and Outlook
- 17.3 Other Relevant Market Participants
Note: Every listed company is profiled on the structure shown under the first company. The company list is preliminary and may change based on research findings, market developments, data availability and client requirements.
Chapter 18 Disclaimer
- 18.1 Research and Forecast Disclaimer
- 18.2 Data Source and Estimation Limitations
Note: The depth of individual sections depends on data availability for this market. Volume, capacity, trade and other unit-based metrics are included where applicable.