
Market Overview
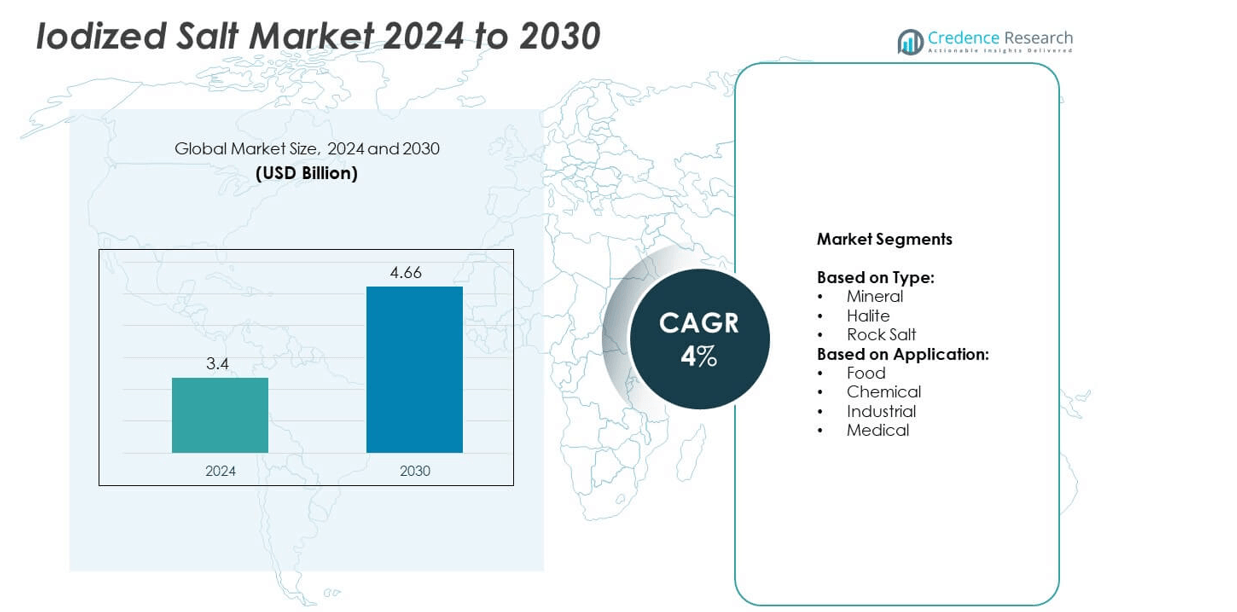
The iodized salt market size was valued at USD 3.4 billion in 2024 and is anticipated to reach USD 4.66 billion by 2032, growing at a CAGR of 4% during the forecast period.
| REPORT ATTRIBUTE | DETAILS |
|---|---|
| Historical Period | 2020-2023 |
| Base Year | 2024 |
| Forecast Period | 2025-2032 |
| Iodized Salt Market Size 2024 | USD 3.4 billion |
| Iodized Salt Market CAGR | 4% |
| Iodized Salt Market Size 2032 | USD 4.66 billion |
The iodized salt market grows steadily due to strong public health campaigns, mandatory fortification laws, and rising awareness of iodine deficiency disorders. Governments promote universal salt iodization, while food manufacturers adopt fortified salt to meet nutritional standards. Clean-label demand and product innovations such as double fortified salt support premium offerings. Technological advancements in iodization and packaging improve shelf life and iodine retention. Growing processed food consumption across urban regions further drives adoption in both household and industrial applications.
Asia-Pacific leads the iodized salt market due to large population, public nutrition programs, and strong domestic production. North America and Europe follow with high consumer awareness, advanced processing technologies, and strict food regulations. Latin America and the Middle East & Africa show steady growth with government-backed iodine supplementation initiatives. Key players operating across these regions include Tata Salt, Compass Minerals Int’l, K+S AG, and Morton Salt, each offering a wide range of food-grade and industrial iodized salt products.
Market Insights
- The iodized salt market was valued at USD 3.4 billion in 2024 and is projected to reach USD 4.66 billion by 2032, growing at a CAGR of 4%.
- Rising awareness of iodine deficiency and public health mandates drive the global demand for iodized salt.
- Clean-label preferences, double fortification innovations, and low-sodium variants shape emerging trends in iodized salt consumption.
- Key players such as Tata Salt, Compass Minerals Int’l, Morton Salt, and K+S AG focus on refining technology, packaging upgrades, and private label growth.
- Challenges include iodine loss during storage, limited awareness in rural regions, and inconsistent distribution infrastructure.
- Asia-Pacific leads due to strong government nutrition programs and high-volume consumption in India and China.
- North America and Europe follow with stable demand, while Latin America and the Middle East & Africa show growth through health campaigns and local production.
Market Drivers
Growing Public Health Campaigns for Iodine Deficiency Elimination Boost Market Demand
Governments and health organizations actively promote iodine-enriched diets to tackle iodine deficiency disorders (IDD). Awareness campaigns by WHO and UNICEF continue to highlight the health benefits of iodized salt. It remains the most cost-effective method to prevent goiter and cognitive impairments linked to iodine deficiency. The iodized salt market gains traction from mandatory fortification policies in many countries. Public sector procurement for welfare programs adds to volume growth. Strong health advocacy ensures sustained demand from low- and middle-income regions.
- For instance, the India Iodine Survey 2018-19 revealed that 76.3% of households had iodized salt coverage, and Tata Salt used these findings to highlight the continued need for awareness.
Expanding Use of Iodized Salt in Food Processing and Packaged Food Sectors
The food processing industry increasingly uses iodized salt in ready-to-eat meals, snacks, and dairy products. Manufacturers comply with health guidelines and labeling norms requiring iodine inclusion. It ensures product alignment with nutritional standards and consumer health expectations. Rising urbanization and convenience eating habits drive packaged food demand, indirectly fueling the iodized salt market. Global food brands emphasize fortified ingredients to maintain competitive advantage. Regulatory inspections further enforce iodine levels in food manufacturing.
- For instance, Cargill produces and supplies various grades of industrial salt, including iodized versions, to food manufacturers across North America. While Cargill's Fine Blending Iodized Granulated Salt meets U.S. FDA and Food Chemicals Codex standards for food use, and the FDA permits the voluntary addition of potassium iodide to salt at a maximum concentration of 0.01% (equivalent to 100 mg/kg).
Government Regulations and Salt Fortification Mandates Enforce Consistent Market Supply
Many countries implement strict laws requiring the iodization of edible salt for human and animal consumption. It ensures a steady supply of fortified salt in retail and bulk distribution networks. Regulatory mandates also apply to salt used in processed foods, sauces, and bakery items. The iodized salt market benefits from monitoring frameworks that check iodine levels and quality compliance. National salt iodization programs receive funding and technical support from global health agencies. It leads to high market penetration, even in remote regions.
Rising Demand from Industrial and Medical Applications Strengthens Growth Outlook
Beyond food use, iodized salt finds application in intravenous fluids, disinfectants, and animal feed supplements. It plays a vital role in maintaining thyroid function in livestock and human health formulations. Industrial applications include water treatment chemicals and specialized reagents. The iodized salt market benefits from consistent offtake in pharmaceutical manufacturing and laboratory solutions. Growth in medical infrastructure supports demand in both developed and developing economies. It ensures a diverse end-user base beyond table salt consumption.
Market Trends
Adoption of Double Fortified Salt Gains Traction in Nutritional Programs
Governments and food agencies support the use of double fortified salt, enriched with both iodine and iron. It addresses widespread micronutrient deficiencies in developing countries. The iodized salt market sees interest from public health departments piloting school meal and maternal care programs. It improves hemoglobin levels while maintaining iodine standards. Manufacturers invest in stable formulations that prevent nutrient degradation during storage and cooking. It promotes nutritional security in vulnerable population groups.
- For instance, National Salt Company of Nigeria (NASCON) is a major salt producer in Nigeria, and a member of the Dangote Group. The company produces and supplies fortified salt throughout Nigeria and has an installed capacity of 400,000 tonnes per annum.
Clean Label and Organic Salt Variants Drive Consumer Preferences
Consumers prefer natural, non-processed, and ethically sourced products in their daily diet. Clean-label iodized salt, free from anti-caking agents and synthetic additives, attracts health-conscious buyers. The iodized salt market reflects this shift through premium sea salt and Himalayan salt variants fortified with iodine. Retail brands introduce transparent labeling to highlight source, mineral profile, and purity. It enables better shelf visibility in supermarkets and e-commerce platforms. Organic certification further strengthens consumer trust and brand positioning.
- For instance, a 2007 field study in Nigeria found that double fortified salt using potassium iodate retained up to 79% iodine after 5 months of storage, while oxidation of ferrous iron remained below 20%, confirming nutrient stability in real-world public health deployments
Technological Advancements Improve Iodization Accuracy and Shelf Stability
Salt processors adopt improved spray and dry mixing techniques to ensure uniform iodine distribution. It reduces iodine loss during transportation, especially in humid environments. The iodized salt market benefits from innovations in encapsulated iodine compounds that retain potency over time. Automated monitoring systems help detect uneven coating during production. Investments in moisture-resistant packaging extend product shelf life. Quality assurance tools support compliance with national and international iodine standards.
Rising Demand for Private Label and Customized Packaged Offerings
Retailers expand private label iodized salt offerings to cater to budget-sensitive and loyal customers. It includes economy, mid-range, and premium product tiers based on salt origin and iodine content. The iodized salt market witnesses increased custom packaging by regional brands. Flexible pack sizes and portion-controlled sachets target institutional buyers and small households. It allows retailers to differentiate their products through design, usability, and localized branding. Shelf-ready packs enhance logistics efficiency and retail presentation.
Market Challenges Analysis
Lack of Awareness and Misinformation Restrict Adoption in Rural and Underserved Areas
In many low-income and rural regions, consumers remain unaware of the health benefits of iodized salt. Misinformation around chemical additives leads to skepticism and resistance to fortified products. The iodized salt market faces hurdles where traditional or unpackaged salt remains the norm. It limits the impact of public health programs aiming to eliminate iodine deficiency. Inconsistent labeling and lack of educational outreach weaken trust in fortified brands. Distribution gaps in remote areas further reduce availability and market access.
Iodine Loss During Storage and Distribution Affects Product Effectiveness
Iodine is a volatile element that degrades under heat, moisture, and light exposure. It reduces the nutritional value of iodized salt by the time it reaches the consumer. The iodized salt market struggles with maintaining iodine levels during long transport or poor packaging conditions. It creates compliance risks in regions with strict nutritional standards. Manufacturers must invest in better coating technology and packaging materials to prevent iodine loss. Lack of cold-chain infrastructure in some regions complicates consistent delivery.
Market Opportunities
Expansion into Emerging Economies Creates Strong Growth Prospects for Fortified Salt Producers
Rising population and government nutrition programs in Asia and Africa open new growth avenues. Health ministries enforce iodine mandates and support fortified product distribution through welfare schemes. The iodized salt market sees long-term potential where malnutrition and micronutrient gaps remain prevalent. It allows manufacturers to partner with NGOs and public agencies for bulk supply contracts. Growing retail networks in rural and semi-urban areas support branded product penetration. Infrastructure development improves access to remote markets and drives consistent consumption.
Product Diversification into Functional and Premium Salt Segments Supports Revenue Growth
Demand increases for iodized salt variants that combine taste, health, and purity. Brands introduce low-sodium options, flavored salts, and enriched blends targeting specific dietary needs. The iodized salt market benefits from value-added offerings designed for fitness-conscious and urban consumers. It creates room for differentiation across retail, foodservice, and institutional channels. Digital platforms enable direct-to-consumer sales of premium iodized products in customizable packs. Growth in gourmet and wellness product categories expands margins for specialized manufacturers.
Market Segmentation Analysis:
By Type
Mineral iodized salt dominates the segment due to its high purity, fine texture, and stable iodine retention. It is widely used in food, medical, and pharmaceutical applications that demand quality and consistency. The iodized salt market benefits from large-scale production of refined mineral salt, often supported by automated processing and quality control. Halite holds a steady position due to its natural crystal structure and cost-effectiveness for bulk applications. It meets the needs of foodservice, industrial, and chemical users seeking reliable volume supply. Rock salt remains relevant in regional and traditional markets, where coarse granules and natural form attract consumers. It is also used in pickling, curing, and de-icing applications where refinement is less critical.
- For instance, A study published in Environmental Science & Technology in 2008 analyzed the iodine content of iodized salt in the United States and reported specific findings. In freshly opened packages from the top of the can, the iodine concentration had a median of 44.1 mg iodine per kg and a mean of 47.5 ± 18.5 mg/kg.
By Application
Food applications represent the largest share, supported by the rising need for iodine-enriched diets across all age groups. It plays a crucial role in processed foods, bakery items, and packaged meals where iodine inclusion is mandatory in many regions. The iodized salt market grows steadily through consistent demand from households, food brands, and institutional buyers. Chemical applications include chlorine production, dyes, and solvents where salt acts as a base material. Industrial use spans textile processing, water treatment, and oil refining where iodine is less critical but salt quality still matters. Medical applications rely on iodized salt for oral rehydration salts, IV fluids, antiseptic solutions, and veterinary formulations. It ensures accurate iodine dosing in healthcare and animal nutrition products.
- For instance, a cross‑sectional multicenter study in China, Philippines, and Croatia (2018) showed that in areas with mandatory universal salt iodization, 96.3% of household salt samples in Linfen, 48.4% in Tuguegarao, and 96.4% in Zagreb were in the adequate iodine concentration range of 15‑40 mg/kg.
Segments:
Based on Type:
- Mineral
- Halite
- Rock Salt
Based on Application:
- Food
- Chemical
- Industrial
- Medical
Based on the Geography:
- North America
- U.S.
- Canada
- Mexico
- Europe
- UK
- France
- Germany
- Italy
- Spain
- Russia
- Belgium
- Netherlands
- Austria
- Sweden
- Poland
- Denmark
- Switzerland
- Rest of Europe
- Asia Pacific
- China
- Japan
- South Korea
- India
- Australia
- Thailand
- Indonesia
- Vietnam
- Malaysia
- Philippines
- Taiwan
- Rest of Asia Pacific
- Latin America
- Brazil
- Argentina
- Peru
- Chile
- Colombia
- Rest of Latin America
- Middle East
- UAE
- KSA
- Israel
- Turkey
- Iran
- Rest of Middle East
- Africa
- Egypt
- Nigeria
- Algeria
- Morocco
- Rest of Africa
Regional Analysis
North America
North America holds a market share of 24.1% in the global iodized salt market. Strong public health mandates and high consumer awareness drive consistent demand across both the United States and Canada. The region benefits from advanced refining technologies and well-regulated iodization standards. Food-grade iodized salt remains the most consumed category, driven by widespread use in packaged foods, snacks, and dairy. North American producers supply to both retail and foodservice industries, with strong penetration in supermarkets and health-focused outlets. The U.S. Food and Drug Administration enforces iodine levels, which supports consumer trust in fortified products. Growing interest in clean-label and organic iodized salt adds value to premium product lines. Online platforms and private labels expand reach across suburban and rural markets. Industrial and medical-grade iodized salt contributes to steady bulk demand from pharmaceuticals and laboratories.
Europe
Europe accounts for 19.3% of the global iodized salt market. Western European countries, including Germany, France, and the UK, maintain high adoption due to health policies focused on iodine deficiency prevention. Governments encourage iodine supplementation through food processing and public meal programs. Eastern Europe shows moderate uptake, driven by growing awareness and improvements in food safety regulations. Food applications remain dominant, supported by strict labeling requirements and nutritional benchmarks. European consumers increasingly favor sea salt and low-sodium iodized alternatives, which pushes product innovation. It helps manufacturers meet regional preferences while ensuring iodine delivery. The pharmaceutical sector adds niche demand for medical-grade salt, especially in Germany and Switzerland.
Asia-Pacific
Asia-Pacific dominates the global market with a 33.5% share, led by India, China, and Indonesia. Large population size and government-led nutrition programs support high-volume consumption of iodized salt. In India, the Salt Iodization Program ensures mandatory iodization across all edible salt products. China enforces national iodine standards across household and food processing segments. Public procurement and school feeding schemes drive bulk demand, particularly in rural and undernourished regions. The region experiences growing retail sales due to urbanization and rising awareness about micronutrient intake. Producers cater to diverse needs, including coarse salt for traditional cooking and fine salt for packaged goods. Industrial use also supports volume growth, particularly in textile and chemical sectors.
Latin America
Latin America holds 12.2% of the global iodized salt market. Brazil, Mexico, and Argentina lead regional consumption, supported by national salt iodization mandates. Public health initiatives aim to reduce iodine deficiency disorders, particularly in children and women. The region has a balanced mix of bulk and packaged iodized salt usage across food, agriculture, and chemical sectors. Retail formats gain popularity in urban centers, while unpackaged salt remains prevalent in rural zones. Domestic producers play a key role in supply, with limited import reliance. Cross-border trade within South America adds to supply chain resilience.
Middle East & Africa
Middle East & Africa contribute 10.9% to the global iodized salt market. The region shows varied uptake depending on national income levels and policy enforcement. Gulf countries have strong healthcare infrastructure and food processing sectors that use iodized salt extensively. Sub-Saharan Africa benefits from international aid and nutritional partnerships promoting iodine-rich diets. It supports large-scale public distribution through NGOs and welfare schemes. Retail growth in South Africa and Kenya expands market access for branded iodized products. Awareness campaigns focus on addressing goiter and thyroid health, which helps raise household-level consumption. Domestic production and government incentives ensure continuous supply and regional self-sufficiency.
Key Player Analysis
- Tata Salt
- Compass Minerals Int'l
- K+S AG
- Morton Salt
- National Salt Company, LLC
- Les Salins du Midi
- Danisco A/S
- Emsland
- ConAgra Foods Inc.
- Rheinsalz
- American Crystal Sugar
- Solvay Sa
- Cargill
- Wheatley Salt Company
- Ingredion Incorporated
Competitive Analysis
The iodized salt market features a mix of global and regional players including Tata Salt, Compass Minerals Int'l, K+S AG, Morton Salt, National Salt Company, LLC, Les Salins du Midi, Danisco A/S, Emsland, ConAgra Foods Inc., Rheinsalz, American Crystal Sugar, Solvay Sa, Cargill, Wheatley Salt Company, and Ingredion Incorporated. These companies compete based on product quality, brand recognition, processing technology, and distribution scale. Most players operate integrated manufacturing and packaging facilities to maintain iodine stability across supply chains. Several companies have strong government and institutional partnerships to support public health and nutrition programs. Market leaders invest in advanced iodization techniques and moisture-resistant packaging to meet regulatory standards and consumer expectations. Regional firms focus on affordability and bulk supply, while global players target premium segments with specialty salt offerings. Branding strategies include clean-label positioning, traceability, and product purity. Key players also expand their footprint through retail networks, private label contracts, and e-commerce platforms. Research and development supports innovation in double fortification and low-sodium blends. Companies that maintain quality certifications and regulatory compliance gain an edge in export markets. Strong logistics and cold-chain infrastructure further enhance competitive strength, especially in developing economies.
Recent Developments
- In 2025, Tata Salt launched a new campaign called ‘Namak ho Tata ka’ to reinforce its brand and trust among consumers.
- In 2025, Compass Minerals Int’l reported Second‑Quarter fiscal 2025 results, with efforts to reduce excess salt inventory and strengthen supply/demand balance.
- In 2025, Solvay published a new sustainability roadmap committing to carbon‑neutral operations by 2050.
Report Coverage
The research report offers an in-depth analysis based on Type, Application and Geography. It details leading market players, providing an overview of their business, product offerings, investments, revenue streams, and key applications. Additionally, the report includes insights into the competitive environment, SWOT analysis, current market trends, as well as the primary drivers and constraints. Furthermore, it discusses various factors that have driven market expansion in recent years. The report also explores market dynamics, regulatory scenarios, and technological advancements that are shaping the industry. It assesses the impact of external factors and global economic changes on market growth. Lastly, it provides strategic recommendations for new entrants and established companies to navigate the complexities of the market.
Future Outlook
- Demand for iodized salt will grow with rising focus on eliminating micronutrient deficiencies.
- Governments will continue enforcing mandatory salt iodization laws across developing countries.
- Food manufacturers will adopt iodized salt to meet health regulations and clean-label trends.
- Innovation in double fortified salt will support new product launches in nutrition programs.
- E-commerce platforms will expand the reach of premium and specialty iodized salt products.
- Automated iodization systems will improve production efficiency and iodine retention.
- Packaging upgrades will help prevent iodine loss during storage and distribution.
- Public health campaigns will raise awareness and boost household-level consumption.
- Industrial and pharmaceutical use of iodized salt will create consistent volume demand.
- Regional producers will scale output to meet local supply needs and export opportunities.

Request a Free Sample
Fill in your details and we'll send you a free sample report.
- Sample data tables & charts
- Research methodology
Market Dynamics
Growing Public Health Campaigns and Mandatory Fortification
Government and health organizations actively promote iodized salt to combat iodine deficiency disorders, with mandatory fortification laws ensuring widespread adoption and consistent demand, especially in developing regions.
Expansion in Food Processing and Packaged Food Sectors
The increasing use of iodized salt in processed foods, snacks, and dairy products, driven by regulatory requirements and consumer health awareness, boosts market growth as manufacturers comply with nutritional standards.
Government Regulations and Salt Fortification Mandates
Strict national laws requiring iodization of edible salt for human and animal consumption ensure a steady supply and high market penetration, supported by monitoring frameworks and public sector procurement.
Technological Advancements in Iodization and Packaging
Innovations in iodization techniques and moisture-resistant packaging improve iodine retention and shelf life, addressing challenges of iodine loss during storage and distribution, and supporting product quality.
Rising Demand for Clean-Label and Double Fortified Salt
Consumer preference for natural, additive-free products and the adoption of double fortified salt (iodine and iron) in public nutrition programs drive premium product offerings and expand market opportunities.
Need a Custom Version of This Report?
Tailor the scope, geography, or segments to your exact requirements.
- Custom geography or segment scope
- Direct access to our analyst team
Frequently Asked Questions
What is the current market size for Iodized Salt market, and what is its projected size in 2032?
At what Compound Annual Growth Rate is the Iodized Salt Market projected to grow between 2025 and 2032?
Which Iodized Salt market segment held the largest share in 2024?
What are the primary factors fueling the growth of the Iodized Salt market?
5Who are the leading companies in the Iodized Salt Market?
Table of Content
Chapter 1 Market Segmentation
- 1.1 Segmentation Framework
- 1.1.1 Product and Service Classification
- 1.1.2 Application and End-Use Classification
- 1.1.3 Technology and Solution Classification
- 1.1.4 Customer and Distribution Channel Classification
- 1.1.5 Geographic Segmentation
- 1.1.6 Market Segment Definitions and Boundaries
- 1.2 By Type
- 1.2.1 Mineral
- 1.2.2 Halite
- 1.2.3 Rock Salt
- 1.3 By Application
- 1.3.1 Food
- 1.3.2 Chemical
- 1.3.3 Industrial
- 1.3.4 Medical
Chapter 2 Introduction
- 2.1 Report Objectives and Scope
- 2.2 Product Definition and Industry Terminology
- 2.3 Market Inclusions and Exclusions
- 2.4 Research Process
- 2.4.1 Primary Research and Expert Interviews
- 2.4.2 Secondary Research and Source Review
- 2.4.3 Top-Down and Bottom-Up Estimation
- 2.4.4 Data Triangulation and Verification
- 2.5 Market Size Measurement Basis
- 2.5.1 2024: USD 3.4 billion → 2032: USD 4.66 billion
- 2.6 Historical and Forecast Reference Periods
- 2.6.1 Base Year: 2024
- 2.6.2 Forecast Period: 2024-2032
- 2.7 Research Assumptions and Limitations
Chapter 3 Executive Summary
- 3.1 Market Snapshot and Key Findings
- 3.2 Base-Year Market Size, 2024
- 3.3 Forecast Market Size, 2032
- 3.4 Revenue and Volume Growth Outlook
- 3.5 Key Demand and Supply Indicators
- 3.6 Leading Market Segments
- 3.7 Fastest-Growing Market Opportunities
- 3.8 Regional Performance Highlights
- 3.9 Technology and Industry Transformation
- 3.10 Competitive Landscape Summary
- 3.11 Analyst View and Strategic Implications
Chapter 4 Global Iodized Salt Market Trends and Developments
- 4.1 Historical Industry Development
- 4.2 Recent Market Trends and Developments
- 4.3 Demand and Customer Behavior Trends
- 4.4 Technology and Product Innovation
- 4.5 Artificial Intelligence, Automation and Digitalization
- 4.6 Local Manufacturing and Supply Chain Realignment
- 4.7 Industry Partnerships, Mergers and Acquisitions
- 4.8 Sustainability and Circular Economy Developments
- 4.9 Government and Private Sector Investment Trends
- 4.10 Emerging Business Models and Commercialization
- 4.11 Industry Developments and Announcements
Chapter 5 Global Iodized Salt Market Production, Supply and Demand Analysis
- 5.1 Demand Trend and Consumption Analysis
- 5.2 Demand Forecast, 2024-2032
- 5.3 Production and Output Trend
- 5.4 Production and Output Forecast, 2024-2032
- 5.5 Installed Capacity and Capacity Utilization
- 5.6 Company-Wise Production Plants and Statistics
- 5.6.1 Installed Production Capacity
- 5.6.2 Actual Production
- 5.6.3 Planned Capacity and Expansion Targets
- 5.7 Supply Chain Structure and Procurement Trends
- 5.8 Supply-Demand Gap and Bottlenecks
- 5.9 Import Dependence and Sourcing Structure
- 5.10 Contract Manufacturing and Outsourcing
- 5.11 Regional Supply and Demand Concentration
Chapter 6 Global Iodized Salt Market Pricing Analysis
- 6.1 Pricing Structure and Measurement
- 6.2 Historical Pricing Trends
- 6.3 Pricing Outlook, 2024-2032
- 6.4 Average Selling Price and Unit Economics
- 6.5 Pricing by Product and Market Segment
- 6.6 Geographic Pricing Differences
- 6.7 Key Input, Energy, Labor and Logistics Costs
- 6.8 Contract Pricing and Purchasing Models
- 6.9 Pricing Sensitivity and Competitive Positioning
- 6.10 Price, Margin and Profitability Implications
Chapter 7 Global Iodized Salt Market Dynamics
- 7.1 Market Growth Drivers
- 7.1.1 Demand-Side Drivers
- 7.1.2 Technology and Innovation Drivers
- 7.1.3 Infrastructure and Investment Drivers
- 7.1.4 Regulatory and Policy Drivers
- 7.2 Market Restraints
- 7.2.1 Cost and Affordability Constraints
- 7.2.2 Technology and Adoption Barriers
- 7.2.3 Supply Chain and Operational Constraints
- 7.3 Market Challenges
- 7.3.1 Competitive Pressure and Margin Erosion
- 7.3.2 Skills, Infrastructure and Implementation Gaps
- 7.4 Emerging Market Opportunities
- 7.5 Market Dynamics Impact and Time-Horizon Assessment
Chapter 8 Global Iodized Salt Value Chain Analysis
- 8.1 Industry Value Chain Overview
- 8.2 Upstream Suppliers and Critical Inputs
- 8.3 Technology and Component Providers
- 8.4 Manufacturing or Service Delivery
- 8.5 Distribution, Channel Partners and Integrators
- 8.6 Downstream Applications and End Users
- 8.7 Value Addition and Profit Pools
- 8.8 Vertical Integration and Outsourcing
- 8.9 Supplier Concentration and Risk
- 8.10 Supply Chain Localization and Resilience
Chapter 9 Global Iodized Salt Market Regulations and Policies
- 9.1 Relevant Laws, Standards and Compliance Frameworks
- 9.2 Product, Service, Safety and Quality Requirements
- 9.3 Government Policies, Incentives and Subsidies
- 9.4 Imports, Exports and Trade Barriers
- 9.5 Public Procurement and Local Content Requirements
- 9.6 Environmental and Sustainability Compliance
- 9.7 Upcoming Policy Changes and Market Implications
Chapter 10 Global Iodized Salt Market Hotspots and Opportunities
- 10.1 Market Opportunity Mapping and Growth Hotspots
- 10.2 High-Growth Applications and Customer Groups
- 10.3 Underserved Markets and White-Space Opportunities
- 10.4 Emerging Technology and Product Opportunities
- 10.5 New Capacity and Investment Hotspots
- 10.6 Market Entry and Expansion Opportunities
- 10.7 Distribution and Partnership Opportunities
- 10.8 Near-Term and Long-Term Commercial Potential
- 10.9 Opportunity Attractiveness and Execution Risks
Chapter 11 Global Iodized Salt Market Outlook, 2024-2032
- 11.1 Market Size and Analysis
- 11.1.1 Revenue (Market Measurement: 2024: USD 3.4 billion → 2032: USD 4.66 billion)
- 11.1.2 Market Volume and Quantity Sold
- 11.1.3 Historical Market Size
- 11.1.4 Base-Year Market Size, 2024
- 11.2 Market Forecast, 2024-2032
- 11.2.1 Revenue Forecast to 2032
- 11.2.2 Volume Forecast to 2032
- 11.2.3 CAGR and Year-on-Year Growth
- 11.2.4 Incremental Revenue Opportunity
- 11.3 Forecast Assumptions and Scenario Analysis
- 11.3.1 Base-Case Forecast
- 11.3.2 Optimistic and Conservative Scenarios
- 11.3.3 Technology, Pricing and Policy Sensitivities
- 11.4 Market Attractiveness and Growth Outlook
Chapter 12 Global Iodized Salt Market Segmentation and Outlook
- 12.1 Segmentation Summary and Market Shares, 2024
- 12.2 Largest and Fastest-Growing Segments
- 12.3 By Type - Market Size and Forecast, 2024-2032
- 12.3.1 Segment Definition and Scope
- 12.3.2 Historical Market Size
- 12.3.3 Revenue Forecast, 2024-2032
- 12.3.4 Volume Forecast, 2024-2032
- 12.3.5 Base-Year Market Share, 2024
- 12.3.6 Segment CAGR and Growth Drivers
- 12.3.7 Subsegment Market Size and Forecast
- 12.3.7.1 Mineral
- 12.3.7.2 Halite
- 12.3.7.3 Rock Salt
- 12.3.8 Subsegment Pricing and Adoption Trends
- 12.3.9 Leading Suppliers and Competition
- 12.3.10 Regional Demand and Opportunities
- 12.4 By Application - Market Size and Forecast, 2024-2032
- 12.4.1 Segment Definition and Scope
- 12.4.2 Historical Market Size
- 12.4.3 Revenue Forecast, 2024-2032
- 12.4.4 Volume Forecast, 2024-2032
- 12.4.5 Base-Year Market Share, 2024
- 12.4.6 Segment CAGR and Growth Drivers
- 12.4.7 Subsegment Market Size and Forecast
- 12.4.7.1 Food
- 12.4.7.2 Chemical
- 12.4.7.3 Industrial
- 12.4.7.4 Medical
- 12.4.8 Subsegment Pricing and Adoption Trends
- 12.4.9 Leading Suppliers and Competition
- 12.4.10 Regional Demand and Opportunities
- 12.5 Segment Growth Comparison
- 12.6 Segment Attractiveness and Priority Matrix
Chapter 13 Global Iodized Salt End-Use and Application Market Outlook
- 13.1 End-Use Industry and Customer Demand Structure
- 13.2 Leading Applications and Customer Groups
- 13.3 End-Use Market Size, Share and Forecast
- 13.4 Major End-Use Industry Deep Dives
- 13.4.1 Customer Requirements and Use Cases
- 13.4.2 Demand and Replacement Cycles
- 13.4.3 Technical and Regulatory Considerations
- 13.4.4 Purchasing and Procurement Models
- 13.4.5 Leading Vendors and Distribution Channels
- 13.4.6 Forecast and Commercial Opportunities
- 13.5 Emerging Applications and Cross-Segment Demand
- 13.6 End-Use Industry Investment Priorities
Chapter 14 Global Iodized Salt Geographic Market Outlook, 2024-2032
- 14.1 Regional Market Size and Share, 2024
- 14.2 Regional Market Forecast, 2024-2032
- 14.3 Regional Pricing, Production and Demand Differences
- 14.4 North America
- 14.4.1 United States
- 14.4.2 Canada
- 14.4.3 Mexico
- 14.5 Europe
- 14.5.1 Germany
- 14.5.2 France
- 14.5.3 Italy
- 14.5.4 United Kingdom
- 14.5.5 Spain
- 14.5.6 Poland
- 14.5.7 Russia
- 14.5.8 Netherlands
- 14.5.9 Belgium
- 14.5.10 Sweden
- 14.5.11 Denmark
- 14.5.12 Norway
- 14.5.13 Rest of Europe
- 14.6 Asia Pacific
- 14.6.1 China
- 14.6.2 India
- 14.6.3 Japan
- 14.6.4 South Korea
- 14.6.5 Thailand
- 14.6.6 Indonesia
- 14.6.7 Vietnam
- 14.6.8 Malaysia
- 14.6.9 Australia
- 14.6.10 Rest of Asia Pacific
- 14.7 Latin America
- 14.7.1 Brazil
- 14.7.2 Argentina
- 14.7.3 Colombia
- 14.7.4 Chile
- 14.7.5 Rest of Latin America
- 14.8 Middle East
- 14.8.1 Saudi Arabia
- 14.8.2 United Arab Emirates
- 14.8.3 Turkey
- 14.8.4 Israel
- 14.8.5 Iran
- 14.8.6 Rest of the Middle East
- 14.9 Africa
- 14.9.1 South Africa
- 14.9.2 Egypt
- 14.9.3 Nigeria
- 14.9.4 Morocco
- 14.9.5 Rest of Africa
- 14.10 Regional Investment, Policy and Supply Chain Differences
- 14.11 Regional Competitive Landscape
- 14.12 Geographic Growth Hotspots
Chapter 15 Global Iodized Salt Technology, Innovation and Sustainability Outlook
- 15.1 Technology Landscape and Maturity
- 15.2 Product, Process and Service Innovation
- 15.3 AI, Automation and Digital Tools in the Industry
- 15.4 Technology Adoption and Performance Benchmarking
- 15.5 Innovation Pipeline and R&D Investment
- 15.6 Patent and Intellectual Property Trends
- 15.7 Energy Efficiency and Resource Management
- 15.8 Sustainability, Recycling and Circularity
- 15.9 Technology Roadmap, 2024-2032
- 15.10 Risks of Obsolescence and Technology Substitution
Chapter 16 Global Iodized Salt Market Key Strategic Imperatives
- 16.1 Growth and Market Entry Priorities
- 16.2 High-Return Products and Segments
- 16.3 Pricing, Profitability and Cost Optimization
- 16.4 Technology Investment and Product Differentiation
- 16.5 Supply Chain Localization and Resilience
- 16.6 Distribution and Customer Acquisition
- 16.7 Partnership, Acquisition and Capacity Strategy
- 16.8 Regional Expansion Priorities
- 16.9 Short-, Medium- and Long-Term Actions
Chapter 17 Competition Outlook
- 17.1 Industry Competition Characteristics
- 17.2 Market Structure and Concentration
- 17.3 Market Share and Competitive Positioning, 2024
- 17.4 Company-Wise Revenue and Product Benchmarking
- 17.5 Production and Service Capacity Benchmarking
- 17.6 Technology, Pricing and Differentiation
- 17.7 Regional Footprint and Distribution Strength
- 17.8 Mergers, Acquisitions and Strategic Alliances
- 17.9 New Entrants and Competitive Threats
- 17.10 Porter's Five Forces and Industry Attractiveness
- 17.11 Competitive Outlook, 2024-2032
Chapter 18 Company Profiles
- 18.1 Company Coverage and Selection Criteria
- 18.2 Tata Salt
- 18.2.1 Business Description
- 18.2.2 Company Ownership and Geographic Presence
- 18.2.3 Product and Service Portfolio
- 18.2.4 Manufacturing and Operating Footprint
- 18.2.5 Production Capacity and Expansion Plans
- 18.2.6 Financial Performance and Investment
- 18.2.7 Market Share and Competitive Position
- 18.2.8 Technology and Innovation Capabilities
- 18.2.9 Strategic Alliances or Partnerships
- 18.2.10 Recent Developments
- 18.2.11 Growth Strategy and Outlook
- 18.3 Compass Minerals Int'l
- 18.4 K+S AG
- 18.5 Morton Salt
- 18.6 Cargill
- 18.7 Solvay SA
- 18.8 National Salt Company, LLC
- 18.9 Les Salins du Midi
- 18.10 ConAgra Foods Inc.
- 18.11 Ingredion Incorporated
- 18.12 Other Relevant Market Participants
Note: Every listed company is profiled on the structure shown under the first company. The company list is preliminary and may change based on research findings, market developments, data availability and client requirements.
Chapter 19 Disclaimer
- 19.1 Research and Forecast Disclaimer
- 19.2 Data Source and Estimation Limitations
Note: The depth of individual sections depends on data availability for this market. Volume, capacity, trade and other unit-based metrics are included where applicable.

