Home » Food & Beverage » Rock Salt Market

Rock Salt Market by Type (Chemical, Pharmaceutical, Cosmetics, Food and beverages , Others) by Distribution Channel (Hypermarket/ Supermarket, Convenience Store, Specialty Food Store, Wholesale Store, Online Store, Others)- Growth, Share, Opportunities & Competitive Analysis, 2016 – 2028

Price: $4999

Published: | Report ID: 10100 | Report Format : PDF

Rock Salt Market Analysis

Rock salt is the common name for Halite or Sodium Chloride mineral. With a chemical formula of NaCl, we find that rock salt has a burgeoning market due to the rapid increase in the global population. Rock salt forms due to water evaporation from large water bodies. With climate change on the rise, and global temperatures rising, the evaporation in these bodies increases. Thus, we will find that rock salt is more common due to the ever-increasing global population and climate change.

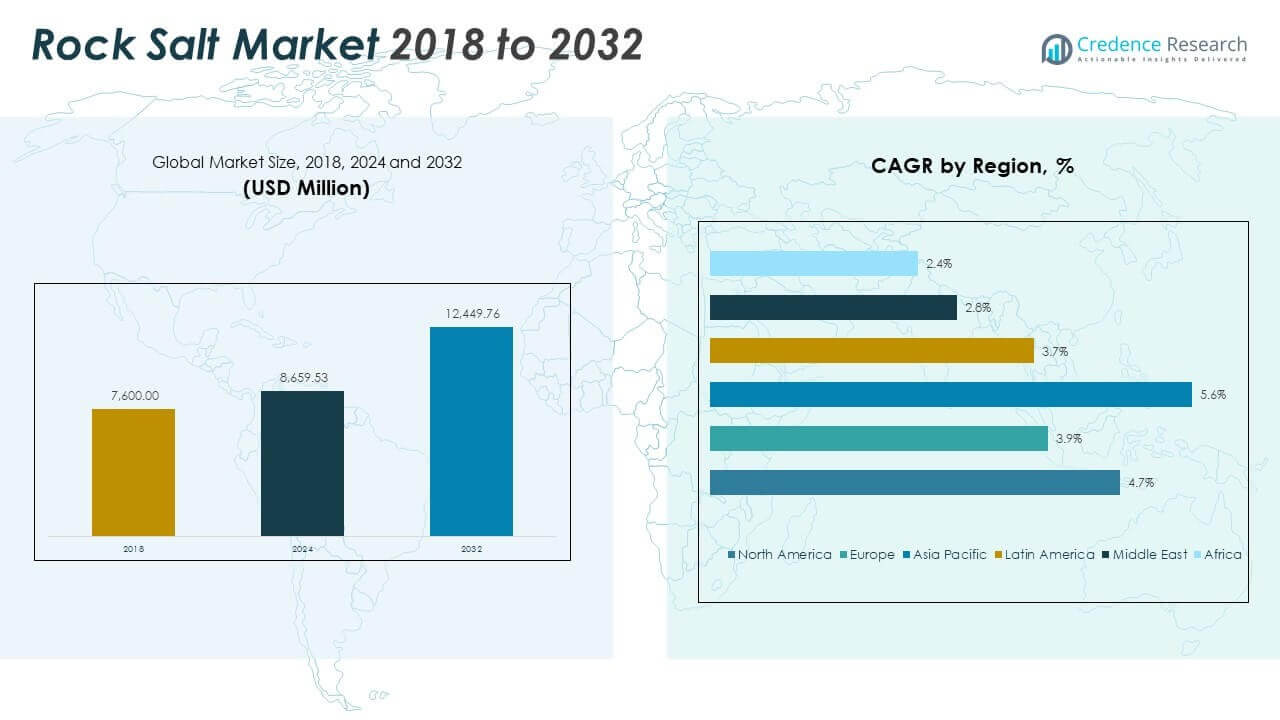
The Global Rock Salt market is expected to witness a CAGR of 3.58% during the forecast period. The revenue generated by the global Rock Salt market in 2021 was over USD 4,337.25 million and is expected to generate revenue worth USD 5,625.21 million in 2028. Therefore, the incremental growth opportunity offered by the global Rock Salt is estimated to be USD 40 billion between 2022 and 2028.

Food & Beverage

Interesting Facts about Rock Salt Industry

  • Rock Salt is formed by evaporation of seawater and precipitation of halite
  • China leads rock salt consumption
  • Rock Salt is a substitute for common salt
  • The large volume of Rock Salt production comes from the Himalayas region (India, China, and Nepal)
  • Rock salt is used to soften tissues in leather

The global rock salt market is predicted to grow at a stagnant rate from 2022 to 2028. There is an increase in the chemical industry, and the climatic conditions have also led to the increasing persistence of extreme conditions. These extreme conditions lead to excessive snow; the municipalities need salt to assuage the snow and ice. Rock salt can also be a healthy substitute for common salt. Many people are shifting to more nutritious alternatives in their everyday lifestyles. Thus, rock salt can help with that.

Geographically, given that much of the rock salt in the world comes from the Himalayas, the Asian-Pacific region can dominate the rock salt market. India, China, and Japan will likely hold the most market here. There are many applications for rock salt. Most of these applications are that of the chemical or pharmaceutical industries.

Design Element 2

Access crucial information at unmatched prices!

Request your free sample report today & start making informed decisions powered by Credence Research!

Download Free Sample
CTA Design Element 3

Strong Demand from Chemical Industry

Chemical, Pharmaceutical, Cosmetics, and Food and beverages are major application markets for the rock salt industry. The main driver of the industry is the chemical industry. Rock salt is used in the chemical industry to obtain chlorine. Chlorine, in turn, is used for several applications, such as in the pulp and paper industry. Both of these industries use a large amount of chlorine for the bleaching process of paper. There is also a need for chorine in the tanning and textile industry. It heals and softens tissues in the leather.

Growing Consumption in Food & Beverage Industry

Another driver for rock salt is the food industry. Rock salt is used in the food industry for using rock salt as a flavoring in snacks, meats, and preserved items. Rock salt can also be used in the food industry as a preservative. Many people also use it as a medicine or even a relic as they believe that rock salt has healing powers as it is a pure earthly component. People use it as a medicine to resolve issues in the gut. It is also used in the skincare industry as it has exfoliants that allow for cleansing and detoxification, which means that it can remove the dead skin and refresh the skin from the inside out.

Shape Your Report to Specific Countries or Regions & Enjoy 30% Off!

Highly Corrosive and Potential Pollutant of Ground Water

Rock salt serves many purposes and is a highly cost-efficient product for clearing up snow on the road. It also helps keep the traffic and the economy flowing. However, there are other challenges it poses. It can cause corrosive damage to all the motor vehicles and concrete surfaces around them. They can also damage wildlife and causes shelter and food loss. It can also affect water quality as it may leach into water sources. If there’s any contamination in water, it can cause hypertension in humans.

Hypermarkets/Supermarkets, Convenience stores, Specialty Food stores, Wholesale Stores, Online stores, and Others are effective sales channels for the rock salt industry. Abraxus salt, American Rock Salt, ass Minerals, Cargill, Detroit Salt Com, Esco, Eurosalt AB, Gama, Gunther Salt, Jiangsu Jingshen, Maxisalt, Meodity, Multi rock salt, Salt Natural, Sian Enterprises, Tabarak Fertilizers and The International Company for Salt are significant players operating in the global rock salt industry.

1.Preface
1.1.Report Description
1.1.1.Purpose of the Report
1.1.2.Target Audience
1.1.3.USP and Key Offerings
1.2.Research Scope
1.3.Research Methodology
1.3.1.Phase I – Secondary Research
1.3.2.Phase II – Primary Research
1.3.3.Phase III – Expert Panel Review
1.3.4.Approach Adopted
1.3.4.1.Top-Down Approach
1.3.4.2.Bottom-Up Approach
1.3.5.Assumptions
1.4.Market Segmentation

2.Executive Summary
2.1.Market Snapshot: Global Rock Salt Market

3.Market Dynamics & Factors Analysis
3.1.Introduction
3.1.1. Global Rock Salt Market Value, 2016-2028, (US$ Bn)
3.2.Market Dynamics
3.2.1.Key Growth Trends
3.2.2.Major Industry Challenges
3.2.3.Key Growth Pockets
3.3.Attractive Investment Proposition,2021
3.3.1.Application
3.3.2.Sales Channel
3.3.3.Geography
3.4.Porter’s Five Forces Analysis
3.4.1.Threat of New Entrants
3.4.2.Bargaining Power of Buyers/Consumers
3.4.3.Bargaining Power of Suppliers
3.4.4.Threat of Substitute Applications
3.4.5.Intensity of Competitive Rivalry
3.5.Value Chain Analysis

4.Market Positioning of Key Players, 2021
4.1.Company market share of key players, 2021
4.2.Top 6 Players
4.3.Top 3 Players
4.4.Major Strategies Adopted by Key Players

5.COVID 19 Impact Analysis
5.1.Global Rock Salt Market Pre Vs Post COVID 19, 2019 – 2028
5.2.Impact on Import & Export
5.3.Impact on Demand & Supply

6.North America
6.1.North America Rock Salt Market, by Country, 2016-2028(US$ Bn)
6.1.1.U.S.
6.1.2.Canada
6.1.3.Mexico
6.2.North America Rock Salt Market, by Application, 2016-2028(US$ Bn)
6.2.1.Overview
6.2.2.Chemical
6.2.3.Pharmaceutical
6.2.4.Cosmetics
6.2.5.Food and beverages
6.3.North America Rock Salt Market, by Sales Channel, 2016-2028(US$ Bn)
6.3.1.Overview
6.3.2.Hypermarket/ Supermarket
6.3.3.Convenience Store
6.3.4.Specialty Food Store
6.3.5.Wholesale Store
6.3.6.Online Store
6.3.7.Others

7.Europe
7.1.Europe Rock Salt Market, by Country, 2016-2028(US$ Bn)
7.1.1.UK
7.1.2.France
7.1.3.Germany
7.1.4.Italy
7.1.5.Russia
7.1.6.Spain
7.1.7.Belgium
7.1.8.Netherland
7.1.9.Austria
7.1.10.Sweden
7.1.11.Poland
7.1.12.Denmark
7.1.13.Switzerland
7.1.14.Rest of Europe
7.2.Europe Rock Salt Market, by Application, 2016-2028(US$ Bn)
7.2.1.Overview
7.2.2.Chemical
7.2.3.Pharmaceutical
7.2.4.Cosmetics
7.2.5.Food and beverages
7.3.Europe Rock Salt Market, by Sales Channel, 2016-2028(US$ Bn)
7.3.1.Overview
7.3.2.Hypermarket/ Supermarket
7.3.3.Convenience Store
7.3.4.Specialty Food Store
7.3.5.Wholesale Store
7.3.6.Online Store
7.3.7.Others

8.Asia Pacific
8.1.Asia Pacific Rock Salt Market, by Country, 2016-2028(US$ Bn)
8.1.1.China
8.1.2.Japan
8.1.3.South Korea
8.1.4.India
8.1.5.Australia
8.1.6.New Zealand
8.1.7.Taiwan
8.1.8.Southeast Asia
8.1.9.Central Asia
8.1.10.Rest of Asia Pacific
8.2.Asia Pacific Rock Salt Market, by Application, 2016-2028(US$ Bn)
8.2.1.Overview
8.2.2.Chemical
8.2.3.Pharmaceutical
8.2.4.Cosmetics
8.2.5.Food and beverages
8.3.Asia Pacific Rock Salt Market, by Sales Channel, 2016-2028(US$ Bn)
8.3.1.Overview
8.3.2.Hypermarket/ Supermarket
8.3.3.Convenience Store
8.3.4.Specialty Food Store
8.3.5.Wholesale Store
8.3.6.Online Store
8.3.7.Others

9.Latin America
9.1.Latin America Rock Salt Market, by Country, 2016-2028(US$ Bn)
9.1.1.Brazil
9.1.2.Argentina
9.1.3.Peru
9.1.4.Chile
9.1.5.Colombia
9.1.6.Rest of Latin America
9.2.Latin America Rock Salt Market, by Application, 2016-2028(US$ Bn)
9.2.1.Overview
9.2.2.Chemical
9.2.3.Pharmaceutical
9.2.4.Cosmetics
9.2.5.Food and beverages
9.3.Latin America Rock Salt Market, by Sales Channel, 2016-2028(US$ Bn)
9.3.1.Overview
9.3.2.Hypermarket/ Supermarket
9.3.3.Convenience Store
9.3.4.Specialty Food Store
9.3.5.Wholesale Store
9.3.6.Online Store
9.3.7.Others

10.Middle East
10.1.Middle East Rock Salt Market, by Country, 2016-2028(US$ Bn)
10.1.1.UAE
10.1.2.KSA
10.1.3.Israel
10.1.4.Turkey
10.1.5.Iran
10.1.6.Rest of Middle East
10.2.Middle East Rock Salt Market, by Application, 2016-2028(US$ Bn)
10.2.1.Overview
10.2.2.Chemical
10.2.3.Pharmaceutical
10.2.4.Cosmetics
10.2.5.Food and beverages
10.3.Middle East Rock Salt Market, by Sales Channel, 2016-2028(US$ Bn)
10.3.1.Overview
10.3.2.Hypermarket/ Supermarket
10.3.3.Convenience Store
10.3.4.Specialty Food Store
10.3.5.Wholesale Store
10.3.6.Online Store
10.3.7.Others

11.Africa
11.1.Africa Rock Salt Market, by Country, 2016-2028(US$ Bn)
11.1.1.South Africa
11.1.2.Egypt
11.1.3.Nigeria
11.1.4.Rest of Africa
11.2.Africa Rock Salt Market, by Application, 2016-2028(US$ Bn)
11.2.1.Overview
11.2.2.Chemical
11.2.3.Pharmaceutical
11.2.4.Cosmetics
11.2.5.Food and beverages
11.3.Africa Rock Salt Market, by Sales Channel, 2016-2028(US$ Bn)
11.3.1.Overview
11.3.2.Hypermarket/ Supermarket
11.3.3.Convenience Store
11.3.4.Specialty Food Store
11.3.5.Wholesale Store
11.3.6.Online Store
11.3.7.Others

12.Global
12.1.Global Rock Salt Market, by Application, 2016-2028(US$ Bn)
12.1.1.Overview
12.1.2.Chemical
12.1.3.Pharmaceutical
12.1.4.Cosmetics
12.1.5.Food and beverages
12.2.Global Rock Salt Market, by Sales Channel, 2016-2028(US$ Bn)
12.2.1.Overview
12.2.2.Hypermarket/ Supermarket
12.2.3.Convenience Store
12.2.4.Specialty Food Store
12.2.5.Wholesale Store
12.2.6.Online Store
12.2.7.Others

13.Company Profiles
13.1.Abraxus salt
13.2.American Rock Salt
13.3.any
13.4.ass Minerals
13.5.Cargill
13.6.Com
13.7.Detroit Salt Com
13.8.Esco
13.9.Eurosalt AB
13.10.Gama
13.11.Gunther Salt
13.12.Jiangsu Jingshen
13.13.Maxisalt
13.14.Meodity
13.15.Multi rock salt
13.16.Salt Natural
13.17.Sian Enterprises
13.18.Tabarak Fertilizers
13.19.The International Company for Salt
13.20.Others

List of Figures

FIG. 1Global Rock Salt Market: Research Methodology
FIG. 2Market Size Estimation – Top Down & Bottom up Approach
FIG. 3Global Rock Salt Market Segmentation
FIG. 4Global Rock Salt Market, by Application, 2019 (US$ Bn)
FIG. 5Global Rock Salt Market, by Sales Channel, 2021 (US$ Bn)
FIG. 6Global Rock Salt Market, by Geography, 2021 (US$ Bn)
FIG. 7Attractive Investment Proposition, by Geography, 2021
FIG. 8Global Market Positioning of Key Rock Salt Market Manufacturers, 2019
FIG. 9Global Rock Salt Market Value Contribution, By Application, 2021 & 2028 (Value %)
FIG. 10Global Rock Salt Market, by Chemical, Value, 2016-2028 (US$ Bn)
FIG. 11Rock Salt Market, by Pharmaceutical, Value, 2016-2028 (US$ Bn)
FIG. 12Global Rock Salt Market, by Cosmetics, Value, 2016-2028 (US$ Bn)
FIG. 13Global Rock Salt Market, by Food and beverages, Value, 2016-2028 (US$ Bn)
FIG. 14Global Rock Salt Market Value Contribution, By Sales Channel, 2021 & 2028 (Value %)
FIG. 15Global Rock Salt Market, by Hypermarket/ Supermarket, Value, 2016-2028 (US$ Bn)
FIG. 16Global Rock Salt Market, by Convenience Store, Value, 2016-2028 (US$ Bn)
FIG. 17Global Rock Salt Market, by Online Store, Value, 2016-2028 (US$ Bn)
FIG. 18Global Rock Salt Market, by Specialty Food Store, Value, 2016-2028 (US$ Bn)
FIG. 19Global Rock Salt Market, by Wholesale Store, Value, 2016-2028 (US$ Bn)
FIG. 20U.S. Rock Salt Market, 2016-2028 (US$ Bn)
FIG. 21Rest of North America Rock Salt Market, 2016-2028 (US$ Bn)
FIG. 22U.K. Rock Salt Market, 2016-2028 (US$ Bn)
FIG. 23Germany Rock Salt Market, 2016-2028 (US$ Bn)
FIG. 24France Rock Salt Market, 2016-2028 (US$ Bn)
FIG. 25Italy Rock Salt Market, 2016-2028 (US$ Bn)
FIG. 26Spain Rock Salt Market, 2016-2028 (US$ Bn)
FIG. 27Russia Rock Salt Market, 2016-2028 (US$ Bn)
FIG. 28BENELUX Rock Salt Market, 2016-2028 (US$ Bn)
FIG. 29Poland Rock Salt Market, 2016-2028 (US$ Bn)
FIG. 30Austria Rock Salt Market, 2016-2028 (US$ Bn)
FIG. 31Rest of Europe Rock Salt Market, 2016-2028 (US$ Bn)
FIG. 32Japan Rock Salt Market, 2016-2028 (US$ Bn)
FIG. 33China Rock Salt Market, 2016-2028 (US$ Bn)
FIG. 34India Rock Salt Market, 2016-2028 (US$ Bn)
FIG. 35South Korea Rock Salt Market, 2016-2028 (US$ Bn)
FIG. 36Australia Rock Salt Market, 2016-2028 (US$ Bn)
FIG. 37Southeast Asia Rock Salt Market, 2016-2028 (US$ Bn)
FIG. 38Rest of Asia Pacific Rock Salt Market, 2016-2028 (US$ Bn)
FIG. 39Middle East & Africa Rock Salt Market, 2016-2028 (US$ Bn)
FIG. 40South Africa Rock Salt Market, 2016-2028 (US$ Bn)
FIG. 41Nigeria Rock Salt Market, 2016-2028 (US$ Bn)
FIG. 42Egypt Rock Salt Market, 2016-2028 (US$ Bn)
FIG. 43GCC Rock Salt Market, 2016-2028 (US$ Bn)
FIG. 44Israel Rock Salt Market, 2016-2028 (US$ Bn)
FIG. 45Latin America Rock Salt Market, 2016-2028 (US$ Bn)
FIG. 46Mechanicalzil Rock Salt Market, 2016-2028 (US$ Bn)
FIG. 47Argentina Rock Salt Market, 2016-2028 (US$ Bn)
FIG. 48Colombia Rock Salt Market, 2016-2028 (US$ Bn)
FIG. 49Peru Rock Salt Market, 2016-2028 (US$ Bn)
FIG. 50Chile Rock Salt Market, 2016-2028 (US$ Bn)

List of Tables

TABLE 1Market Snapshot: Global Beauty Devices (Rock Salt) Market
TABLE 2Global Rock Salt Market, by Application, 2016-2028 (US$ Bn)
TABLE 3Global Rock Salt Market, by Sales Channel, 2016-2028 (US$ Bn)
TABLE 4Global Rock Salt Market, by Geography, 2016-2028 (US$ Bn)
TABLE 5North America Rock Salt Market, by Application, 2016-2028 (US$ Bn)
TABLE 6North America Rock Salt Market, by Sales Channel, 2016-2028 (US$ Bn)
TABLE 7North America Rock Salt Market, by Country, 2016-2028 (US$ Bn)
TABLE 8Europe Rock Salt Market, by Application, 2016-2028 (US$ Bn)
TABLE 9Europe Rock Salt Market, by Sales Channel, 2016-2028 (US$ Bn)
TABLE 10Europe Rock Salt Market, by Country/Region, 2016-2028 (US$ Bn)
TABLE 11Asia Pacific Rock Salt Market, by Application, 2016-2028 (US$ Bn)
TABLE 12Asia Pacific Rock Salt Market, by Sales Channel, 2016-2028 (US$ Bn)
TABLE 13Asia Pacific Rock Salt Market, by Country/Region, 2016-2028 (US$ Bn)
TABLE 14Latin America Rock Salt Market, by Application, 2016-2028 (US$ Bn)
TABLE 15Latin America Rock Salt Market, by Sales Channel, 2016-2028 (US$ Bn)
TABLE 16Latin America Rock Salt Market, by Country/Region, 2016-2028 (US$ Bn)
TABLE 17Middle East Rock Salt Market, by Application, 2016-2028 (US$ Bn)
TABLE 18Middle East Rock Salt Market, by Sales Channel, 2016-2028 (US$ Bn)
TABLE 19Middle East Rock Salt Market, by Country/Region, 2016-2028 (US$ Bn)
TABLE 20Africa Rock Salt Market, by Application, 2016-2028 (US$ Bn)
TABLE 21Africa Rock Salt Market, by Sales Channel, 2016-2028 (US$ Bn)
TABLE 22Africa Rock Salt Market, by Country/Region, 2016-2028 (US$ Bn)

Frequently Asked Questions

How COVID 19 Impacted Rock Salt Market?

Likewise other industries, COVID 19 also taken a toll on Rock Salt market with around 9.12% decline in its revenue in 2020 as compare to 2019

Which is the leading regional market for Rock Salt?

Asia Pacific is the largest regional market with highest share in the total volume of Rock Salt consumed in 2021

What is the major growth driving factors for global Rock Salt market?

Growing demand for from chemical and food & beverage industry to lead the demand for rock salt in the years to come

Which is major segment in Rock Salt market by Application?

Chemicals segment dominated the Rock Salt consumption in 2021 with over 35% share

Which is major segment in Rock Salt market by Sales channel?

Supermarkets/Hypermarkets was the largest Sales channel of Rock Salt in 2021 with over 20% share

Food Encapsulation Market

Published:
Report ID: 5663

Gluten-Free Bakery Products Market

Published:
Report ID: 36306

Low Calorie Food Market

Published:
Report ID: 12195

Food Preservatives Market

Published:
Report ID: 5660

Dairy Blends Market

Published:
Report ID: 4452

Sodium Benzoate Market

Published:
Report ID: 10462

Ready to Use Therapeutic Food Market

Published:
Report ID: 8866

Sunflower Oil Market

Published:
Report ID: 10108

Specialty Milk Formula Market

Published:
Report ID: 9566

UK Clean Label Starch Market

Published:
Report ID: 35481

Germany Clean Label Starch Market

Published:
Report ID: 35468

U.S. Clean Label Starch Market

Published:
Report ID: 35460

Purchase Options

$2999
Delivery Format: Excel.
$4999
Designed for the individual purchaser.
$6999
Users located at a single corporate site or regional office.
$7999
Allowed for unlimited sharing globally within one company.
Smallform of Sample request

Have a question?

User Profile

Don’t settle for less – trust Mitul to help you find the best solution.

Report delivery within 24 to 48 hours

– Other Info –

What people say?-

User Review

I am very impressed with the information in this report. The author clearly did their research when they came up with this product and it has already given me a lot of ideas.

Jana Schmidt
CEDAR CX Technologies

– Connect with us –

Phone

+91 6232 49 3207


support

24/7 Research Support


sales@credenceresearch.com

– Research Methodology –

Going beyond the basics: advanced techniques in research methodology

– Trusted By –

Pepshi, LG, Nestle
Motorola, Honeywell, Johnson and johnson
LG Chem, SIEMENS, Pfizer
Unilever, Samsonite, QIAGEN