
Market Overview
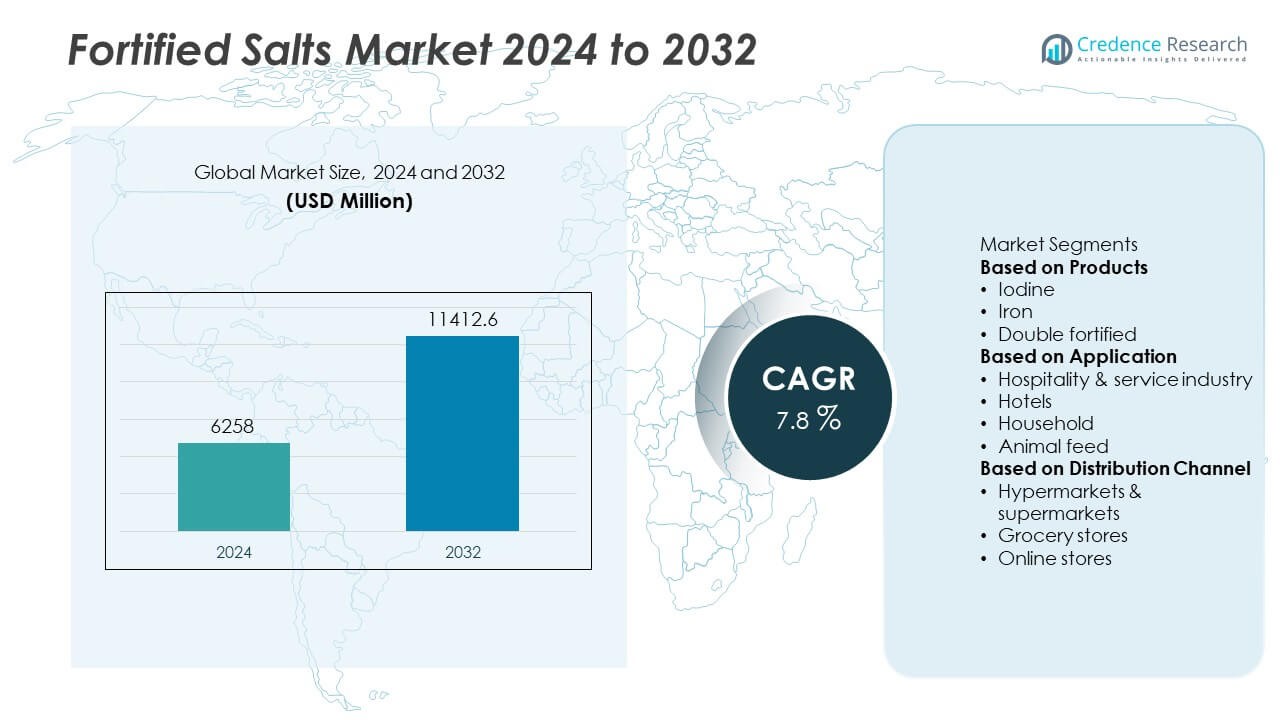
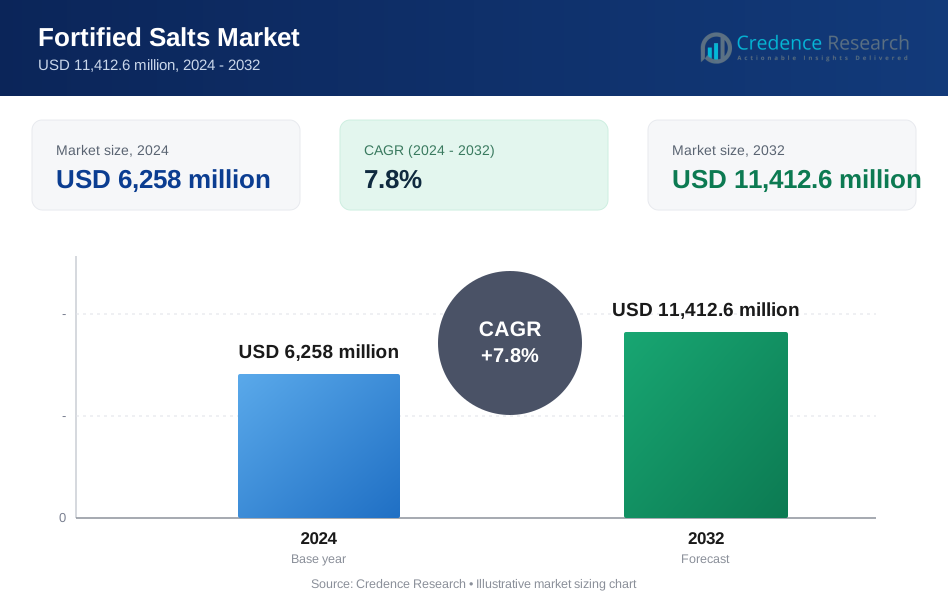
The global fortified salts market was valued at USD 6,258 million in 2024 and is projected to reach USD 11,412.6 million by 2032, growing at a CAGR of 7.8% during the forecast period.
| REPORT ATTRIBUTE | DETAILS |
|---|---|
| Historical Period | 2020-2023 |
| Base Year | 2024 |
| Forecast Period | 2025-2032 |
| Fortified Salts Market Size 2024 | USD 6,258 Million |
| Fortified Salts Market, CAGR | 7.8% |
| Fortified Salts Market Size 2032 | USD 11,412.6 Million |
The Fortified Salts Market grows due to rising government mandates, public health programs, and consumer focus on nutrition. Mandatory iodine and iron fortification policies drive large-scale adoption in developing countries. Manufacturers invest in advanced microencapsulation technologies to ensure nutrient stability and product quality.
Geographically, the Fortified Salts Market sees strong adoption across Asia-Pacific, North America, Europe, Latin America, and the Middle East & Africa. Asia-Pacific leads growth due to large populations, high prevalence of iodine and iron deficiencies, and government-backed distribution programs. North America and Europe show steady demand driven by strong regulatory frameworks and consumer awareness. Latin America and Africa benefit from UNICEF and WHO-supported nutrition initiatives that expand fortified salt penetration in rural areas. Key players such as Cargill, Compass Minerals, Tata Chemicals Ltd., and AkzoNobel focus on product innovation, nutrient stability, and expansion of distribution networks to reach underserved regions. Companies invest in advanced fortification processes and collaborate with public health agencies to meet global nutrition goals. Strategic partnerships, capacity expansions, and strong retail presence position these players to maintain competitive strength and capture rising demand for fortified salts in both developed and developing economies worldwide.
Market Insights
- The Fortified Salts Market was valued at USD 6,258 million in 2024 and is projected to reach USD 11,412.6 million by 2032, growing at a CAGR of 7.8%.
- Rising government mandates for iodine and iron fortification drive consistent demand across developing and developed nations.
- Increasing consumer focus on preventive health and nutrition supports the shift toward branded and packaged fortified salts.
- Key players such as Cargill, Compass Minerals, Tata Chemicals Ltd., and AkzoNobel invest in technology and partnerships to strengthen market position.
- High production costs and quality control challenges act as restraints, particularly for small-scale producers in price-sensitive markets.
- Asia-Pacific leads growth supported by large-scale public distribution programs, while North America and Europe maintain steady consumption through regulatory compliance and consumer awareness.
- Expanding retail networks, digital campaigns, and e-commerce platforms create new opportunities, improving availability and accelerating adoption in rural and urban regions alike.
Market Drivers
Rising Government Mandates and Nutrition Programs
Governments across the world support mandatory fortification to fight micronutrient deficiencies. The Fortified Salts Market benefits from public health campaigns promoting iodine and iron consumption. National nutrition programs distribute fortified salt through public distribution systems and school meals. These initiatives raise awareness among consumers about health benefits. Manufacturers align production with WHO and UNICEF fortification guidelines. Strong policy support ensures consistent demand from both urban and rural populations.
- For instance, in Madhya Pradesh and Gujarat (India), double-fortified salt (iron + iodine) was introduced into social safety net programs in 2018. These programs covered millions of households in those states and continue to operate, with a study evaluating their implementation published in June 2024
Growing Consumer Health Awareness and Lifestyle Shifts
Consumers focus on preventive healthcare and nutrient-rich diets. The Fortified Salts Market grows with rising demand for functional foods. Awareness of anemia, goiter, and vitamin D deficiency drives fortified product adoption. Retailers highlight health-focused products on shelves to attract urban buyers. It strengthens trust when backed by scientific claims and endorsements. Busy lifestyles encourage consumers to choose ready-to-use fortified ingredients for balanced nutrition.
- For instance, a 2023 study published in BMC Public Health reported on the acceptability of double-fortified salt (DFS) in rural Tanzania, finding that 78% of participants overall found DFS acceptable, similar to standard iodized salt.
Technological Advancements in Salt Fortification Processes
Improved technologies make fortification efficient and cost-effective. The Fortified Salts Market uses microencapsulation and spray-drying techniques to preserve nutrients. These innovations maintain taste, texture, and shelf life of salt products. Automation allows precise blending and consistent nutrient levels across batches. It reduces production waste and improves scalability for large manufacturers. Advanced processes encourage small producers to adopt fortification standards.
Expansion of Retail Networks and Distribution Channels
Wider availability of fortified products boosts market penetration. The Fortified Salts Market leverages supermarkets, hypermarkets, and e-commerce to reach diverse consumers. Packaged salt brands expand presence in rural markets through partnerships with local distributors. Marketing campaigns educate households about fortification benefits. It increases brand loyalty and repeat purchases over time. Strong distribution infrastructure supports steady growth across developing regions.
Market Trends
Shift Toward Multi-Micronutrient Fortification
Manufacturers move beyond iodine to include iron, folic acid, and zinc. The Fortified Salts Market adapts to demand for comprehensive nutrition solutions. Multi-nutrient blends help address multiple deficiencies in a single product. It improves public health impact in regions with widespread malnutrition. Research supports stable formulations that retain nutrient quality over storage periods. Governments encourage broader micronutrient coverage to maximize health outcomes.
- For instance, JVS Foods Pvt Ltd, leveraging technology transferred from the University of Toronto, produces extruded premixes at large scale for triple- and quadruple-fortified salts, enabling stable formulations that maintain micronutrient retention over shelf lives and produce fortified salt granules maximizing bioavailability.
Rising Preference for Premium and Packaged Products
Consumers choose branded, hygienically packaged fortified salt over loose alternatives. The Fortified Salts Market grows with demand for quality assurance and convenience. Packaged salts offer consistent fortification levels and longer shelf life. It appeals to urban households seeking safe and traceable food products. Branding efforts focus on communicating health benefits clearly. Retailers dedicate premium shelf space to attract health-conscious buyers.
- For instance, BioAnalyt's iCheck quality assurance technology supports manufacturers and retailers by enabling the rapid, on-site, quantitative measurement of iodine and iron in salt batches.
Integration of Digital Marketing and Awareness Campaigns
Brands use social media and digital platforms to educate consumers. The Fortified Salts Market benefits from interactive campaigns that highlight nutrient importance. Online influencers promote fortified products in nutrition-focused content. It engages younger consumers who rely on digital channels for health information. QR codes on packaging provide instant product details and fortification data. Digital education drives informed purchasing decisions.
Growth of Public-Private Partnerships for Fortification
Collaboration between governments, NGOs, and salt producers strengthens market outreach. The Fortified Salts Market gains from coordinated distribution strategies. Partnerships focus on rural penetration where deficiencies are more severe. It ensures subsidized pricing and continuous supply to low-income populations. Industry associations support training programs for small-scale producers. Such initiatives create a sustainable ecosystem for fortified salt adoption.
Market Challenges Analysis
High Production Costs and Quality Control Issues
Producers face high costs for nutrient additives and specialized equipment. The Fortified Salts Market struggles with maintaining consistent nutrient levels during large-scale production. Quality control failures risk loss of consumer trust and regulatory penalties. It requires investment in advanced technology and skilled workforce. Smaller producers find compliance with global standards challenging. Price-sensitive markets resist higher costs, slowing fortified product adoption.
Limited Awareness and Distribution Barriers in Rural Areas
Many rural consumers remain unaware of fortification benefits. The Fortified Salts Market faces difficulties reaching remote populations with regular supply. Weak distribution networks lead to inconsistent availability and lower consumption rates. It impacts the success of government nutrition programs. Retailers in low-income regions hesitate to stock higher-priced fortified products. Overcoming these barriers requires sustained education campaigns and infrastructure development.
Market Opportunities
Expansion into Emerging Economies and Underserved Regions
Rising population and urbanization create strong demand for nutrient-rich food products. The Fortified Salts Market can grow by targeting developing countries with high deficiency rates. Governments and NGOs provide funding to expand fortified salt coverage. It allows producers to reach new households through public distribution systems. Strategic partnerships with local distributors improve last-mile delivery. This expansion helps reduce health disparities and builds long-term consumer loyalty.
Innovation in Product Formats and Customized Solutions
Manufacturers explore flavored, low-sodium, and specialty fortified salts to attract diverse consumers. The Fortified Salts Market benefits from premiumization and value-added product lines. Customized solutions for institutional buyers and food processors create new revenue streams. It encourages investment in research to enhance nutrient stability and taste. Digital labeling and QR codes improve transparency and consumer trust. Innovative formats open opportunities in retail and foodservice segments worldwide.
Market Segmentation Analysis:
By Products
The Fortified Salts Market is segmented into iodized salt, double fortified salt, and mineral-enriched salt. Iodized salt holds the largest share due to global efforts to eliminate iodine deficiency disorders. Double fortified salt, enriched with both iodine and iron, gains traction in regions with high anemia prevalence. It helps address two major micronutrient deficiencies through a single product. Mineral-enriched salt with zinc, selenium, and other trace elements attracts health-conscious consumers. Producers invest in technology to ensure nutrient stability during storage and transportation. Growing consumer awareness drives steady adoption of premium fortified products.
- For instance, researchers at CSIR-CSMCRI developed a double fortified salt containing 1,000 ppm iron and 30 ppm iodine, where iron in the form of Fe³⁺ remained white and stable in storage trials.
By Application
Fortified salt finds applications in household consumption, food processing, and institutional use. Household consumption remains dominant due to regular use in cooking and meal preparation. The Fortified Salts Market benefits from government programs distributing fortified salt through public supply chains. Food processing industries use fortified salt in packaged snacks, bakery products, and ready-to-eat meals. It supports compliance with nutrition labeling requirements in several countries. Institutional demand grows from schools, hospitals, and defense sectors that prioritize nutrient-rich diets. Increased focus on preventive health care encourages greater use of fortified products across sectors.
- For instance, the University of Toronto’s Food Engineering Research Group produced a double fortified salt blend with microencapsulated ferrous fumarate that retained over 80% iodine and over 90% ferrous iron after one-year storage at 40 °C and 60 % relative humidity.
By Distribution Channel
Distribution channels include supermarkets and hypermarkets, convenience stores, specialty stores, and online platforms. Supermarkets and hypermarkets dominate due to wide availability and consumer preference for packaged salt. The Fortified Salts Market leverages e-commerce to expand reach, particularly among urban buyers. Online sales offer doorstep delivery and product comparisons that improve purchasing decisions. It allows brands to engage directly with health-conscious consumers through digital campaigns. Convenience stores and specialty retailers play a vital role in rural and semi-urban regions. Strong distribution networks ensure consistent product supply and help maintain market momentum.
Segments:
Based on Products
- Iodine
- Iron
- Double fortified
Based on Application
- Hospitality & service industry
- Hotels
- Household
- Animal feed
Based on Distribution Channel
- Hypermarkets & supermarkets
- Grocery stores
- Online stores
Based on the Geography:
- North America
- U.S.
- Canada
- Mexico
- Europe
- UK
- France
- Germany
- Italy
- Spain
- Russia
- Belgium
- Netherlands
- Austria
- Sweden
- Poland
- Denmark
- Switzerland
- Rest of Europe
- Asia Pacific
- China
- Japan
- South Korea
- India
- Australia
- Thailand
- Indonesia
- Vietnam
- Malaysia
- Philippines
- Taiwan
- Rest of Asia Pacific
- Latin America
- Brazil
- Argentina
- Peru
- Chile
- Colombia
- Rest of Latin America
- Middle East
- UAE
- KSA
- Israel
- Turkey
- Iran
- Rest of Middle East
- Africa
- Egypt
- Nigeria
- Algeria
- Morocco
- Rest of Africa
Regional Analysis
North America
North America holds a market share of around 26% in the Fortified Salts Market. Strong regulatory support from the FDA and Health Canada ensures high compliance with fortification standards. It benefits from well-established distribution networks and strong consumer awareness of micronutrient deficiencies. Widespread use of iodized salt in households drives consistent demand. Food manufacturers adopt fortified salts to meet nutrition labeling requirements and corporate wellness goals. Growth is supported by the rising popularity of specialty mineral salts targeting health-conscious consumers. The presence of key players in the U.S. and Canada enhances product availability and innovation.
Europe
Europe accounts for nearly 22% share of the Fortified Salts Market. Government initiatives under WHO’s European Food and Nutrition Action Plan promote mandatory iodine fortification programs. It drives high adoption rates in countries like Germany, the U.K., and the Nordic region. Growing demand for premium and clean-label products supports market expansion. Public campaigns continue to address iodine deficiency in inland regions. Retailers invest in private-label fortified salt brands to cater to rising health trends. Stable regulatory frameworks encourage producers to maintain consistent nutrient levels and quality standards.
Asia-Pacific
Asia-Pacific leads with the largest share of about 34% in the Fortified Salts Market. The region reports the highest prevalence of iodine and iron deficiencies, prompting strong government interventions. India, China, and Indonesia dominate consumption due to large population bases. It benefits from extensive public distribution programs and school meal initiatives. Rising income levels and urbanization create opportunities for branded fortified salt producers. Expansion of modern retail formats and e-commerce accelerates product accessibility. Local and multinational players invest in capacity expansion to meet growing demand.
Latin America
Latin America holds close to 10% share of the Fortified Salts Market. Countries like Brazil and Mexico implement mandatory iodization programs to combat goiter prevalence. It supports steady household consumption across urban and rural populations. Regional manufacturers adopt innovative processes to improve nutrient retention in tropical climates. Food industry partnerships with government agencies strengthen fortified product penetration. Rising middle-class population favors packaged and branded salts with reliable quality. Investment in distribution networks helps overcome supply chain challenges in remote areas.
Middle East & Africa
Middle East & Africa represent nearly 8% share of the Fortified Salts Market. Deficiency control programs led by UNICEF and WHO play a vital role in adoption. It drives demand in nations with high malnutrition rates, including Nigeria, Kenya, and parts of the Gulf. Import dependency creates opportunities for local producers to scale production capacity. Growing urban population and modern retail expansion boost packaged salt sales. Awareness campaigns educate consumers about health benefits of fortified products. Government subsidies and partnerships with NGOs ensure affordability for low-income households.
Key Player Analysis
- Cargill
- Schweizer Salinen
- Compass Minerals
- AkzoNobel
- United Salt Corporation
- Ankur Salt
- Kutch Brine Chem Industries
- China National Salt Industry
- Sambhar
- Tata Chemicals Ltd.
Competitive Analysis
Competitive landscape of the Fortified Salts Market features leading players such as Cargill, Compass Minerals, Tata Chemicals Ltd., AkzoNobel, Schweizer Salinen, United Salt Corporation, Ankur Salt, Kutch Brine Chem Industries, China National Salt Industry, and Sambhar. These companies focus on innovation, nutrient stability, and large-scale production to meet global nutrition standards. They invest in advanced fortification technologies such as microencapsulation to maintain iodine and iron content during storage and distribution. Strategic partnerships with governments and NGOs strengthen participation in public health programs and improve rural market reach. Players expand manufacturing capacities and modernize facilities to meet rising demand from households and food processing sectors. They enhance product portfolios with mineral-enriched and low-sodium fortified salts to target health-conscious consumers. Strong distribution networks, retail partnerships, and digital campaigns support brand visibility and consumer education. Competitive intensity remains high, driving continuous research, cost optimization, and market expansion across diverse geographies.
Recent Developments
- In October 2024, Kutch Brine Chem Industries operated its automated refinery in Kutch at a capacity of 750 metric tons of refined iodized salt per day in 2024.
- In August 2024, Cargill continued advancements in its solar salt system facilities in Newark and Redwood City, CA, including the implementation of fish screens for pump intakes and increasing berm heights by up to 15 centimeters to improve production resilience and enable environmentally protective salt and micronutrient (including fortified salt) output.
- In February 2024, Tata Chemicals Ltd. upgraded its Mithapur facility’s fortification unit, enabling production of 20,000 metric tons of double-fortified salt per month (iodine and iron supplementation), with in-line nutrient sensors ensuring micronutrient homogeneity for mass retail packs distributed across India.
Report Coverage
The research report offers an in-depth analysis based on Products, Application, Distribution Channel and Geography. It details leading market players, providing an overview of their business, product offerings, investments, revenue streams, and key applications. Additionally, the report includes insights into the competitive environment, SWOT analysis, current market trends, as well as the primary drivers and constraints. Furthermore, it discusses various factors that have driven market expansion in recent years. The report also explores market dynamics, regulatory scenarios, and technological advancements that are shaping the industry. It assesses the impact of external factors and global economic changes on market growth. Lastly, it provides strategic recommendations for new entrants and established companies to navigate the complexities of the market.
Future Outlook
- The Fortified Salts Market will expand with rising government-backed nutrition programs worldwide.
- Demand for double fortified salts with iron and iodine will increase in developing regions.
- Technological advances will improve nutrient stability and production efficiency.
- E-commerce and digital platforms will boost direct-to-consumer sales.
- Urbanization will drive demand for packaged and branded fortified salt products.
- Partnerships between public agencies and private producers will strengthen distribution in rural areas.
- Premiumization trends will create opportunities for specialty and mineral-enriched salt variants.
- Food processing industries will adopt fortified salt to meet labeling and compliance norms.
- Investments in research will lead to new formulations with improved taste and texture.
- Global focus on addressing micronutrient deficiencies will sustain long-term market growth.
Request a Free Sample
Fill in your details and we'll send you a free sample report.
- Sample data tables & charts
- Research methodology
Need a Custom Version of This Report?
Tailor the scope, geography, or segments to your exact requirements.
- Custom geography or segment scope
- Direct access to our analyst team
Frequently Asked Questions
What is the current market size for Fortified Salts, and what is its projected size in 2032?
At what Compound Annual Growth Rate is the Fortified Salts market projected to grow between 2025 and 2032?
Which Fortified Salts market segment held the largest share in 2024?
What are the primary factors fueling the growth of the Fortified Salts market?
Who are the leading companies in the Fortified Salts market?
Which region commanded the largest share of the Fortified Salts market in 2024?
Table of Content
Chapter 1. Report Introduction
- 1.1 Report Description & Purpose
- 1.1.1 Report Title & Market Definition
- 1.1.2 Unique Selling Propositions (USP) & Key Differentiators
- 1.1.3 Value Proposition for Stakeholders
- 1.2 Research Objectives
- 1.2.1 Market Sizing Objectives (Volume & Revenue)
- 1.2.2 Segmentation Objectives
- 1.2.3 Competitive Intelligence Objectives
- 1.2.4 Forecast & Scenario Objectives
- 1.3 Report Scope
- 1.3.1 Fortified Salts Scope – Types & Subtypes Covered
- 1.3.2 Geographic Scope – Regions & Countries Covered
- 1.3.3 Historical Period, Base Year & Forecast Period (2024; forecast to 2032)
- 1.3.4 Inclusions & Exclusions
- 1.4 HS Code & Classification Framework
- 1.5 Currency, Units & Pricing Basis
- 1.6 Target Stakeholders
- 1.7 Limitations & Assumptions
Chapter 2. Executive Summary
- 2.1 Global Fortified Salts Market Snapshot
- 2.1.1 Market Size – Historical (2024) & Forecast (2024-2032) (2024: USD 6,258 million → 2032: USD 11,412.6 million)
- 2.1.2 Volume & Revenue – Global Totals
- 2.1.3 Key Market Highlights – Top Five Facts
- 2.2 Fortified Salts Market Segmentation Snapshot
- 2.2.1 Market Split by Region – 2024 vs. 2032
- 2.3 Competitive Snapshot
- 2.3.1 Top 10 Players by Revenue Share – 2024
- 2.3.2 Top 10 Players by Volume Share – 2024
- 2.3.3 Recent Strategic Developments (18-Month Summary)
- 2.4 Key Investment Highlights & Strategic Conclusions
Chapter 3. Fortified Salts Market Dynamics & Industry Analysis
- 3.1 Market Overview & Context
- 3.1.1 Fortified Salts Market Position in the Broader Automotive Value Chain
- 3.1.2 OEM vs. Replacement Market Dynamics
- 3.1.3 Market Maturity & Development Stage by Region
- 3.2 Fortified Salts Market Drivers
- 3.3 Fortified Salts Market Restraints & Challenges
- 3.4 Fortified Salts Market Opportunities
- 3.5 Porter's Five Forces Analysis
- 3.5.1 Threat of New Entrants
- 3.5.2 Bargaining Power of Suppliers
- 3.5.3 Bargaining Power of Buyers
- 3.5.4 Threat of Substitutes
- 3.5.5 Competitive Rivalry – Intensity Assessment
- 3.6 Fortified Salts Value Chain Analysis
- 3.6.1 Upstream – Raw Material/Input Suppliers
- 3.6.1.1 Raw Material/Input 1
- 3.6.1.2 Raw Material/Input 2
- 3.6.1.3 Raw Material/Input 3
- 3.6.2 Midstream – Production/Manufacturing/Service Delivery
- 3.6.2.1 Production/Process Overview
- 3.6.2.2 Key Facility Locations & Capacity by Manufacturer
- 3.6.3 Downstream – Distribution & End Consumer
- 3.6.3.1 Primary Channel – B2B/OEM
- 3.6.3.2 Secondary Channels – Dealer, Retail, Online, Direct
- 3.6.4 Value Chain Profitability Analysis
- 3.6.1 Upstream – Raw Material/Input Suppliers
- 3.7 PESTEL Analysis
- 3.7.1 Political Factors
- 3.7.2 Economic Factors
- 3.7.3 Social Factors
- 3.7.4 Technological Factors
- 3.7.5 Environmental Factors
- 3.7.6 Legal Factors
- 3.8 Fortified Salts Supply Chain Analysis
- 3.8.1 Raw Material/Input Supply Risk Assessment
- 3.8.2 Manufacturing Concentration Risk (Geographic Exposure)
- 3.8.3 Trade Disruption Impact Analysis
- 3.9 Regulatory & Policy Landscape
Note: The regulatory and policy landscape section covers regulations based on their applicability to the market, Fortified Salts category, geography, and scope of the study. Only regulatory frameworks with a material impact on operations, compliance, trade, sustainability, or market access are analyzed in detail.
Chapter 4. Key Investment Pockets & Opportunity Analysis
- 4.1 Fortified Salts Market Attractiveness Analysis
- 4.1.1 By Region – Investment Attractiveness Matrix (Volume × CAGR)
- 4.2 Absolute Revenue Growth Opportunity
- 4.2.1 By Region – Absolute USD Growth Through 2032
- 4.3 Incremental Volume Opportunity
- 4.3.1 By Region – Incremental Volume Through 2032
- 4.3.2 Segment – Incremental Volume
- 4.4 Emerging Submarket Opportunity Deep Dive (Subject to Applicability)
- 4.5 Emerging Market Opportunity Scorecards
- 4.5.1 United States
- 4.5.2 Europe
- 4.5.3 Asia
- 4.5.4 Middle East & Africa
Note: Emerging Market Opportunity Scorecards will be included based on relevance and strategic importance. Regions listed are indicative and may vary depending on data availability and market dynamics.
Chapter 5. Fortified Salts Import-Export Analysis & Trade Flows
- 5.1 Global Trade Overview
- 5.1.1 Global Export Value by Country (2024)
- 5.1.2 Global Export Volume by Country (2024)
- 5.1.3 Global Import Value by Country (2024)
- 5.1.4 Global Import Volume by Country (2024)
- 5.1.5 Net Trade Balance by Country (2024)
- 5.2 Export Analysis – Segment
- 5.2.1 Type 1 (HS Code)
- 5.2.2 Type 2 (HS Code)
- 5.2.3 Type 3 (HS Code)
- 5.2.4 Type 4 (HS Code)
- 5.2.5 Type 5 (HS Code)
- 5.3 Import Analysis – Segment
- 5.3.1 Type 1 (HS Code)
- 5.3.2 Type 2 (HS Code)
- 5.3.3 Type 3 (HS Code)
- 5.3.4 Type 4 (HS Code)
- 5.3.5 Type 5 (HS Code)
- 5.4 Average Unit Trade Prices
- 5.4.1 Average Export Price – Segment & Country
- 5.4.2 Average Import Price – Segment & Source Country
- 5.4.3 Price Trends (2024)
- 5.5 Key Trade Route Analysis
- 5.5.1 Trade Route 1
- 5.5.2 Trade Route 2
- 5.5.3 Trade Route 3
- 5.5.4 Trade Route 4
- 5.5.5 Trade Route 5
- 5.6 Trade Policy Impact Assessment
- 5.6.1 US Anti-Dumping & Section 301 Tariffs
- 5.6.2 EU Customs Union Impact
- 5.6.3 Major Free Trade Agreements
- 5.6.4 USMCA Rules of Origin
Note: Trade policy analysis will be included only where relevant to the Fortified Salts market.
Chapter 6. Competitive Landscape & Company Benchmarking
- 6.1 Fortified Salts Market Concentration & Structure
- 6.1.1 Herfindahl-Hirschman Index (HHI) – vs. 2024
- 6.1.2 Tier 1, Tier 2 & Tier 3 Market Structure
- 6.1.3 Global, Regional & Local Player Dynamics
- 6.2 Fortified Salts Market Share Analysis – 2024
- 6.2.1 Global Revenue Share by Company
- 6.2.2 Global Volume Share by Company
- 6.2.3 Regional Revenue Share
- 6.2.4 Market Share Evolution ( vs. 2024)
- 6.2.5 OEM Segment Share by Company
- 6.2.6 Replacement Segment Share by Company
- 6.3 Production/Delivery Capacity & Facility Analysis
- 6.3.1 Global Installed Capacity
- 6.3.2 Capacity Utilization Rates
- 6.3.3 Production/Output Volume
- 6.3.4 Facility Locations & Capacity Map
- 6.3.5 Planned Capacity Additions
- 6.4 Fortified Salts Competitive Benchmarking Matrix
- 6.4.1 Revenue, Volume, CAGR & Profitability Comparison
- 6.4.2 Channel Revenue Mix
- 6.4.3 Geographic Revenue Exposure
- 6.4.4 R&D Intensity
- 6.4.5 Sustainability Maturity
- 6.5 Strategic Developments in Fortified Salts (Last 24 Months)
- 6.5.1 Mergers, Acquisitions & Divestments
- 6.5.2 New Fortified Salts Launches
- 6.5.3 Facility Expansions
- 6.5.4 Strategic Alliances, Joint Ventures & Partnerships
- 6.5.5 Distribution Expansion & Market Entry
- 6.5.6 Sustainability & ESG Initiatives
- 6.6 Competitive Strategy Mapping
- 6.6.1 Leader, Challenger, Follower & Niche Classification
- 6.6.2 Pricing Strategy Comparison
- 6.6.3 Channel Strategy Matrix
Note: Strategic developments are included based on their materiality and the availability of reliable information.
Chapter 7. Global Fortified Salts Market – By Distribution Channel
- 7.1 Segment Overview
- 7.1.1 Volume & Revenue Split by Channel (2024 & 2032)
- 7.1.2 Channel Mix Evolution (2024-2032)
Chapter 8. Regional Market Analysis – Global Overview
- 8.1 Global Regional Overview
- 8.1.1 Regional Volume Share
- 8.1.2 Regional Revenue Share
- 8.1.3 Regional Volume by Region
- 8.1.4 Regional Revenue by Region
- 8.1.5 Regional Forecast Through 2032
- 8.2 Cross-Regional Segment Analysis
- 8.2.1 By Distribution Channel
- 8.2.2 By Brand/Price Tier
Chapter 9. North America Fortified Salts Market
- 9.1 United States
- 9.2 Canada
- 9.3 Mexico
Chapter 10. Europe Fortified Salts Market
- 10.1 Germany
- 10.2 France
- 10.3 Italy
- 10.4 United Kingdom
- 10.5 Spain
- 10.6 Poland
- 10.7 Russia
- 10.8 Netherlands
- 10.9 Belgium
- 10.10 Sweden
- 10.11 Denmark
- 10.12 Norway
- 10.13 Rest of Europe
Chapter 11. Asia Pacific Fortified Salts Market
- 11.1 China
- 11.2 India
- 11.3 Japan
- 11.4 South Korea
- 11.5 Thailand
- 11.6 Indonesia
- 11.7 Vietnam
- 11.8 Malaysia
- 11.9 Australia
- 11.10 Rest of Asia Pacific
Chapter 12. Latin America Fortified Salts Market
- 12.1 Brazil
- 12.2 Argentina
- 12.3 Colombia
- 12.4 Chile
- 12.5 Rest of Latin America
Chapter 13. Middle East Fortified Salts Market
- 13.1 Saudi Arabia
- 13.2 United Arab Emirates
- 13.3 Turkey
- 13.4 Israel
- 13.5 Iran
- 13.6 Rest of the Middle East
Chapter 14. Africa Fortified Salts Market
- 14.1 South Africa
- 14.2 Egypt
- 14.3 Nigeria
- 14.4 Morocco
- 14.5 Rest of Africa
Chapter 15. Fortified Salts Company Profiles
- 15.1 [Company 01]
- 15.1.1 Company Overview
- 15.1.2 Key Management Personnel
- 15.1.3 Products & Services Portfolio
- 15.1.4 Financial Performance
- 15.1.5 Key Market Focus & Geographic Presence
- 15.1.6 Recent Developments & Strategic Initiatives
Note: The company profile list is preliminary and may change based on research findings, market developments, data availability, and client requirements.
Chapter 16. Appendices
- Appendix A – List of Abbreviations & Acronyms
- Appendix B – Industry Classification Code Reference – Full Series
- Appendix C – Production & Capacity Data Tables
- Appendix D – End-Use & Demand Base Tables
- Appendix E – Consumption & Replacement Rate Assumptions
- Appendix F – ASP Reference Tables
- Appendix G – Manufacturing & Facility Database
- Appendix H – Import-Export Data Tables
- Appendix I – Regulatory Summary Tables
- Appendix J – Primary Research Participant List (Anonymized)
- Appendix K – Primary Research Questionnaire Framework
- Appendix L – Data Sources & Bibliography
- Appendix M – Market Size Divergence & Source Comparison
Chapter 17. Research Methodology
- 17.1 Research Framework & Philosophy
- 17.2 Secondary Research – Sources, Hierarchy & Data Extraction
- 17.3 Data Modeling – Bottom-Up & Top-Down Market Sizing
- 17.4 Primary Research – Stakeholder Framework, LOI & Sample Sizes
- 17.5 Forecast Methodology – Regression, Scenario & Sensitivity Analysis
- 17.6 Quality Control – Four-Layer Validation Framework
- 17.7 Limitations & Standard Assumptions
- 17.8 Disclaimer
