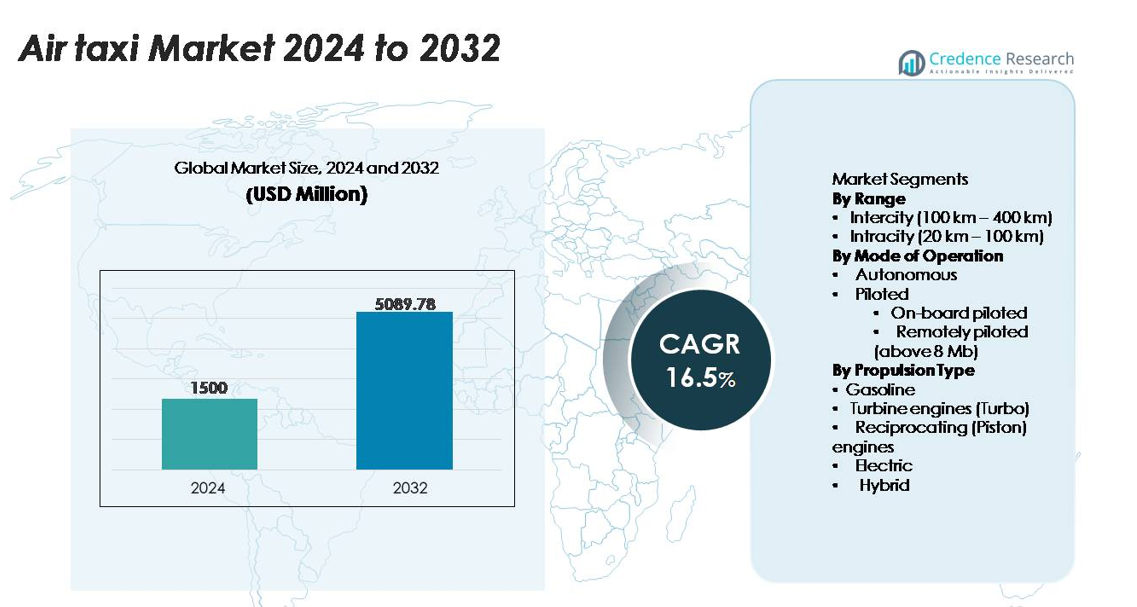
Home » Automotive & Transportation » Air Taxi Market

Air Taxi Market By Range Intercity (100 to 400 km), Intercity (20 to 100 km) By mode of operation (Optionally piloted, piloted) By type (Air taxi platform service, Air taxi MRO services, Air taxi pilot training services)-Growth, Future Prospects & Competitive Analysis, 2016 – 2030

Price: $4999

Published: | Report ID: 18691 | Report Format : PDF

Key Highlights of the Report

The air taxi market is segmented by range, mode of operation, type and region. The piloted mode of operation is the leading segment of the air taxi market with a significant market share. Intercity (100 Kilometers to 400 Kilometers) segment holding the largest market share in 2022. Whereas, air taxi MRO services segment dominating in the market with the highest revenue, with North America as the leading region.

The air taxi market has several drivers; increasing need for efficient and time-saving transportation solutions in congested urban areas and advancements in technology are driving the market growth. However, the market also faces significant challenges, such as airspace management and integration with existing aviation systems.

Nonetheless, the air taxi market offers significant growth opportunities with the growing awareness of climate change and the environmental impact of transportation.

Market Overview

The Air Taxi Market has witnessed steady growth in recent years and is expected to continue growing at a CAGR of 25.58% between 2022 and 2030. The market was valued at USD 1.3 billion in 2022 and is expected to reach USD 6.40 billion in 2030.

Design Element 2

Access crucial information at unmatched prices!

Request your free sample report today & start making informed decisions powered by Credence Research!

Download Free Sample
CTA Design Element 3

What Are the Main Drivers of The Air Taxi Market?

The air taxi market is driven by several factors, including the increasing need for efficient and time-saving transportation solutions in congested urban areas and advancement in technology. These factors increase the demand for air taxi, which in turn drives market growth.

What Are the Major Challenges Faced by The Air Taxi Market?

The Air Taxi Market also faces several challenges, including airspace management and integration with existing aviation systems.

What Are the Growth Opportunities in The Air Taxi Market?

The air taxi market offers significant growth opportunities, and the rising awareness of climate change and the environmental impact of transportation across the world presents a significant growth opportunity.

Executive Summary

Overview of The Air Taxi Market

The Air Taxi Market  has been steadily growing in recent years, driven by the increasing need for efficient and time-saving transportation solutions in congested urban areas. The  growing awareness of climate change has resulted in an upswing in the demand for air taxi. The market is characterized by a wide range of modes of operation types.

Market Definition

The air taxi market refers to the emerging sector within the aviation industry that focuses on providing on-demand, short-distance transportation services using small aircraft. Air taxis, also known as urban air mobility (UAM) vehicles or flying taxis, are typically designed to transport a small number of passengers, usually between one and six, over relatively short distances, such as within urban or suburban areas.

The concept of air taxis involves using electric or hybrid-electric vertical takeoff and landing (VTOL) aircraft, which are capable of taking off and landing vertically like helicopters but have the advantage of being quieter, more energy-efficient, and potentially autonomous. These aircraft may be piloted or operated remotely, depending on the specific design and regulatory framework. These companies typically offer services through digital platforms or mobile applications, allowing customers to book flights on-demand or in advance. The market is also witnessing collaborations between aircraft manufacturers, technology companies, and transportation service providers to develop the necessary infrastructure, including landing pads, charging stations, and air traffic management systems, to support the operation of air taxis.

Market Insights

  • The global demand for air taxi was valued at USD 1.3 billion in 2022 and is expected to reach USD 6.40 billion in 2030, growing at a CAGR of 25.58% between 2023 and 2030.
  • Intercity (100 to 400 m) and Intercity (20 to 100 km) both segments hold a significant market share.
  • The optionally piloted segment is expected to post the highest CAGR during the forecast period between 2022-2030.
  • North America is fuelling the growth of the air taxi market with a major market share.
  • The increasing need for efficient and time-saving transportation solutions in congested urban areas and advancements in technology are major drivers of market growth.
  • Airspace management and integration with existing aviation systems is a major challenge faced by the market.
  • The rising awareness of climate change and the environmental impact of transportation across the world presents a significant growth opportunity.
  • Intercity (100 to 400 km ) holds a significant market share in the air taxi market.
  • Intercity (20 to 100 km ) catering to shorter distances could offer efficient urban transportation and alleviate traffic congestion within metropolitan areas.
  • However, it is difficult to determine which of the two segments dominates the market.

Air Taxi Market

Segmentation by Mode of Operation

  • The pilot segment holds the largest market share.
  • However, the optionally piloted segment is expected to grow at the fastest rate during the forecast period.

Segmentation by Type

  • Air taxi platform services provide the infrastructure and technology needed to connect passengers with air taxi operators, facilitating bookings, scheduling, and other logistical aspects of air taxi travel.
  • Air taxi MRO services ensure the safe and efficient operation of air taxi aircraft by maintaining and repairing them as needed.
  • Air taxi pilot training services are designed to provide aspiring pilots with the necessary knowledge, skills, and experience to navigate the unique requirements of air taxi operations.

Segmentation by Region

  • North America is fuelling the growth of the air taxi market with a major market share.
  • Europe and Asia-Pacific collectively account for nearly under 45% share in 2022, with Asia-pacific holding over 29% share in the same year.
  • The rest of the world, including Latin America, The Middle East, and Africa, contributes the remainder to the demand for air taxi.

The rising need for efficient and time-saving transportation solutions in congested urban areas and advancements in technology drive the market. However, the market is restrained by Airspace management and integration with existing aviation systems.

In the United Kingdom, the air taxi sector is expanding for a number of reasons. The first is that improvements in electric and autonomous aviation technologies have increased the viability and allure of urban air travel. These technologies could offer effective and environmentally friendly mobility options, easing traffic and lowering emissions in crowded places like London. The growth of the air taxi sector has received backing from the UK government. They have established goals for zero-emission aircraft by 2050 and started programs to promote clean transportation. This assistance comes in the form of financing for research and development, the creation of regulatory frameworks, and infrastructure planning.

In the United States, the air taxi industry is expanding for a number of reasons. Firstly, new opportunities for urban air mobility have been made possible by developments in electric and autonomous aircraft technologies. These technologies have the potential to create effective, economical, and environmentally friendly transportation solutions, which are in line with the expanding need for cutting-edge, sustainable mobility solutions. In particular, the technology and aviation industries benefit from a vibrant entrepreneurial and innovative culture in the United States. This promotes a climate that is favorable for the development and growth of the air taxi industry, luring new businesses and investors to the market and fostering its growth.

 Need for efficient and time-saving transportation solutions

A significant market driver of the air taxi market is the increasing need for efficient and time-saving transportation solutions in congested urban areas. Rapid urbanization and population growth have led to a rise in traffic congestion, resulting in longer travel times and decreased productivity. As a result, there is a growing demand for alternative modes of transportation that can bypass ground traffic and provide quicker point-to-point travel.

Air taxis aim to address this challenge by offering a faster and more convenient mode of transportation. These vehicles have the potential to significantly reduce travel times, especially for short-distance trips within urban or suburban areas. By utilizing vertical takeoff and landing capabilities, air taxis can bypass traditional ground-based transportation infrastructure, such as roads and bridges, and provide a direct flight path to the destination. This can lead to reduced commute times, increased productivity, and improved overall mobility for passengers.

Advancements in technology

A significant driver of the air taxi market is advancements in technology, particularly in the areas of electric propulsion, autonomous flight, and digital connectivity. The development of electric propulsion systems has opened up new possibilities for air taxis. Electric or hybrid-electric aircraft offer several advantages, including lower operating costs, reduced environmental impact, and quieter operations. Autonomous technologies, such as artificial intelligence, sensors, and advanced flight control systems, enable air taxis to operate with minimal human intervention. This can enhance safety, reduce pilot workload, and potentially enable cost-effective, on-demand air taxi services. The rise of digital connectivity facilitates real-time communication between passengers, air taxi operators, and other stakeholders, making air taxi services more accessible and user-friendly.

Airspace management and Integration with existing Aviation Systems

Integrating air taxis into existing airspace is a complex challenge. Air traffic control systems and procedures are primarily designed for commercial airlines and traditional general aviation. Accommodating numerous low-altitude air taxis operating in urban areas requires the development of new air traffic management systems and procedures to ensure safe and efficient operations. This includes managing the flow of air taxi traffic, maintaining separation between aircraft, and integrating them seamlessly with other aircraft in the airspace. Overcoming airspace management challenges is crucial for ensuring the safe and efficient operation of air taxis while minimizing conflicts with other airspace users. Collaboration between industry players, governments, and regulatory bodies is essential to develop the necessary infrastructure and regulatory frameworks to support the integration of air taxis into existing aviation systems.

Sustainability and The Need to Reduce Greenhouse Gas Emissions in Transportation

With the growing awareness of climate change and the environmental impact of transportation, there is a strong push for cleaner and more sustainable modes of transportation. Air taxis powered by electric or hybrid-electric propulsion systems have the potential to significantly reduce carbon emissions compared to traditional internal combustion engine-powered vehicles. As a result, governments, regulatory bodies, and consumers are increasingly interested in supporting and adopting environmentally friendly transportation options like air taxis. Governments and regulatory authorities, to encourage the development and adoption of air taxis, are introducing supportive regulations and frameworks in some regions. These regulations may include provisions for certification, safety standards, air traffic management, and urban infrastructure development. Such regulatory support can facilitate market growth and create a conducive environment for air taxi operations. Many companies, particularly in the tech and transportation sectors, are incorporating sustainability goals into their corporate strategies. As part of these efforts, they are exploring partnerships and investments in air taxi companies and technologies. By incorporating air taxis into their transportation offerings, companies can demonstrate their commitment to reducing their carbon footprint and supporting sustainable mobility solutions.

Competitive Landscape

Key Players

The Air Taxi Market is highly competitive, with the presence of several key players. Some of the major players in the market and their market share are as follows:

In March 2022, NetJets signed a Memorandum of Understanding (MoU) with Lilium NV for a proposed strategic partnership. The agreement also allows NetJets the right to purchase up to 150 Lilium aircraft.

In May 2021, Boeing-backed startup Wisk Aero made its first deal for the operation of Air taxis in the United States. Wisk partnered with Blade Urban Air Mobility Inc., under which Wisk will deliver up to 30 eVTOL aircraft to the UAM company.

Shape Your Report to Specific Countries or Regions & Enjoy 30% Off!

Summary of Key Findings.

  • The increasing need for efficient and time-saving transportation solutions in congested urban areas and advancements in technology are major drivers of market growth.
  • The Air Taxi Market is segmented by range, mode of operation, type and region.
  • The piloted mode of operation is the leading segment of the air taxi market with a significant market share.
  • Airspace management and integration with existing aviation systems is a major challenge faced by the market.
  • The USA holds a dominant position in the market with a significant share as a result of a growing number of air taxi companies.

Future Outlook

  • The Asia-Pacific region has shown promising growth potential for the air taxi market, with companies like EHang, Hyundai, and SkyDrive conducting test flights and exploring partnerships with local governments and transportation authorities.
  • Collaboration between industry players, governments, and regulatory bodies is essential to develop the necessary infrastructure and regulatory frameworks to support the integration of air taxis into existing aviation systems.
  • Introducing supportive regulations and frameworks can facilitate market growth and create a conducive environment for air taxi operations.
  • .The rise of digital connectivity facilitates real-time communication between passengers, air taxi operators, and other stakeholders, making air taxi services more accessible and user-friendly.

Segmentation

By Range

  • Intercity (100 to 400 km)
  • Intercity (20 to 100 km)

By mode of operation

  • Optionally piloted
  • piloted

By type

  • Air taxi platform services
  • Air taxi MRO services
  • Air taxi pilot training services

By Region

  • North America
    • United States
    • Canada
  • Asia-Pacific
    • China
    • Japan
    • India
    • South Korea
    • Australia
    • Indonesia
    • Others
  • Europe
    • Germany
    • France
    • United Kingdom
    • Italy
    • Spain
    • Russia
    • Others
  • Latin America
    • Brazil
    • Mexico
    • Others
  • Middle East and Africa

1. Preface
1.1. Report Description
1.1.1. Purpose of the Report
1.1.2. Target Audience
1.1.3. USP and Key Offerings
1.2. Research Scope
1.3. Research Methodology
1.3.1. Phase I – Secondary Research
1.3.2. Phase II – Data Modelling
1.3.2.1. Company Share Analysis Model
1.3.2.2. Revenue Based Modelling
1.3.3. Phase III – Primary Research
1.3.4. Research Limitations
1.3.5. Assumptions
1.4. Market Introduction
1.5. Market Research Scope

2. Executive Summary
2.1. Market Snapshot: Global Air Taxi Market
2.2. Global Air Taxi Market, By Range
2.3. Global Air Taxi Market, By Mode of operation
2.4. Global Air Taxi Market, By Type
2.5. Global Air Taxi Market, By Region

3. Market Dynamics & Factors Analysis
3.1. Introduction
3.1.1. Global Air Taxi Market Value, 2017-2030, (US$ Bn)
3.1.2. Y-o-Y Growth Trend Analysis
3.2. Market Dynamics
3.2.1. Market Drivers
3.2.1.1. Driver 1
3.2.1.2. Driver 2
3.2.1.3. Driver 3
3.2.2. Market Restraints
3.2.2.1. Restraint 1
3.2.2.2. Restraint 2
3.2.3. Market Opportunities
3.2.3.1. Opportunity 1
3.2.3.2. Opportunity 2
3.2.4. Major Industry Challenges
3.2.4.1. Challenge 1
3.2.4.2. Challenge 2
3.3. Growth and Development Patterns
3.4. Investment Feasibility Analysis
3.5. Market Opportunity Analysis
3.5.1. Range
3.5.2. Mode of operation
3.5.3. Type
3.5.4. Geography

4. Premium Insights
4.1. STAR (Situation, Task, Action, Results) Analysis
4.2. Porter’s Five Forces Analysis
4.2.1. Threat of New Entrants
4.2.2. Bargaining Power of Buyers/Consumers
4.2.3. Bargaining Power of Suppliers
4.2.4. Threat of Substitute types
4.2.5. Intensity of Competitive Rivalry
4.3. Key Market Trends
4.3.1. Demand Side Trends
4.3.2. Supply Side Trends
4.4. Value Chain Analysis
4.5. Technology Analysis
4.6. Analysis and Recommendations
4.7. Marketing Strategy Analysis
4.7.1. Direct Marketing
4.7.2. Indirect Marketing
4.7.3. Marketing Channel Development Trend

5. Market Positioning of Key Players, 2022
5.1. Company market share of key players, 2022
5.2. Competitive Benchmarking
5.3. Market Positioning of Key Vendors
5.4. Geographical Presence Analysis
5.5. Major Strategies Adopted by Key Players
5.5.1. Key Strategies Analysis
5.5.2. Mergers and Acquisitions
5.5.3. Partnerships
5.5.4. Product Launch
5.5.5. Geographical Expansion
5.5.6. Others

6. Economic Impact Analysis
6.1. Recession Impact
6.1.1. North America
6.1.2. Europe
6.1.3. Asia Pacific
6.1.4. Latin America
6.1.5. Middle East and Africa
6.2. Ukraine-Russia War Impact
6.2.1. North America
6.2.2. Europe
6.2.3. Asia Pacific
6.2.4. Latin America
6.2.5. Middle East and Africa
6.3. COVID-19 Impact Analysis
6.3.1. North America
6.3.2. Europe
6.3.3. Asia Pacific
6.3.4. Latin America
6.3.5. Middle East and Africa

7. Global Air Taxi Market, By Range
7.1. Global Air Taxi Market Overview, by Range
7.1.1. Global Air Taxi Market Revenue Share, By Range, 2022 Vs 2030 (in %)
7.2. Intercity (100 Kilometers to 400 Kilometers)
7.2.1. Global Air Taxi Market, By Region, 2017-2030 (US$ Bn)
7.3. Intercity (20 Kilometers to 100 Kilometers)
7.3.1. Global Air Taxi Market, By Region, 2017-2030 (US$ Bn)

8. Global Air Taxi Market, by Mode of operation, 2017-2030 (US$ Bn)
8.1. Global Air Taxi Market Overview, by Mode of operation
8.1.1. Global Air Taxi Market, By Mode of operation, 2022 vs 2030 (in%)
8.2. Optionally piloted
8.2.1. Global Air Taxi Market, By Region, 2017-2030 (US$ Bn)
8.3. Piloted
8.3.1. Global Air Taxi Market, By Region, 2017-2030 (US$ Bn)

9. Global Air Taxi Market, By Type
9.1. Global Air Taxi Market Overview, by Type
9.1.1. Global Air Taxi Market, By Type, 2022 vs 2030 (in %)
9.2. Air Taxi Platforms Services
9.2.1. Global Air Taxi Market, By Region, 2017-2030 (US$ Bn)
9.3. Air Taxi MRO Services
9.3.1. Global Air Taxi Market, By Region, 2017-2030 (US$ Bn)
9.4. Air Taxi Pilot Training Services
9.4.1. Global Air Taxi Market, By Region, 2017-2030 (US$ Bn)

10. Global Air Taxi Market, By Region
10.1. Global Air Taxi Market Overview, by Region
10.1.1. Global Air Taxi Market, By Region, 2022 vs 2030 (in%)
10.2. Range
10.2.1. Global Air Taxi Market, By Range, 2017-2030 (US$ Bn)
10.3. Mode of operation
10.3.1. Global Air Taxi Market, By Mode of operation, 2017-2030 (US$ Bn)
10.4. Type
10.4.1. Global Air Taxi Market, By Type, 2017-2030 (US$ Bn)

11. North America Air Taxi Market Analysis
11.1. North America Air Taxi Market, by Range, 2017-2030(US$ Bn)
11.1.1. Overview
11.1.2. SRC Analysis
11.2. North America Air Taxi Market, by Mode of operation, 2017-2030(US$ Bn)
11.2.1. Overview
11.2.2. SRC Analysis
11.3. North America Air Taxi Market, by Type, 2017-2030(US$ Bn)
11.3.1. Overview
11.3.2. SRC Analysis
11.4. North America Air Taxi Market, by Country, 2017-2030 (US$ Bn)
11.4.1. North America Air Taxi Market, by Country, 2022 Vs 2030 (in%)
11.4.2. U.S.
11.4.2.1. U.S. Air Taxi Market Estimates and Forecast, 2017-2030 (US$ Bn)
11.4.2.2. U.S. Air Taxi, By Range, 2017-2030 (US$ Bn)
11.4.2.3. U.S. Air Taxi, By Mode of operation, 2017-2030 (US$ Bn)
11.4.2.4. U.S. Air Taxi, By Type, 2017-2030 (US$ Bn)
11.4.3. Canada
11.4.3.1. Canada Air Taxi Market Estimates and Forecast, 2017-2030 (US$ Bn)
11.4.3.2. Canada Air Taxi, By Range, 2017-2030 (US$ Bn)
11.4.3.3. Canada Air Taxi, By Mode of operation, 2017-2030 (US$ Bn)
11.4.3.4. Canada Air Taxi, By Type, 2017-2030 (US$ Bn)
11.4.4. Mexico
11.4.4.1. Mexico Air Taxi Market Estimates and Forecast, 2017-2030 (US$ Bn)
11.4.4.2. Mexico Air Taxi, By Range, 2017-2030 (US$ Bn)
11.4.4.3. Mexico Air Taxi, By Mode of operation, 2017-2030 (US$ Bn)
11.4.4.4. Mexico Air Taxi, By Type, 2017-2030 (US$ Bn)

12. Europe Air Taxi Market Analysis
12.1. Europe Air Taxi Market, by Range, 2017-2030(US$ Bn)
12.1.1. Overview
12.1.2. SRC Analysis
12.2. Europe Air Taxi Market, by Mode of operation, 2017-2030(US$ Bn)
12.2.1. Overview
12.2.2. SRC Analysis
12.3. Europe Air Taxi Market, by Type, 2017-2030(US$ Bn)
12.3.1. Overview
12.3.2. SRC Analysis
12.4. Europe Air Taxi Market, by region, 2017-2030 (US$ Bn)
12.4.1. Europe Air Taxi Market, by Country, 2022 Vs 2030 (in%)
12.4.2. Germany
12.4.2.1. Germany Air Taxi Market Estimates and Forecast, 2017-2030 (US$ Bn)
12.4.2.2. Germany Air Taxi, By Range, 2017-2030 (US$ Bn)
12.4.2.3. Germany Air Taxi, By Mode of operation, 2017-2030 (US$ Bn)
12.4.2.4. Germany Air Taxi, By Type, 2017-2030 (US$ Bn)
12.4.3. France
12.4.3.1. France Air Taxi Market Estimates and Forecast, 2017-2030 (US$ Bn)
12.4.3.2. France Air Taxi, By Range, 2017-2030 (US$ Bn)
12.4.3.3. France Air Taxi, By Mode of operation, 2017-2030 (US$ Bn)
12.4.3.4. France Air Taxi, By Type, 2017-2030 (US$ Bn)
12.4.4. UK
12.4.4.1. UK Air Taxi Market Estimates and Forecast, 2017-2030 (US$ Bn)
12.4.4.2. UK Air Taxi, By Range, 2017-2030 (US$ Bn)
12.4.4.3. UK Air Taxi, By Mode of operation, 2017-2030 (US$ Bn)
12.4.4.4. UK Air Taxi, By Type, 2017-2030 (US$ Bn)
12.4.5. Italy
12.4.5.1. Italy Air Taxi Market Estimates and Forecast, 2017-2030 (US$ Bn)
12.4.5.2. Italy Air Taxi, By Range, 2017-2030 (US$ Bn)
12.4.5.3. Italy Air Taxi, By Mode of operation, 2017-2030 (US$ Bn)
12.4.5.4. Italy Air Taxi, By Type, 2017-2030 (US$ Bn)
12.4.6. Spain
12.4.6.1. Spain Air Taxi Market Estimates and Forecast, 2017-2030 (US$ Bn)
12.4.6.2. Spain Air Taxi, By Range, 2017-2030 (US$ Bn)
12.4.6.3. Spain Air Taxi, By Mode of operation, 2017-2030 (US$ Bn)
12.4.6.4. Spain Air Taxi, By Type, 2017-2030 (US$ Bn)
12.4.7. Rest of Europe
12.4.7.1. Rest of Europe Air Taxi Market Estimates and Forecast, 2017-2030 (US$ Bn)
12.4.7.2. Rest of Europe Air Taxi, By Range, 2017-2030 (US$ Bn)
12.4.7.3. Rest of Europe Air Taxi, By Mode of operation, 2017-2030 (US$ Bn)
12.4.7.4. Rest of Europe Air Taxi, By Type, 2017-2030 (US$ Bn)

13. Asia Pacific Air Taxi Market Analysis
13.1. Asia Pacific Air Taxi Market, by Range, 2017-2030(US$ Bn)
13.1.1. Overview
13.1.2. SRC Analysis
13.2. Asia Pacific Air Taxi Market, by Mode of operation, 2017-2030(US$ Bn)
13.2.1. Overview
13.2.2. SRC Analysis
13.3. Asia Pacific Air Taxi Market, by Type, 2017-2030(US$ Bn)
13.3.1. Overview
13.3.2. SRC Analysis
13.4. Asia Pacific Air Taxi Market, by Country, 2017-2030 (US$ Bn)
13.4.1. Asia Pacific Air Taxi Market, by Country, 2022 Vs 2030 (in%)
13.4.2. China
13.4.2.1. China Air Taxi Market Estimates and Forecast, 2017-2030 (US$ Bn)
13.4.2.2. China Air Taxi, By Range, 2017-2030 (US$ Bn)
13.4.2.3. China Air Taxi, By Mode of operation, 2017-2030 (US$ Bn)
13.4.2.4. China Air Taxi, By Type, 2017-2030 (US$ Bn)
13.4.3. Japan
13.4.3.1. Japan Air Taxi Market Estimates and Forecast, 2017-2030 (US$ Bn)
13.4.3.2. Japan Air Taxi, By Range, 2017-2030 (US$ Bn)
13.4.3.3. Japan Air Taxi, By Mode of operation, 2017-2030 (US$ Bn)
13.4.3.4. Japan Air Taxi, By Type, 2017-2030 (US$ Bn)
13.4.4. India
13.4.4.1. India Air Taxi Market Estimates and Forecast, 2017-2030 (US$ Bn)
13.4.4.2. India Air Taxi, By Range, 2017-2030 (US$ Bn)
13.4.4.3. India Air Taxi, By Mode of operation, 2017-2030 (US$ Bn)
13.4.4.4. India Air Taxi, By Type, 2017-2030 (US$ Bn)
13.4.5. South Korea
13.4.5.1. South Korea Air Taxi Market Estimates and Forecast, 2017-2030 (US$ Bn)
13.4.5.2. South Korea Air Taxi, By Range, 2017-2030 (US$ Bn)
13.4.5.3. South Korea Air Taxi, By Mode of operation, 2017-2030 (US$ Bn)
13.4.5.4. South Korea Air Taxi, By Type, 2017-2030 (US$ Bn)
13.4.6. South-East Asia
13.4.6.1. South-East Asia Air Taxi Market Estimates and Forecast, 2017-2030 (US$ Bn)
13.4.6.2. South-East Asia Air Taxi, By Range, 2017-2030 (US$ Bn)
13.4.6.3. South-East Asia Air Taxi, By Mode of operation, 2017-2030 (US$ Bn)
13.4.6.4. South-East Asia Air Taxi, By Type, 2017-2030 (US$ Bn)
13.4.7. Rest of Asia Pacific
13.4.7.1. Rest of Asia Pacific Air Taxi Market Estimates and Forecast, 2017-2030 (US$ Bn)
13.4.7.2. Rest of Asia Pacific Air Taxi, By Range, 2017-2030 (US$ Bn)
13.4.7.3. Rest of Asia Pacific Air Taxi, By Mode of operation, 2017-2030 (US$ Bn)
13.4.7.4. Rest of Asia Pacific Air Taxi, By Type, 2017-2030 (US$ Bn)

14. Latin America Air Taxi Market Analysis
14.1. Latin America Air Taxi Market, by Range, 2017-2030(US$ Bn)
14.1.1. Overview
14.1.2. SRC Analysis
14.2. Latin America Air Taxi Market, by Mode of operation, 2017-2030(US$ Bn)
14.2.1. Overview
14.2.2. SRC Analysis
14.3. Latin America Air Taxi Market, by Type, 2017-2030(US$ Bn)
14.3.1. Overview
14.3.2. SRC Analysis
14.4. Latin America Air Taxi Market, by Country, 2017-2030 (US$ Bn)
14.4.1. Latin America Air Taxi Market, by Country, 2022 Vs 2030 (in%)
14.4.2. Brazil
14.4.2.1. Brazil Air Taxi Market Estimates and Forecast, 2017-2030 (US$ Bn)
14.4.2.2. Brazil Air Taxi, By Range, 2017-2030 (US$ Bn)
14.4.2.3. Brazil Air Taxi, By Mode of operation, 2017-2030 (US$ Bn)
14.4.2.4. Brazil Air Taxi, By Type, 2017-2030 (US$ Bn)
14.4.3. Argentina
14.4.3.1. Argentina Air Taxi Market Estimates and Forecast, 2017-2030 (US$ Bn)
14.4.3.2. Argentina Air Taxi, By Range, 2017-2030 (US$ Bn)
14.4.3.3. Argentina Air Taxi, By Mode of operation, 2017-2030 (US$ Bn)
14.4.3.4. Argentina Air Taxi, By Type, 2017-2030 (US$ Bn)
14.4.4. Rest of Latin America
14.4.4.1. Rest of Latin America Air Taxi Market Estimates and Forecast, 2017-2030 (US$ Bn)
14.4.4.2. Rest of Latin America Air Taxi, By Range, 2017-2030 (US$ Bn)
14.4.4.3. Rest of Latin America Air Taxi, By Mode of operation, 2017-2030 (US$ Bn)
14.4.4.4. Rest of Latin America Air Taxi, By Type, 2017-2030 (US$ Bn)

15. Middle East and Africa Air Taxi Market Analysis
15.1. Middle East and Africa Air Taxi Market, by Range, 2017-2030(US$ Bn)
15.1.1. Overview
15.1.2. SRC Analysis
15.2. Middle East and Africa Air Taxi Market, by Mode of operation, 2017-2030(US$ Bn)
15.2.1. Overview
15.2.2. SRC Analysis
15.3. Middle East and Africa Air Taxi Market, by Type, 2017-2030(US$ Bn)
15.3.1. Overview
15.3.2. SRC Analysis
15.4. Middle East and Africa Air Taxi Market, by Country, 2017-2030 (US$ Bn)
15.4.1. Middle East and Africa Air Taxi Market, by Country, 2022 Vs 2030 (in%)
15.4.2. GCC Countries
15.4.2.1. GCC Countries Air Taxi Market Estimates and Forecast, 2017-2030 (US$ Bn)
15.4.2.2. GCC Countries Air Taxi, By Range, 2017-2030 (US$ Bn)
15.4.2.3. GCC Countries Air Taxi, By Mode of operation, 2017-2030 (US$ Bn)
15.4.2.4. GCC Countries Air Taxi, By Type, 2017-2030 (US$ Bn)
15.4.3. South Africa
15.4.3.1. South Africa Air Taxi Market Estimates and Forecast, 2017-2030 (US$ Bn)
15.4.3.2. South Africa Air Taxi, By Range, 2017-2030 (US$ Bn)
15.4.3.3. South Africa Air Taxi, By Mode of operation, 2017-2030 (US$ Bn)
15.4.3.4. South Africa Air Taxi, By Type, 2017-2030 (US$ Bn)
15.4.4. Rest of Middle East and Africa
15.4.4.1. Rest of Middle East and Africa Air Taxi Market Estimates and Forecast, 2017-2030 (US$ Bn)
15.4.4.2. Rest of Middle East and Africa Air Taxi, By Range, 2017-2030 (US$ Bn)
15.4.4.3. Rest of Middle East and Africa Air Taxi, By Mode of operation, 2017-2030 (US$ Bn)
15.4.4.4. Rest of Middle East and Africa Air Taxi, By Type, 2017-2030 (US$ Bn)


16. Company Profiles
16.1. Airbus SE
16.1.1. Company Overview
16.1.2. Product/Services Portfolio
16.1.3. Geographical Presence
16.1.4. Financial Summary
16.1.4.1. Market Revenue and Net Profit (2019-2022)
16.1.4.2. Business Segment Revenue Analysis
16.1.4.3. Geographical Revenue Analysis
16.2. ATP CO. LTD
16.3. TCI Co, Ltd
16.4. SHISEIDO COMPANY
16.5. AMORE PACIFIC CORPORATION
16.6. Textron Inc.
16.7. The Boeing Company
16.8. EHang Holdings Limited
16.9. Joby Aviation
16.10. Volocopter GmbH
16.11. Kitty Hawk Corporation
16.12. Hyundai Motor Company
16.13. Lilium GmbH
16.14. Jaunt Air Mobility LLC
16.15. Wisk Aero LLC


List of Figures
FIG. 1 Global Air Taxi Market: Research Methodology
FIG. 2 Market Size Estimation – Top Down & Bottom up Approach
FIG. 3 Global Air Taxi Market Segmentation
FIG. 4 Global Air Taxi Market, by Range, 2022 (US$ Bn)
FIG. 5 Global Air Taxi Market, by Mode of operation, 2022 (US$ Bn)
FIG. 6 Global Air Taxi Market, by Type, 2022 (US$ Bn)
FIG. 7 Global Air Taxi Market, by Geography, 2022 (US$ Bn)
FIG. 8 Attractive Investment Proposition, by Range, 2022
FIG. 9 Attractive Investment Proposition, by Mode of operation, 2022
FIG. 10 Attractive Investment Proposition, by Type, 2022
FIG. 11 Attractive Investment Proposition, by Geography, 2022
FIG. 12 Global Market Share Analysis of Key Air Taxi Market Manufacturers, 2022
FIG. 13 Global Market Positioning of Key Air Taxi Market Manufacturers, 2022
FIG. 14 Global Air Taxi Market Value Contribution, By Range, 2022 & 2030 (Value %)
FIG. 15 Global Air Taxi Market, by Intercity (100 Kilometers to 400 Kilometers), Value, 2017-2030 (US$ Bn)
FIG. 16 Global Air Taxi Market, by Intercity (20 Kilometers to 100 Kilometers), Value, 2017-2030 (US$ Bn)
FIG. 17 Global Air Taxi Market Value Contribution, By Mode of operation, 2022 & 2030 (Value %)
FIG. 18 Global Air Taxi Market, by Optionally piloted, Value, 2017-2030 (US$ Bn)
FIG. 19 Global Air Taxi Market, by Piloted, 2017-2030 (US$ Bn)
FIG. 20 Global Air Taxi Market Value Contribution, By Type, 2022 & 2030 (Value %)
FIG. 21 Global Air Taxi Market, by Air Taxi Platforms Services, Value, 2017-2030 (US$ Bn)
FIG. 22 Global Air Taxi Market, by Air Taxi MRO Services, Value, 2017-2030 (US$ Bn)
FIG. 23 Global Air Taxi Market, by Air Taxi Pilot Training Services, Value, 2017-2030 (US$ Bn)
FIG. 24 North America Air Taxi Market, 2017-2030 (US$ Bn)
FIG. 25 U.S. Air Taxi Market, 2017-2030 (US$ Bn)
FIG. 26 Canada Air Taxi Market, 2017-2030 (US$ Bn)
FIG. 27 Europe Air Taxi Market, 2017-2030 (US$ Bn)
FIG. 28 Germany Air Taxi Market, 2017-2030 (US$ Bn)
FIG. 29 France Air Taxi Market, 2017-2030 (US$ Bn)
FIG. 30 U.K. Air Taxi Market, 2017-2030 (US$ Bn)
FIG. 31 Italy Air Taxi Market, 2017-2030 (US$ Bn)
FIG. 32 Spain Air Taxi Market, 2017-2030 (US$ Bn)
FIG. 33 Rest of Europe Air Taxi Market, 2017-2030 (US$ Bn)
FIG. 34 Asia Pacific Air Taxi Market, 2017-2030 (US$ Bn)
FIG. 35 China Air Taxi Market, 2017-2030 (US$ Bn)
FIG. 36 Japan Air Taxi Market, 2017-2030 (US$ Bn)
FIG. 37 India Air Taxi Market, 2017-2030 (US$ Bn)
FIG. 38 South Korea Air Taxi Market, 2017-2030 (US$ Bn)
FIG. 39 South-East Asia Air Taxi Market, 2017-2030 (US$ Bn)
FIG. 40 Rest of Asia Pacific Air Taxi Market, 2017-2030 (US$ Bn)
FIG. 41 Latin America Air Taxi Market, 2017-2030 (US$ Bn)
FIG. 42 Brazil Air Taxi Market, 2017-2030 (US$ Bn)
FIG. 43 Mexico Air Taxi Market, 2017-2030 (US$ Bn)
FIG. 44 Rest of Latin America Air Taxi Market, 2017-2030 (US$ Bn)
FIG. 45 Middle East & Africa Air Taxi Market, 2017-2030 (US$ Bn)
FIG. 46 GCC Countries Air Taxi Market, 2017-2030 (US$ Bn)
FIG. 47 South Africa Air Taxi Market, 2017-2030 (US$ Bn)
FIG. 48 Rest of Middle East and Africa Air Taxi Market, 2017-2030 (US$ Bn)

List of Tables
TABLE 1 Market Snapshot: Global Air Taxi Market
TABLE 2 Global Air Taxi Market: Market Drivers Impact Analysis
TABLE 3 Global Air Taxi Market: Market Restraints Impact Analysis
TABLE 4 Global Air Taxi Market, by Competitive Benchmarking, 2022
TABLE 5 Global Air Taxi Market, by Geographical Presence Analysis, 2022
TABLE 6 Global Air Taxi Market, by Key Strategies Analysis, 2022
TABLE 7 Global Air Taxi Market, by Intercity (100 Kilometers to 400 Kilometers), By Region, 2017-2022 (US$ Bn)
TABLE 8 Global Air Taxi Market, by Intercity (100 Kilometers to 400 Kilometers), By Region, 2023-2030 (US$ Bn)
TABLE 9 Global Air Taxi Market, by Intercity (20 Kilometers to 100 Kilometers), By Region, 2017-2022 (US$ Bn)
TABLE 10 Global Air Taxi Market, by Intercity (20 Kilometers to 100 Kilometers), By Region, 2023-2030 (US$ Bn)
TABLE 11 Global Air Taxi Market, by Optionally piloted, By Region, 2017-2022 (US$ Bn)
TABLE 12 Global Air Taxi Market, by Optionally piloted, By Region, 2023-2030 (US$ Bn)
TABLE 13 Global Air Taxi Market, by Piloted, By Region, 2017-2022 (US$ Bn)
TABLE 14 Global Air Taxi Market, by Piloted, By Region, 2023-2030 (US$ Bn)
TABLE 15 Global Air Taxi Market, by Air Taxi Platforms Services, By Region, 2017-2022 (US$ Bn)
TABLE 16 Global Air Taxi Market, by Air Taxi Platforms Services, By Region, 2023-2030 (US$ Bn)
TABLE 17 Global Air Taxi Market, by Air Taxi MRO Services, By Region, 2017-2022 (US$ Bn)
TABLE 18 Global Air Taxi Market, by Air Taxi MRO Services, By Region, 2023-2030 (US$ Bn)
TABLE 19 Global Air Taxi Market, by Air Taxi Pilot Training Services, By Region, 2023-2030 (US$ Bn)
TABLE 20 Global Air Taxi Market, by Air Taxi Pilot Training Services, By Region, 2023-2030 (US$ Bn)
TABLE 21 Global Air Taxi Market, by Range, 2017-2022 (US$ Bn)
TABLE 22 Global Air Taxi Market, by Range, 2023-2030 (US$ Bn)
TABLE 23 Global Air Taxi Market, by Mode of operation, 2017-2022 (US$ Bn)
TABLE 24 Global Air Taxi Market, by Mode of operation, 2023-2030 (US$ Bn)
TABLE 25 Global Air Taxi Market, by Type, 2017-2022 (US$ Bn)
TABLE 26 Global Air Taxi Market, by Type, 2023-2030 (US$ Bn)
TABLE 27 Global Air Taxi Market, by Region, 2017-2022 (US$ Bn)
TABLE 28 Global Air Taxi Market, by Region, 2023-2030 (US$ Bn)
TABLE 29 North America Air Taxi Market, by Range, 2017-2022 (US$ Bn)
TABLE 30 North America Air Taxi Market, by Range, 2023-2030 (US$ Bn)
TABLE 31 North America Air Taxi Market, by Mode of operation, 2017-2022 (US$ Bn)
TABLE 32 North America Air Taxi Market, by Mode of operation, 2023-2030 (US$ Bn)
TABLE 33 North America Air Taxi Market, by Type, 2017-2022 (US$ Bn)
TABLE 34 North America Air Taxi Market, by Type, 2023-2030 (US$ Bn)
TABLE 35 North America Air Taxi Market, by Country, 2017-2022 (US$ Bn)
TABLE 36 North America Air Taxi Market, by Country, 2023-2030 (US$ Bn)
TABLE 37 United States Air Taxi Market, by Range, 2017-2022 (US$ Bn)
TABLE 38 United States Air Taxi Market, by Range, 2023-2030 (US$ Bn)
TABLE 39 United States Air Taxi Market, by Mode of operation, 2017-2022 (US$ Bn)
TABLE 40 United States Air Taxi Market, by Mode of operation, 2023-2030 (US$ Bn)
TABLE 41 United States Air Taxi Market, by Type, 2017-2022 (US$ Bn)
TABLE 42 United States Air Taxi Market, by Type, 2023-2030 (US$ Bn)
TABLE 43 Canada Air Taxi Market, by Range, 2017-2022 (US$ Bn)
TABLE 44 Canada Air Taxi Market, by Range, 2023-2030 (US$ Bn)
TABLE 45 Canada Air Taxi Market, by Mode of operation, 2017-2022 (US$ Bn)
TABLE 46 Canada Air Taxi Market, by Mode of operation, 2023-2030 (US$ Bn)
TABLE 47 Canada Air Taxi Market, by Type, 2017-2022 (US$ Bn)
TABLE 48 Canada Air Taxi Market, by Type, 2023-2030 (US$ Bn)
TABLE 49 Mexico Air Taxi Market, by Range, 2017-2022 (US$ Bn)
TABLE 50 Mexico Air Taxi Market, by Range, 2023-2030 (US$ Bn)
TABLE 51 Mexico Air Taxi Market, by Mode of operation, 2017-2022 (US$ Bn)
TABLE 52 Mexico Air Taxi Market, by Mode of operation, 2023-2030 (US$ Bn)
TABLE 53 Mexico Air Taxi Market, by Type, 2017-2022 (US$ Bn)
TABLE 54 Mexico Air Taxi Market, by Type, 2023-2030 (US$ Bn)
TABLE 55 Europe Air Taxi Market, by Range, 2017-2022 (US$ Bn)
TABLE 56 Europe Air Taxi Market, by Range, 2023-2030 (US$ Bn)
TABLE 57 Europe Air Taxi Market, by Mode of operation, 2017-2022 (US$ Bn)
TABLE 58 Europe Air Taxi Market, by Mode of operation, 2023-2030 (US$ Bn)
TABLE 59 Europe Air Taxi Market, by Type, 2017-2022 (US$ Bn)
TABLE 60 Europe Air Taxi Market, by Type, 2023-2030 (US$ Bn)
TABLE 61 Europe Air Taxi Market, by Country, 2017-2022 (US$ Bn)
TABLE 62 Europe Air Taxi Market, by Country, 2023-2030 (US$ Bn)
TABLE 63 Germany Air Taxi Market, by Range, 2017-2022 (US$ Bn)
TABLE 64 Germany Air Taxi Market, by Range, 2023-2030 (US$ Bn)
TABLE 65 Germany Air Taxi Market, by Mode of operation, 2017-2022 (US$ Bn)
TABLE 66 Germany Air Taxi Market, by Mode of operation, 2023-2030 (US$ Bn)
TABLE 67 Germany Air Taxi Market, by Type, 2017-2022 (US$ Bn)
TABLE 68 Germany Air Taxi Market, by Type, 2023-2030 (US$ Bn)
TABLE 69 France Air Taxi Market, by Range, 2017-2022 (US$ Bn)
TABLE 70 France Air Taxi Market, by Range, 2023-2030 (US$ Bn)
TABLE 71 France Air Taxi Market, by Mode of operation, 2017-2022 (US$ Bn)
TABLE 72 France Air Taxi Market, by Mode of operation, 2023-2030 (US$ Bn)
TABLE 73 France Air Taxi Market, by Type, 2017-2022 (US$ Bn)
TABLE 74 France Air Taxi Market, by Type, 2023-2030 (US$ Bn)
TABLE 75 United Kingdom Air Taxi Market, by Range, 2017-2022 (US$ Bn)
TABLE 76 United Kingdom Air Taxi Market, by Range, 2023-2030 (US$ Bn)
TABLE 77 United Kingdom Air Taxi Market, by Mode of operation, 2017-2022 (US$ Bn)
TABLE 78 United Kingdom Air Taxi Market, by Mode of operation, 2023-2030 (US$ Bn)
TABLE 79 United Kingdom Air Taxi Market, by Type, 2017-2022 (US$ Bn)
TABLE 80 United Kingdom Air Taxi Market, by Type, 2023-2030 (US$ Bn)
TABLE 81 Italy Air Taxi Market, by Range, 2017-2022 (US$ Bn)
TABLE 82 Italy Air Taxi Market, by Range, 2023-2030 (US$ Bn)
TABLE 83 Italy Air Taxi Market, by Mode of operation, 2017-2022 (US$ Bn)
TABLE 84 Italy Air Taxi Market, by Mode of operation, 2023-2030 (US$ Bn)
TABLE 85 Italy Air Taxi Market, by Type, 2017-2022 (US$ Bn)
TABLE 86 Italy Air Taxi Market, by Type, 2023-2030 (US$ Bn)
TABLE 87 Spain Air Taxi Market, by Range, 2017-2022 (US$ Bn)
TABLE 88 Spain Air Taxi Market, by Range, 2023-2030 (US$ Bn)
TABLE 89 Spain Air Taxi Market, by Mode of operation, 2017-2022 (US$ Bn)
TABLE 90 Spain Air Taxi Market, by Mode of operation, 2023-2030 (US$ Bn)
TABLE 91 Spain Air Taxi Market, by Type, 2017-2022 (US$ Bn)
TABLE 92 Spain Air Taxi Market, by Type, 2023-2030 (US$ Bn)
TABLE 93 Rest of Europe Air Taxi Market, by Range, 2017-2022 (US$ Bn)
TABLE 94 Rest of Europe Air Taxi Market, by Range, 2023-2030 (US$ Bn)
TABLE 95 Rest of Europe Air Taxi Market, by Mode of operation, 2017-2022 (US$ Bn)
TABLE 96 Rest of Europe Air Taxi Market, by Type, 2023-2030 (US$ Bn)
TABLE 97 Rest of Europe Air Taxi Market, by Type, 2017-2022 (US$ Bn)
TABLE 98 Rest of Europe Air Taxi Market, by Mode of operation, 2023-2030 (US$ Bn)
TABLE 99 Asia Pacific Air Taxi Market, by Range, 2017-2022 (US$ Bn)
TABLE 100 Asia Pacific Air Taxi Market, by Range, 2023-2030 (US$ Bn)
TABLE 101 Asia Pacific Air Taxi Market, by Mode of operation, 2017-2022 (US$ Bn)
TABLE 102 Asia Pacific Air Taxi Market, by Mode of operation, 2023-2030 (US$ Bn)
TABLE 103 Asia Pacific Air Taxi Market, by Type, 2017-2022 (US$ Bn)
TABLE 104 Asia Pacific Air Taxi Market, by Type, 2023-2030 (US$ Bn)
TABLE 105 Asia Pacific Air Taxi Market, by Country, 2017-2022 (US$ Bn)
TABLE 106 Asia Pacific Air Taxi Market, by Country, 2023-2030 (US$ Bn)
TABLE 107 China Air Taxi Market, by Range, 2017-2022 (US$ Bn)
TABLE 108 China Air Taxi Market, by Range, 2023-2030 (US$ Bn)
TABLE 109 China Air Taxi Market, by Mode of operation, 2017-2022 (US$ Bn)
TABLE 110 China Air Taxi Market, by Mode of operation, 2023-2030 (US$ Bn)
TABLE 111 China Air Taxi Market, by Type, 2017-2022 (US$ Bn)
TABLE 112 China Air Taxi Market, by Type, 2023-2030 (US$ Bn)
TABLE 113 Japan Air Taxi Market, by Range, 2017-2022 (US$ Bn)
TABLE 114 Japan Air Taxi Market, by Range, 2023-2030 (US$ Bn)
TABLE 115 Japan Air Taxi Market, by Mode of operation, 2017-2022 (US$ Bn)
TABLE 116 Japan Air Taxi Market, by Mode of operation, 2023-2030 (US$ Bn)
TABLE 117 Japan Air Taxi Market, by Type, 2017-2022 (US$ Bn)
TABLE 118 Japan Air Taxi Market, by Type, 2023-2030 (US$ Bn)
TABLE 119 India Air Taxi Market, by Range, 2017-2022 (US$ Bn)
TABLE 120 India Air Taxi Market, by Range, 2023-2030 (US$ Bn)
TABLE 121 India Air Taxi Market, by Mode of operation, 2017-2022 (US$ Bn)
TABLE 122 India Air Taxi Market, by Mode of operation, 2023-2030 (US$ Bn)
TABLE 123 India Air Taxi Market, by Type, 2017-2022 (US$ Bn)
TABLE 124 India Air Taxi Market, by Type, 2023-2030 (US$ Bn)
TABLE 125 South Korea Air Taxi Market, by Range, 2017-2022 (US$ Bn)
TABLE 126 South Korea Air Taxi Market, by Range, 2023-2030 (US$ Bn)
TABLE 127 South Korea Air Taxi Market, by Mode of operation, 2017-2022 (US$ Bn)
TABLE 128 South Korea Air Taxi Market, by Mode of operation, 2023-2030 (US$ Bn)
TABLE 129 South Korea Air Taxi Market, by Type, 2017-2022 (US$ Bn)
TABLE 130 South Korea Air Taxi Market, by Type, 2023-2030 (US$ Bn)
TABLE 131 South-East Asia Air Taxi Market, by Range, 2017-2022 (US$ Bn)
TABLE 132 South-East Asia Air Taxi Market, by Range, 2023-2030 (US$ Bn)
TABLE 133 South-East Asia Air Taxi Market, by Mode of operation, 2017-2022 (US$ Bn)
TABLE 134 South-East Asia Air Taxi Market, by Mode of operation, 2023-2030 (US$ Bn)
TABLE 135 South-East Asia Air Taxi Market, by Type, 2017-2022 (US$ Bn)
TABLE 136 South-East Asia Air Taxi Market, by Type, 2023-2030 (US$ Bn)
TABLE 137 Rest of Asia Pacific Air Taxi Market, by Range, 2017-2022 (US$ Bn)
TABLE 138 Rest of Asia Pacific Air Taxi Market, by Range, 2023-2030 (US$ Bn)
TABLE 139 Rest of Asia Pacific Air Taxi Market, by Mode of operation, 2017-2022 (US$ Bn)
TABLE 140 Rest of Asia Pacific Air Taxi Market, by Mode of operation, 2023-2030 (US$ Bn)
TABLE 141 Rest of Asia Pacific Air Taxi Market, by Type, 2017-2022 (US$ Bn)
TABLE 142 Rest of Asia Pacific Air Taxi Market, by Type, 2023-2030 (US$ Bn)
TABLE 143 Latin America Air Taxi Market, by Range, 2017-2022 (US$ Bn)
TABLE 144 Latin America Air Taxi Market, by Range, 2023-2030 (US$ Bn)
TABLE 145 Latin America Air Taxi Market, by Mode of operation, 2017-2022 (US$ Bn)
TABLE 146 Latin America Air Taxi Market, by Mode of operation, 2023-2030 (US$ Bn)
TABLE 147 Latin America Air Taxi Market, by Type, 2017-2022 (US$ Bn)
TABLE 148 Latin America Air Taxi Market, by Type, 2023-2030 (US$ Bn)
TABLE 149 Latin America Air Taxi Market, by Country, 2017-2022 (US$ Bn)
TABLE 150 Latin America Air Taxi Market, by Country, 2023-2030 (US$ Bn)
TABLE 151 Brazil Air Taxi Market, by Range, 2017-2022 (US$ Bn)
TABLE 152 Brazil Air Taxi Market, by Range, 2023-2030 (US$ Bn)
TABLE 153 Brazil Air Taxi Market, by Mode of operation, 2017-2022 (US$ Bn)
TABLE 154 Brazil Air Taxi Market, by Mode of operation, 2023-2030 (US$ Bn)
TABLE 155 Brazil Air Taxi Market, by Type, 2017-2022 (US$ Bn)
TABLE 156 Brazil Air Taxi Market, by Type, 2023-2030 (US$ Bn)
TABLE 157 Argentina Air Taxi Market, by Range, 2017-2022 (US$ Bn)
TABLE 158 Argentina Air Taxi Market, by Range, 2023-2030 (US$ Bn)
TABLE 159 Argentina Air Taxi Market, by Mode of operation, 2017-2022 (US$ Bn)
TABLE 160 Argentina Air Taxi Market, by Mode of operation, 2023-2030 (US$ Bn)
TABLE 161 Argentina Air Taxi Market, by Type, 2017-2022 (US$ Bn)
TABLE 162 Argentina Air Taxi Market, by Type, 2023-2030 (US$ Bn)
TABLE 163 Rest of Latin America Air Taxi Market, by Range, 2017-2022 (US$ Bn)
TABLE 164 Rest of Latin America Air Taxi Market, by Range, 2023-2030 (US$ Bn)
TABLE 165 Rest of Latin America Air Taxi Market, by Mode of operation, 2017-2022 (US$ Bn)
TABLE 166 Rest of Latin America Air Taxi Market, by Mode of operation, 2023-2030 (US$ Bn)
TABLE 167 Rest of Latin America Air Taxi Market, by Type, 2017-2022 (US$ Bn)
TABLE 168 Rest of Latin America Air Taxi Market, by Type, 2023-2030 (US$ Bn)
TABLE 169 Middle East and Africa Air Taxi Market, by Range, 2017-2022 (US$ Bn)
TABLE 170 Middle East and Africa Air Taxi Market, by Range, 2023-2030 (US$ Bn)
TABLE 171 Middle East and Africa Air Taxi Market, by Mode of operation, 2017-2022 (US$ Bn)
TABLE 172 Middle East and Africa Air Taxi Market, by Mode of operation, 2023-2030 (US$ Bn)
TABLE 173 Middle East and Africa Air Taxi Market, by Type, 2017-2022 (US$ Bn)
TABLE 174 Middle East and Africa Air Taxi Market, by Type, 2023-2030 (US$ Bn)
TABLE 175 Middle East and Africa Air Taxi Market, by Country, 2017-2022 (US$ Bn)
TABLE 176 Middle East and Africa Air Taxi Market, by Country, 2023-2030 (US$ Bn)
TABLE 177 GCC Countries Air Taxi Market, by Range, 2017-2022 (US$ Bn)
TABLE 178 GCC Countries Air Taxi Market, by Range, 2023-2030 (US$ Bn)
TABLE 179 GCC Countries Air Taxi Market, by Mode of operation, 2017-2022 (US$ Bn)
TABLE 180 GCC Countries Air Taxi Market, by Mode of operation, 2023-2030 (US$ Bn)
TABLE 181 GCC Countries Air Taxi Market, by Type, 2017-2022 (US$ Bn)
TABLE 182 GCC Countries Air Taxi Market, by Type, 2023-2030 (US$ Bn)
TABLE 183 South Africa Air Taxi Market, by Range, 2017-2022 (US$ Bn)
TABLE 184 South Africa Air Taxi Market, by Range, 2023-2030 (US$ Bn)
TABLE 185 South Africa Air Taxi Market, by Mode of operation, 2017-2022 (US$ Bn)
TABLE 186 South Africa Air Taxi Market, by Mode of operation, 2023-2030 (US$ Bn)
TABLE 187 South Africa Air Taxi Market, by Type, 2017-2022 (US$ Bn)
TABLE 188 South Africa Air Taxi Market, by Type, 2023-2030 (US$ Bn)
TABLE 189 Rest of Middle East and Africa Air Taxi Market, by Range, 2017-2022 (US$ Bn)
TABLE 190 Rest of Middle East and Africa Air Taxi Market, by Range, 2023-2030 (US$ Bn)
TABLE 191 Rest of Middle East and Africa Air Taxi Market, by Mode of operation, 2017-2022 (US$ Bn)
TABLE 192 Rest of Middle East and Africa Air Taxi Market, by Mode of operation, 2023-2030 (US$ Bn)
TABLE 193 Rest of Middle East and Africa Air Taxi Market, by Type, 2017-2022 (US$ Bn)
TABLE 194 Rest of Middle East and Africa Air Taxi Market, by Type, 2023-2030 (US$ Bn)

Frequently Asked Questions

What is the current size of The Air Taxi Market?

The Air Taxi Market was valued at USD 1.3 billion in 2022.

What is the expected growth rate of The Air Taxi Market between 2023 and 2030?

The Air Taxi Market  is expected to grow at a CAGR of 25.58% between 2023 and 2030, reaching USD 6.40 billion in 2030.

Which segment is leading the market share in terms of mode of operation?

The piloted segment is the leading segment by mode of operation, holding a significant share in terms of value.

Which region is fuelling the growth of The Air Taxi Market?

North America is fuelling the growth of the air taxi market , with a significant share in 2022.

Who are the major players in The Air Taxi Market ?

The top players include CSL Behring, Ferring Pharmaceuticals,Grifols SA, Octapharma AG, Pfizer Inc., Sanofi SA, Takeda Pharmaceutical Company Ltd, Bio Products Laboratory Ltd.

What are the major market drivers of The Air Taxi Market?

Increasing need for efficient and time-saving transportation solutions in congested urban areas and advancement in technology are major drivers of market growth.

What is the major market restraint of The Air Taxi Market?

Airspace management and integration with existing aviation systems is a major restrain faced by the market.

What is the major market opportunity of the Air Taxi Market??

The rising awareness of climate change and the environmental impact of transportation offers a significant growth opportunity for The Air Taxi Market.

What are the different modes of operation  of The Air Taxi Market?

The modes of operation of the air taxi market are optionally piloted and piloted.

What are the different service types of The Air Taxi Market ?

The different service types of the air taxi market are air taxi platform services, air taxi MRO services, and air taxi pilot training services.

Automatic Number Plate Recognition (ANPR) System Market

Published:
Report ID: 2932

Automotive Sensor Cleaning Systems Market

Published:
Report ID: 20405

Off-Highway Vehicle Engine Market

Published:
Report ID: 36969

Crane Market

Published:
Report ID: 36945

Automotive Rear-View Mirror Market

Published:
Report ID: 36709

Airless Tires Market

Published:
Report ID: 1175

Singapore Electric Vehicle (EV) Market

Published:
Report ID: 35964

Asia Pacific Automotive Infotainment Systems Market

Published:
Report ID: 35958

Peer-To-Peer Electric Vehicle Charging Market

Published:
Report ID: 9059

Japan Tire Market

Published:
Report ID: 32634

Automotive Steel Wheels Market

Published:
Report ID: 35559

Automotive Alloy Wheels Market

Published:
Report ID: 35549

Purchase Options

$2999
Delivery Format: Excel.
$4999
Designed for the individual purchaser.
$6999
Users located at a single corporate site or regional office.
$7999
Allowed for unlimited sharing globally within one company.
Smallform of Sample request

Have a question?

User Profile

Don’t settle for less – trust Mitul to help you find the best solution.

Report delivery within 24 to 48 hours

– Other Info –

What people say?-

User Review

I am very impressed with the information in this report. The author clearly did their research when they came up with this product and it has already given me a lot of ideas.

Jana Schmidt
CEDAR CX Technologies

– Connect with us –

Phone

+91 6232 49 3207


support

24/7 Research Support


sales@credenceresearch.com

– Research Methodology –

Going beyond the basics: advanced techniques in research methodology

– Trusted By –

Pepshi, LG, Nestle
Motorola, Honeywell, Johnson and johnson
LG Chem, SIEMENS, Pfizer
Unilever, Samsonite, QIAGEN