
Market Overview:
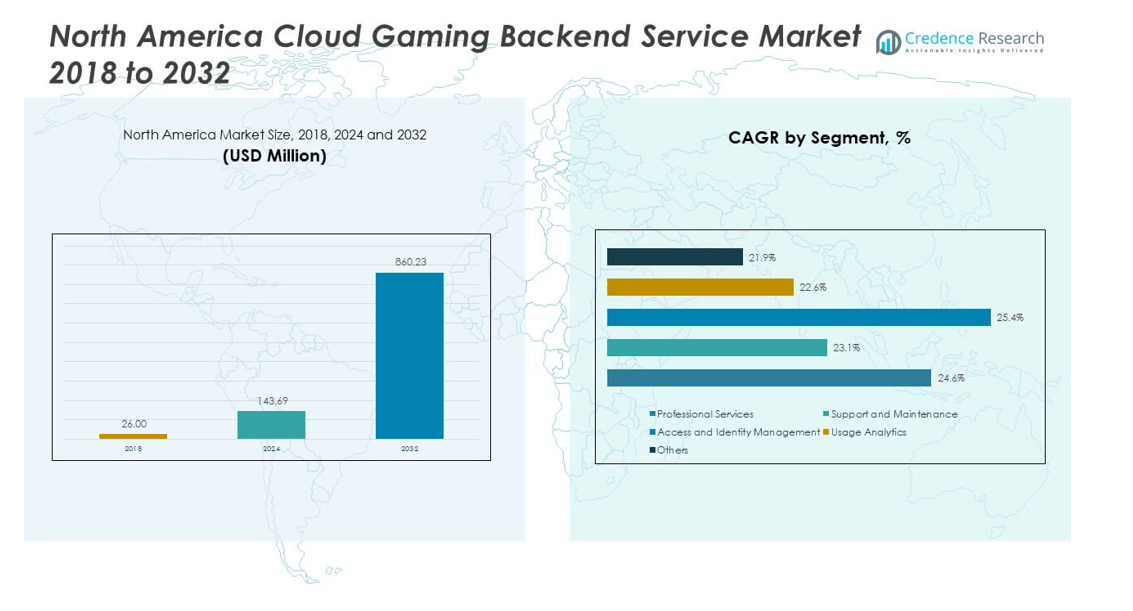
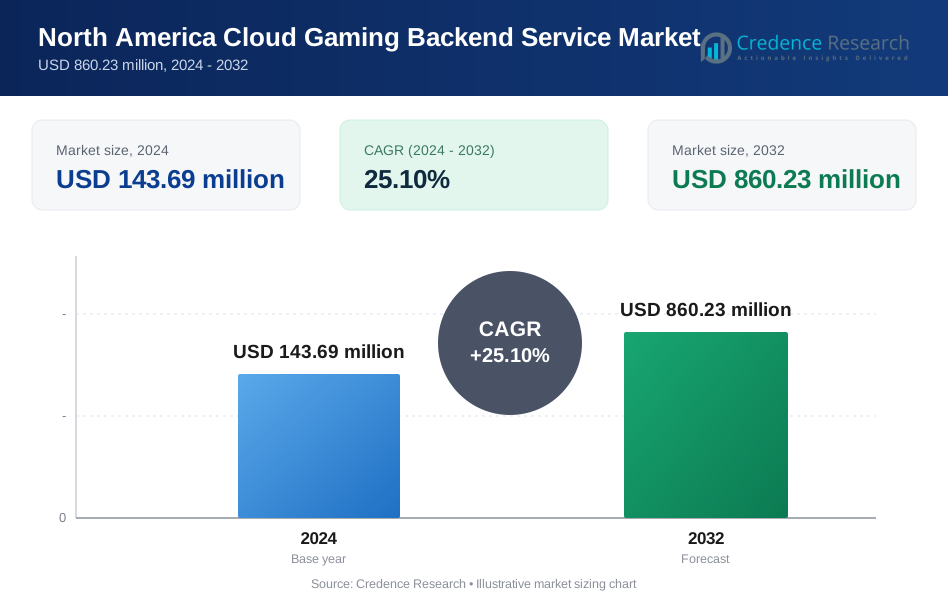
The North America Cloud Gaming Backend Service Market size was valued at USD 26.00 million in 2018 to USD 143.69 million in 2024 and is anticipated to reach USD 860.23 million by 2032, at a CAGR of 25.10% during the forecast period.
| REPORT ATTRIBUTE | DETAILS |
|---|---|
| Historical Period | 2020-2023 |
| Base Year | 2024 |
| Forecast Period | 2025-2032 |
| North America Cloud Gaming Backend Service Market Size 2024 | USD 143.69 million |
| North America Cloud Gaming Backend Service Market CAGR | 25.10% |
| North America Cloud Gaming Backend Service Market Size 2032 | USD 860.23 million |
The market is expanding due to rising demand for high-quality, low-latency gaming experiences. Cloud gaming providers are investing in robust backend services to support real-time processing and seamless multiplayer connectivity. Factors such as growing smartphone penetration, the rollout of 5G networks, and demand for cross-platform gaming are driving adoption. Additionally, advancements in edge computing and AI-driven optimization are improving system scalability and responsiveness, making backend services vital to support dynamic gaming environments and reduce infrastructure costs for developers.
Regionally, the United States dominates the market, backed by advanced internet infrastructure, strong cloud service providers, and a large gamer base. Canada is also gaining traction, with increasing investments in gaming startups and strong broadband connectivity. Meanwhile, Mexico is emerging as a growth market, driven by improving digital infrastructure and rising interest in online gaming. Together, these regions shape a diverse landscape where developed markets lead innovation, while emerging areas build momentum with growing adoption and infrastructure improvements.
Market Insights:
- The North America Cloud Gaming Backend Service Market was valued at USD 26.00 million in 2018, reached USD 143.69 million in 2024, and is projected to hit USD 860.23 million by 2032, growing at a CAGR of 25.10%.
- The Global Cloud Gaming Backend Service Market size was valued at USD 93.44 million in 2018 to USD 525.00 million in 2024 and is anticipated to reach USD 3,129.24 million by 2032, at a CAGR of 25.00% during the forecast period.
- The United States holds 68% of the market share due to advanced infrastructure, Canada follows with 21% driven by strong digital adoption, and Mexico contributes 11% through expanding broadband and growing consumer demand.
- Mexico is the fastest-growing region with an 11% share, supported by improving 5G rollout, expanding broadband connectivity, and rising smartphone penetration.
- Professional services accounted for 34% of the market share in 2024, maintaining dominance due to strong enterprise adoption.
- Usage analytics represented 22% of the 2024 share, reflecting growing demand for data-driven insights to enhance gaming experiences.
Market Drivers:
Rising Cloud Infrastructure Investments and 5G Expansion Accelerating Gaming Backend Demand
The growth of the North America Cloud Gaming Backend Service Market is strongly driven by rapid investments in cloud infrastructure and 5G deployment. Service providers focus on reducing latency to deliver high-performance gaming experiences across devices. The expanding role of edge computing enhances speed and reliability for real-time interactions. Smartphone adoption, combined with robust broadband penetration, increases accessibility for gamers at all levels. Developers rely on scalable backend systems to support multiplayer functionality and dynamic environments. Cloud-native architectures reduce infrastructure costs while improving efficiency for publishers. Partnerships between telecom operators and gaming companies improve distribution reach across markets. These combined factors strengthen the region’s leadership in advanced gaming ecosystems.
Increasing Consumer Demand for Cross-Platform Gaming Experiences
Consumer demand for seamless cross-platform experiences drives momentum in the North America Cloud Gaming Backend Service Market. Players expect consistent gameplay across mobile, console, and PC environments without interruptions. Backend services ensure real-time synchronization, keeping game states uniform across devices. Strong consumer preference for flexible, device-agnostic access shapes backend service designs. Developers deploy backend tools to manage authentication, in-game transactions, and secure user data. Rising expectations for instant access encourage investment in cloud-based delivery systems. Strong backend support guarantees competitive advantage by enabling publishers to reach wider audiences. It ensures that innovation remains aligned with shifting consumer expectations for accessibility.
Growing Adoption of AI and Advanced Analytics in Backend Systems
The adoption of AI and predictive analytics boosts backend service performance within the North America Cloud Gaming Backend Service Market. AI helps optimize server load, enhance matchmaking, and personalize user experiences. Advanced analytics enable operators to detect bottlenecks and predict player behavior. It allows developers to implement dynamic content updates based on user demand. AI tools streamline fraud detection and ensure secure transaction handling. Backend services benefit from machine learning algorithms that improve operational efficiency. Predictive modeling reduces downtime while enhancing system resilience. These technologies make backend solutions indispensable for scaling competitive and immersive gaming environments.
- For example, Ubisoft integrates AI and advanced analytics in its backend to optimize server loads and matchmaking for games like Rainbow Six Siege. The company’s backend uses machine learning models to predict peak usage, dynamically allocate resources, and detect fraudulent transactions.
Strategic Partnerships and Ecosystem Expansion Across Gaming Value Chains
Strategic collaborations fuel growth by integrating backend services with broader gaming ecosystems in the North America Cloud Gaming Backend Service Market. Cloud providers form alliances with developers to deliver reliable infrastructure. Telecom operators expand their roles by enabling low-latency connections for streaming gameplay. Backend platforms connect with payment gateways to facilitate seamless in-game purchases. Strong collaborations foster innovation in game delivery methods and monetization models. It provides opportunities for bundled services that improve customer retention. Partnerships accelerate the rollout of new features across multiple platforms. These ecosystem-driven collaborations enhance the industry’s ability to meet rising demand.
- For example, Verizon and Google Cloud have partnered to deliver 5G mobile edge computing infrastructure, combining Verizon’s network with Google Cloud’s compute and storage capabilities. The collaboration focuses on enabling low-latency, high-bandwidth performance to support real-time enterprise applications across North America.
Market Trends:
Expansion of Subscription-Based Gaming Models Driving Backend Utilization
Subscription-based gaming platforms gain traction in the North America Cloud Gaming Backend Service Market, reshaping consumer engagement. Players adopt monthly subscription models for unlimited access to diverse content. Backend services play a crucial role in supporting recurring payment systems and scalable user management. Operators depend on backend infrastructure to deliver seamless updates across content libraries. It enhances retention by ensuring uninterrupted availability of popular titles. Subscription-based ecosystems create predictable revenue streams for developers and publishers. The trend emphasizes the importance of backend scalability for managing millions of concurrent users. This model firmly positions backend services as central to gaming accessibility.
- For example, Microsoft’s Xbox Game Pass leverages Azure cloud backend infrastructure to support over 35 million active subscribers as of 2025. Azure employs infrastructure as code (IaC) and continuous integration/continuous delivery (CI/CD) pipelines to automate scalable deployment across global data centers.
Integration of Cloud Gaming with Social and Streaming Platforms
Integration of cloud gaming into social media and streaming platforms drives innovation in the North America Cloud Gaming Backend Service Market. Users increasingly prefer interactive content sharing and live gameplay streaming. Backend solutions enable real-time interactions, in-game broadcasting, and social integrations. It allows gamers to showcase experiences directly through embedded streaming tools. Platforms like social apps and video services strengthen engagement with cloud-native features. The rise of creator-driven ecosystems pushes backend services to support interactive functionalities. Scalable infrastructure ensures that high user activity does not disrupt gameplay or streaming. This convergence accelerates the role of backend services in digital entertainment.
- For example, NVIDIA GeForce NOW integrates with Twitch through NVIDIA Share, allowing gamers to stream gameplay directly. Its backend relies on RTX Server–based infrastructure, where GPU-powered pods deliver scalable cloud rendering across distributed server racks.
Rising Importance of Personalization and Immersive User Experiences
Personalization becomes a defining trend in the North America Cloud Gaming Backend Service Market, influenced by consumer expectations. Backend services now support adaptive algorithms that tailor in-game experiences. Players receive curated recommendations, dynamic environments, and content updates aligned with behavior patterns. It enables developers to craft individualized gameplay that enhances satisfaction. Immersive technologies, such as VR and AR, also integrate into backend systems. Personalization improves retention and drives loyalty by addressing unique user preferences. Backend operators employ advanced tools to predict and adapt to player needs. These innovations shape the competitive landscape and fuel sustained engagement levels.
Emergence of Lightweight Game Titles Designed for Cloud Ecosystems
Lightweight game titles designed specifically for cloud ecosystems reflect a rising trend in the North America Cloud Gaming Backend Service Market. Developers focus on optimizing games for instant play without heavy local storage needs. Backend platforms handle critical functions like rendering, updates, and progress tracking. It reduces barriers for users with limited device storage or low-end hardware. Streamlined cloud-native games encourage broader participation across demographics. Backend infrastructure ensures consistent delivery regardless of device capabilities. The trend highlights innovation in game design aligned with scalability goals. This movement reflects the industry’s commitment to inclusive and flexible gaming access.
Market Challenges Analysis:
Infrastructure Limitations and Bandwidth Concerns Restricting Growth
Infrastructure limitations and bandwidth concerns remain pressing challenges for the North America Cloud Gaming Backend Service Market. Rural and underserved regions face weaker broadband coverage, reducing accessibility for seamless experiences. High network demands often strain service quality, especially during peak hours. It creates issues with latency and lag that disrupt gameplay continuity. The reliance on 5G rollout faces delays in certain areas, slowing adoption. High operational costs linked to data traffic also increase pressure on providers. Limited access to reliable internet creates disparities between urban and rural users. Overcoming these barriers requires coordinated investments in telecom and cloud infrastructure.
Data Security Risks and Complex Regulatory Environment
Data security risks and regulatory compliance challenges hinder scalability in the North America Cloud Gaming Backend Service Market. Cybersecurity threats target sensitive user data and in-game transactions. It forces operators to adopt robust encryption and security frameworks. Complex regulations regarding cross-border data transfer create operational difficulties for global players. Compliance with privacy laws requires ongoing investments and monitoring efforts. Rising cyberattacks increase concerns for both providers and consumers. A fragmented regulatory landscape makes alignment difficult for multinational companies. These issues limit agility and raise costs, impacting growth opportunities for backend service providers.
Market Opportunities:
Expanding Penetration of 5G Networks and Edge Computing Driving New Growth Paths
The expanding 5G rollout and edge computing deployment create strong opportunities for the North America Cloud Gaming Backend Service Market. Low-latency connections enhance competitive gaming and improve real-time responses. Edge nodes strengthen service delivery by distributing workloads closer to end users. It increases efficiency while enabling immersive features like multiplayer support and real-time rendering. Backend providers can extend reach into underserved areas with this advancement. Telecom and gaming collaborations ensure that next-generation connectivity aligns with user expectations. This shift strengthens backend service adoption across the gaming industry and expands its long-term relevance.
Rising Adoption of Cloud-Native Game Development Models
The rising adoption of cloud-native development creates new opportunities for the North America Cloud Gaming Backend Service Market. Developers design games specifically for scalable, backend-supported ecosystems. It allows for faster updates, seamless upgrades, and personalized content delivery. Backend services streamline live operations and in-game transactions across devices. This approach ensures accessibility for users with limited hardware capacity. It provides cost efficiency for developers by reducing reliance on physical infrastructure. Growing preference for instant-access experiences strengthens demand for backend integration. These opportunities pave the way for sustainable growth and long-term innovation in cloud gaming ecosystems.
Market Segmentation Analysis:
By type, professional services hold a strong position in the North America Cloud Gaming Backend Service Market. These services enable developers and enterprises to deploy, manage, and optimize cloud-based solutions effectively. Support and maintenance play an equally important role, ensuring that systems remain secure and operational across high-demand environments. Access and identity management is vital for safeguarding data, user accounts, and in-game transactions. Usage analytics drives growth by offering real-time insights into gamer behavior, helping developers improve engagement strategies. Other backend functions contribute flexibility, allowing providers to tailor solutions for specific business models and user needs.
- For instance, Amazon Web Services (AWS) Professional Services has helped gaming companies deploy secure backend infrastructure supporting millions of concurrent players, leveraging managed services like Amazon Cognito for identity management and AWS CloudWatch for real-time usage analytics.
By end-user, large enterprises lead demand in the North America Cloud Gaming Backend Service Market due to their extensive infrastructure and established consumer base. These organizations adopt scalable backend solutions to deliver uninterrupted gaming across multiple platforms. Small and medium enterprises show rising adoption, encouraged by cost-efficient cloud models and reduced need for physical infrastructure. It allows smaller firms to compete with established players through innovative and accessible game delivery. Both segments highlight the role of backend services in driving scalability, efficiency, and secure operations, reinforcing the importance of tailored solutions for diverse market participants.
- For instance, Electronic Arts (EA) uses scalable cloud backend solutions from Google Cloud to support its millions of global users on titles like Apex Legends, managing up to 125 million monthly active users with server auto-scaling to handle peak demand.
Segmentation:
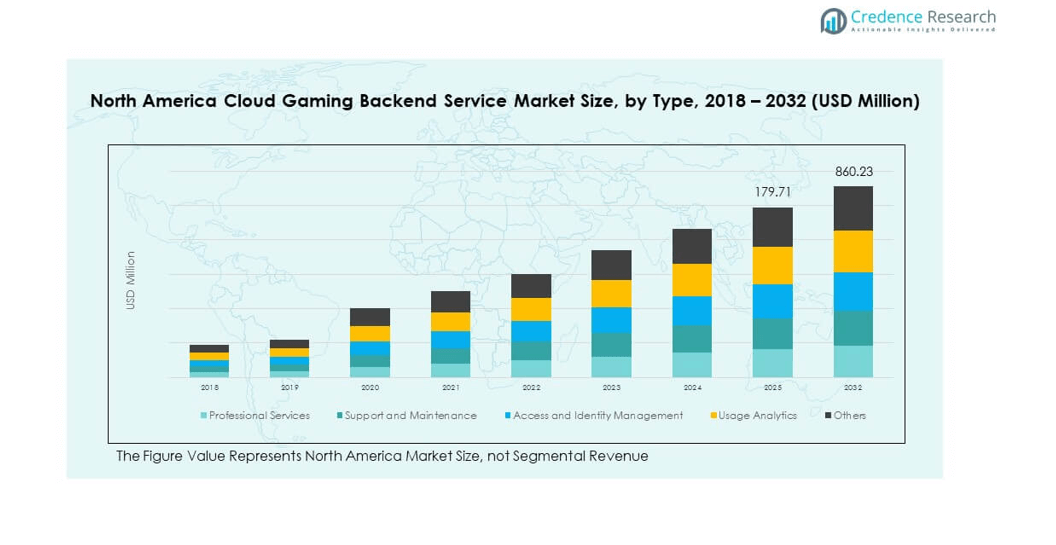
By Type
- Professional Services
- Support and Maintenance
- Access and Identity Management
- Usage Analytics
- Others
By End-User
- Small and Medium Enterprises
- Large Enterprises
Regional Analysis:
The United States dominates the North America Cloud Gaming Backend Service Market with a market share of 68%. Strong cloud infrastructure, advanced 5G deployment, and widespread broadband penetration drive its leadership. Major cloud providers and gaming companies concentrate operations in this region, reinforcing innovation and scalability. High consumer demand for cross-platform gaming also supports backend service growth. It benefits from a mature digital ecosystem that ensures low latency and high performance. The U.S. remains the central hub for both technology development and large-scale adoption of backend gaming services.
Canada accounts for 21% of the North America Cloud Gaming Backend Service Market, supported by strong internet infrastructure and rising digital adoption. Investments in gaming startups and cloud-based services create favorable conditions for expansion. The country benefits from government support for digital innovation and emerging technology integration. Large consumer interest in online entertainment fuels demand for backend solutions. It also benefits from cross-border collaborations with U.S. technology providers. The Canadian market continues to develop as a key contributor to regional growth while strengthening its role in cloud-based ecosystems.
Mexico represents 11% of the North America Cloud Gaming Backend Service Market, emerging as a growth-focused subregion. Expanding broadband connectivity and improving 5G rollout provide strong foundations for adoption. Growing smartphone penetration fuels consumer demand for flexible gaming options. It creates opportunities for backend providers to expand into underserved markets. Local gaming communities embrace online platforms, increasing reliance on cloud services. Mexico shows strong potential to rise further in share as infrastructure development accelerates and consumer engagement strengthens.
Key Player Analysis:
- Microsoft Azure
- Amazon Web Services (AWS)
- Google Cloud Platform
- NVIDIA GeForce Now
- IBM Cloud
- Unity Technologies (Parsec)
- LiquidSky Software
- Vortex
- Shadow
- Back4App
Competitive Analysis:
The North America Cloud Gaming Backend Service Market features strong competition among global cloud service providers and specialized gaming technology companies. Microsoft Azure, Amazon Web Services (AWS), and Google Cloud Platform dominate through their extensive infrastructure, offering scalability, reliability, and integration capabilities. NVIDIA GeForce Now strengthens its position by delivering optimized cloud-native gaming services supported by advanced GPU technology. IBM Cloud contributes with enterprise-grade security and data management features, catering to large-scale gaming ecosystems. Unity Technologies, through Parsec, enhances developer-focused backend solutions for real-time collaboration and game delivery. Smaller players such as LiquidSky Software, Vortex, Shadow, and Back4App add diversity by focusing on targeted solutions and flexible service models. It helps drive innovation in areas such as usage analytics, access management, and low-latency streaming. Competitive strategies include mergers, partnerships, and regional expansions aimed at broadening service reach. Companies differentiate through integration of AI, edge computing, and real-time analytics that improve system performance and user experience. Continuous investment in security, scalability, and immersive features remains central to sustaining market share. The industry reflects a mix of established technology leaders and emerging innovators that collectively shape the competitive dynamics of the market.
Recent Developments:
- In September 2025, NVIDIA launched the Blackwell RTX upgrade for GeForce NOW, bringing RTX 5080-class power streaming to the cloud. This update enables higher gaming resolutions and frame rates, new competitive high-performance modes, and access to over 2,200 titles, further solidifying NVIDIA's presence in the North American cloud gaming backend service market.
- In June 2025, NVIDIA entered additional publisher partnerships that added over 25 new titles to GeForce NOW in North America, reflecting the company's continued collaboration-oriented growth in the backend gaming service space.
- In March 2025, Xsolla and AWS entered into a key partnership designed to empower game developers with the latest advancements in cloud gaming and LiveOps solutions. The collaboration leverages AWS’s cloud infrastructure and Xsolla’s developer platform to create scalable, flexible backend solutions, further strengthening their positions in the expanding global cloud gaming backend service sector.
- In July 2024, Xsolla announced the acquisition of LF.Group to enhance gaming connectivity and commerce, empower creators, and improve user engagement across multiple platforms. This strategic move aims to give Xsolla a stronger foothold in the global cloud gaming backend service market by integrating LF.Group's technology stack and community features into its existing offerings, driving forward innovation in backend solutions for cloud gaming environments.
Report Coverage:
The research report offers an in-depth analysis based on type and end-user. It details leading market players, providing an overview of their business, product offerings, investments, revenue streams, and key applications. Additionally, the report includes insights into the competitive environment, SWOT analysis, current market trends, as well as the primary drivers and constraints. Furthermore, it discusses various factors that have driven market expansion in recent years. The report also explores market dynamics, regulatory scenarios, and technological advancements that are shaping the industry. It assesses the impact of external factors and global economic changes on market growth. Lastly, it provides strategic recommendations for new entrants and established companies to navigate the complexities of the market.
Future Outlook:
- The North America Cloud Gaming Backend Service Market will witness stronger integration of AI-driven optimization to enhance efficiency and responsiveness.
- Cloud-native architectures will expand, allowing developers to deliver seamless updates and scalable solutions across platforms.
- Strategic partnerships between telecom operators and cloud providers will increase access to low-latency gaming experiences.
- Growth in subscription-based models will strengthen recurring revenues for backend service providers.
- Adoption of usage analytics will drive personalized content and improve player engagement strategies.
- Expansion of 5G and edge computing will create new opportunities for immersive and multiplayer-focused gaming.
- Data security enhancements will remain a central focus to protect user transactions and sensitive information.
- Demand from large enterprises will sustain leadership, while SMEs will show faster adoption due to cost-efficient models.
- Mexico and Canada will continue to strengthen their positions as emerging contributors in the regional landscape.
- Continuous innovation in backend functions will ensure long-term competitiveness and adaptability across diverse gaming ecosystems.
Request a Free Sample
Fill in your details and we'll send you a free sample report.
- Sample data tables & charts
- Research methodology
Need a Custom Version of This Report?
Tailor the scope, geography, or segments to your exact requirements.
- Custom geography or segment scope
- Direct access to our analyst team
Frequently Asked Questions
What is the current market size for North America Cloud Gaming Backend Service Market, and what is its projected size in 2032?
Which North America Cloud Gaming Backend Service Market segment held the largest share in 2024?
What are the primary factors fueling the growth of the North America Cloud Gaming Backend Service Market?
Who are the leading companies in the North America Cloud Gaming Backend Service Market?
Table of Content
Chapter 1. Report Introduction
- 1.1 Report Description & Purpose
- 1.1.1 Report Title & Market Definition
- 1.1.2 Unique Selling Propositions (USP) & Key Differentiators
- 1.1.3 Value Proposition for Stakeholders
- 1.2 Research Objectives
- 1.2.1 Market Sizing Objectives (Volume & Revenue)
- 1.2.2 Segmentation Objectives
- 1.2.3 Competitive Intelligence Objectives
- 1.2.4 Forecast & Scenario Objectives
- 1.3 Report Scope
- 1.3.1 North America Cloud Gaming Backend Service Scope – Types & Subtypes Covered
- 1.3.2 Geographic Scope – Regions & Countries Covered
- 1.3.3 Historical Period, Base Year & Forecast Period (2024; forecast to 2032)
- 1.3.4 Inclusions & Exclusions
- 1.4 HS Code & Classification Framework
- 1.5 Currency, Units & Pricing Basis
- 1.6 Target Stakeholders
- 1.7 Limitations & Assumptions
Chapter 2. Executive Summary
- 2.1 Global North America Cloud Gaming Backend Service Market Snapshot
- 2.1.1 Market Size – Historical (2024) & Forecast (2024-2032) (2024: USD 143.69 million → 2032: USD 860.23 million)
- 2.1.2 Volume & Revenue – Global Totals
- 2.1.3 Key Market Highlights – Top Five Facts
- 2.2 North America Cloud Gaming Backend Service Market Segmentation Snapshot
- 2.2.1 Market Split by Region – 2024 vs. 2032
- 2.3 Competitive Snapshot
- 2.3.1 Top 10 Players by Revenue Share – 2024
- 2.3.2 Top 10 Players by Volume Share – 2024
- 2.3.3 Recent Strategic Developments (18-Month Summary)
- 2.4 Key Investment Highlights & Strategic Conclusions
Chapter 3. North America Cloud Gaming Backend Service Market Dynamics & Industry Analysis
- 3.1 Market Overview & Context
- 3.1.1 North America Cloud Gaming Backend Service Market Position in the Broader Automotive Value Chain
- 3.1.2 OEM vs. Replacement Market Dynamics
- 3.1.3 Market Maturity & Development Stage by Region
- 3.2 North America Cloud Gaming Backend Service Market Drivers
- 3.3 North America Cloud Gaming Backend Service Market Restraints & Challenges
- 3.4 North America Cloud Gaming Backend Service Market Opportunities
- 3.5 Porter's Five Forces Analysis
- 3.5.1 Threat of New Entrants
- 3.5.2 Bargaining Power of Suppliers
- 3.5.3 Bargaining Power of Buyers
- 3.5.4 Threat of Substitutes
- 3.5.5 Competitive Rivalry – Intensity Assessment
- 3.6 North America Cloud Gaming Backend Service Value Chain Analysis
- 3.6.1 Upstream – Raw Material/Input Suppliers
- 3.6.1.1 Raw Material/Input 1
- 3.6.1.2 Raw Material/Input 2
- 3.6.1.3 Raw Material/Input 3
- 3.6.2 Midstream – Production/Manufacturing/Service Delivery
- 3.6.2.1 Production/Process Overview
- 3.6.2.2 Key Facility Locations & Capacity by Manufacturer
- 3.6.3 Downstream – Distribution & End Consumer
- 3.6.3.1 Primary Channel – B2B/OEM
- 3.6.3.2 Secondary Channels – Dealer, Retail, Online, Direct
- 3.6.4 Value Chain Profitability Analysis
- 3.6.1 Upstream – Raw Material/Input Suppliers
- 3.7 PESTEL Analysis
- 3.7.1 Political Factors
- 3.7.2 Economic Factors
- 3.7.3 Social Factors
- 3.7.4 Technological Factors
- 3.7.5 Environmental Factors
- 3.7.6 Legal Factors
- 3.8 North America Cloud Gaming Backend Service Supply Chain Analysis
- 3.8.1 Raw Material/Input Supply Risk Assessment
- 3.8.2 Manufacturing Concentration Risk (Geographic Exposure)
- 3.8.3 Trade Disruption Impact Analysis
- 3.9 Regulatory & Policy Landscape
Note: The regulatory and policy landscape section covers regulations based on their applicability to the market, North America Cloud Gaming Backend Service category, geography, and scope of the study. Only regulatory frameworks with a material impact on operations, compliance, trade, sustainability, or market access are analyzed in detail.
Chapter 4. Key Investment Pockets & Opportunity Analysis
- 4.1 North America Cloud Gaming Backend Service Market Attractiveness Analysis
- 4.1.1 By Region – Investment Attractiveness Matrix (Volume × CAGR)
- 4.2 Absolute Revenue Growth Opportunity
- 4.2.1 By Region – Absolute USD Growth Through 2032
- 4.3 Incremental Volume Opportunity
- 4.3.1 By Region – Incremental Volume Through 2032
- 4.3.2 Segment – Incremental Volume
- 4.4 Emerging Submarket Opportunity Deep Dive (Subject to Applicability)
- 4.5 Emerging Market Opportunity Scorecards
- 4.5.1 United States
- 4.5.2 Europe
- 4.5.3 Asia
- 4.5.4 Middle East & Africa
Note: Emerging Market Opportunity Scorecards will be included based on relevance and strategic importance. Regions listed are indicative and may vary depending on data availability and market dynamics.
Chapter 5. North America Cloud Gaming Backend Service Import-Export Analysis & Trade Flows
- 5.1 Global Trade Overview
- 5.1.1 Global Export Value by Country (2024)
- 5.1.2 Global Export Volume by Country (2024)
- 5.1.3 Global Import Value by Country (2024)
- 5.1.4 Global Import Volume by Country (2024)
- 5.1.5 Net Trade Balance by Country (2024)
- 5.2 Export Analysis – Segment
- 5.2.1 Type 1 (HS Code)
- 5.2.2 Type 2 (HS Code)
- 5.2.3 Type 3 (HS Code)
- 5.2.4 Type 4 (HS Code)
- 5.2.5 Type 5 (HS Code)
- 5.3 Import Analysis – Segment
- 5.3.1 Type 1 (HS Code)
- 5.3.2 Type 2 (HS Code)
- 5.3.3 Type 3 (HS Code)
- 5.3.4 Type 4 (HS Code)
- 5.3.5 Type 5 (HS Code)
- 5.4 Average Unit Trade Prices
- 5.4.1 Average Export Price – Segment & Country
- 5.4.2 Average Import Price – Segment & Source Country
- 5.4.3 Price Trends (2024)
- 5.5 Key Trade Route Analysis
- 5.5.1 Trade Route 1
- 5.5.2 Trade Route 2
- 5.5.3 Trade Route 3
- 5.5.4 Trade Route 4
- 5.5.5 Trade Route 5
- 5.6 Trade Policy Impact Assessment
- 5.6.1 US Anti-Dumping & Section 301 Tariffs
- 5.6.2 EU Customs Union Impact
- 5.6.3 Major Free Trade Agreements
- 5.6.4 USMCA Rules of Origin
Note: Trade policy analysis will be included only where relevant to the North America Cloud Gaming Backend Service market.
Chapter 6. Competitive Landscape & Company Benchmarking
- 6.1 North America Cloud Gaming Backend Service Market Concentration & Structure
- 6.1.1 Herfindahl-Hirschman Index (HHI) – vs. 2024
- 6.1.2 Tier 1, Tier 2 & Tier 3 Market Structure
- 6.1.3 Global, Regional & Local Player Dynamics
- 6.2 North America Cloud Gaming Backend Service Market Share Analysis – 2024
- 6.2.1 Global Revenue Share by Company
- 6.2.2 Global Volume Share by Company
- 6.2.3 Regional Revenue Share
- 6.2.4 Market Share Evolution ( vs. 2024)
- 6.2.5 OEM Segment Share by Company
- 6.2.6 Replacement Segment Share by Company
- 6.3 Production/Delivery Capacity & Facility Analysis
- 6.3.1 Global Installed Capacity
- 6.3.2 Capacity Utilization Rates
- 6.3.3 Production/Output Volume
- 6.3.4 Facility Locations & Capacity Map
- 6.3.5 Planned Capacity Additions
- 6.4 North America Cloud Gaming Backend Service Competitive Benchmarking Matrix
- 6.4.1 Revenue, Volume, CAGR & Profitability Comparison
- 6.4.2 Channel Revenue Mix
- 6.4.3 Geographic Revenue Exposure
- 6.4.4 R&D Intensity
- 6.4.5 Sustainability Maturity
- 6.5 Strategic Developments in North America Cloud Gaming Backend Service (Last 24 Months)
- 6.5.1 Mergers, Acquisitions & Divestments
- 6.5.2 New North America Cloud Gaming Backend Service Launches
- 6.5.3 Facility Expansions
- 6.5.4 Strategic Alliances, Joint Ventures & Partnerships
- 6.5.5 Distribution Expansion & Market Entry
- 6.5.6 Sustainability & ESG Initiatives
- 6.6 Competitive Strategy Mapping
- 6.6.1 Leader, Challenger, Follower & Niche Classification
- 6.6.2 Pricing Strategy Comparison
- 6.6.3 Channel Strategy Matrix
Note: Strategic developments are included based on their materiality and the availability of reliable information.
Chapter 7. Global North America Cloud Gaming Backend Service Market – By Distribution Channel
- 7.1 Segment Overview
- 7.1.1 Volume & Revenue Split by Channel (2024 & 2032)
- 7.1.2 Channel Mix Evolution (2024-2032)
Chapter 8. Regional Market Analysis – Global Overview
- 8.1 Global Regional Overview
- 8.1.1 Regional Volume Share
- 8.1.2 Regional Revenue Share
- 8.1.3 Regional Volume by Region
- 8.1.4 Regional Revenue by Region
- 8.1.5 Regional Forecast Through 2032
- 8.2 Cross-Regional Segment Analysis
- 8.2.1 By Distribution Channel
- 8.2.2 By Brand/Price Tier
Chapter 9. North America North America Cloud Gaming Backend Service Market
- 9.1 United States
- 9.2 Canada
- 9.3 Mexico
Chapter 10. Europe North America Cloud Gaming Backend Service Market
- 10.1 Germany
- 10.2 France
- 10.3 Italy
- 10.4 United Kingdom
- 10.5 Spain
- 10.6 Poland
- 10.7 Russia
- 10.8 Netherlands
- 10.9 Belgium
- 10.10 Sweden
- 10.11 Denmark
- 10.12 Norway
- 10.13 Rest of Europe
Chapter 11. Asia Pacific North America Cloud Gaming Backend Service Market
- 11.1 China
- 11.2 India
- 11.3 Japan
- 11.4 South Korea
- 11.5 Thailand
- 11.6 Indonesia
- 11.7 Vietnam
- 11.8 Malaysia
- 11.9 Australia
- 11.10 Rest of Asia Pacific
Chapter 12. Latin America North America Cloud Gaming Backend Service Market
- 12.1 Brazil
- 12.2 Argentina
- 12.3 Colombia
- 12.4 Chile
- 12.5 Rest of Latin America
Chapter 13. Middle East North America Cloud Gaming Backend Service Market
- 13.1 Saudi Arabia
- 13.2 United Arab Emirates
- 13.3 Turkey
- 13.4 Israel
- 13.5 Iran
- 13.6 Rest of the Middle East
Chapter 14. Africa North America Cloud Gaming Backend Service Market
- 14.1 South Africa
- 14.2 Egypt
- 14.3 Nigeria
- 14.4 Morocco
- 14.5 Rest of Africa
Chapter 15. North America Cloud Gaming Backend Service Company Profiles
- 15.1 [Company 01]
- 15.1.1 Company Overview
- 15.1.2 Key Management Personnel
- 15.1.3 Products & Services Portfolio
- 15.1.4 Financial Performance
- 15.1.5 Key Market Focus & Geographic Presence
- 15.1.6 Recent Developments & Strategic Initiatives
Note: The company profile list is preliminary and may change based on research findings, market developments, data availability, and client requirements.
Chapter 16. Appendices
- Appendix A – List of Abbreviations & Acronyms
- Appendix B – Industry Classification Code Reference – Full Series
- Appendix C – Production & Capacity Data Tables
- Appendix D – End-Use & Demand Base Tables
- Appendix E – Consumption & Replacement Rate Assumptions
- Appendix F – ASP Reference Tables
- Appendix G – Manufacturing & Facility Database
- Appendix H – Import-Export Data Tables
- Appendix I – Regulatory Summary Tables
- Appendix J – Primary Research Participant List (Anonymized)
- Appendix K – Primary Research Questionnaire Framework
- Appendix L – Data Sources & Bibliography
- Appendix M – Market Size Divergence & Source Comparison
Chapter 17. Research Methodology
- 17.1 Research Framework & Philosophy
- 17.2 Secondary Research – Sources, Hierarchy & Data Extraction
- 17.3 Data Modeling – Bottom-Up & Top-Down Market Sizing
- 17.4 Primary Research – Stakeholder Framework, LOI & Sample Sizes
- 17.5 Forecast Methodology – Regression, Scenario & Sensitivity Analysis
- 17.6 Quality Control – Four-Layer Validation Framework
- 17.7 Limitations & Standard Assumptions
- 17.8 Disclaimer
