
Replacement buying and higher prices set the value path
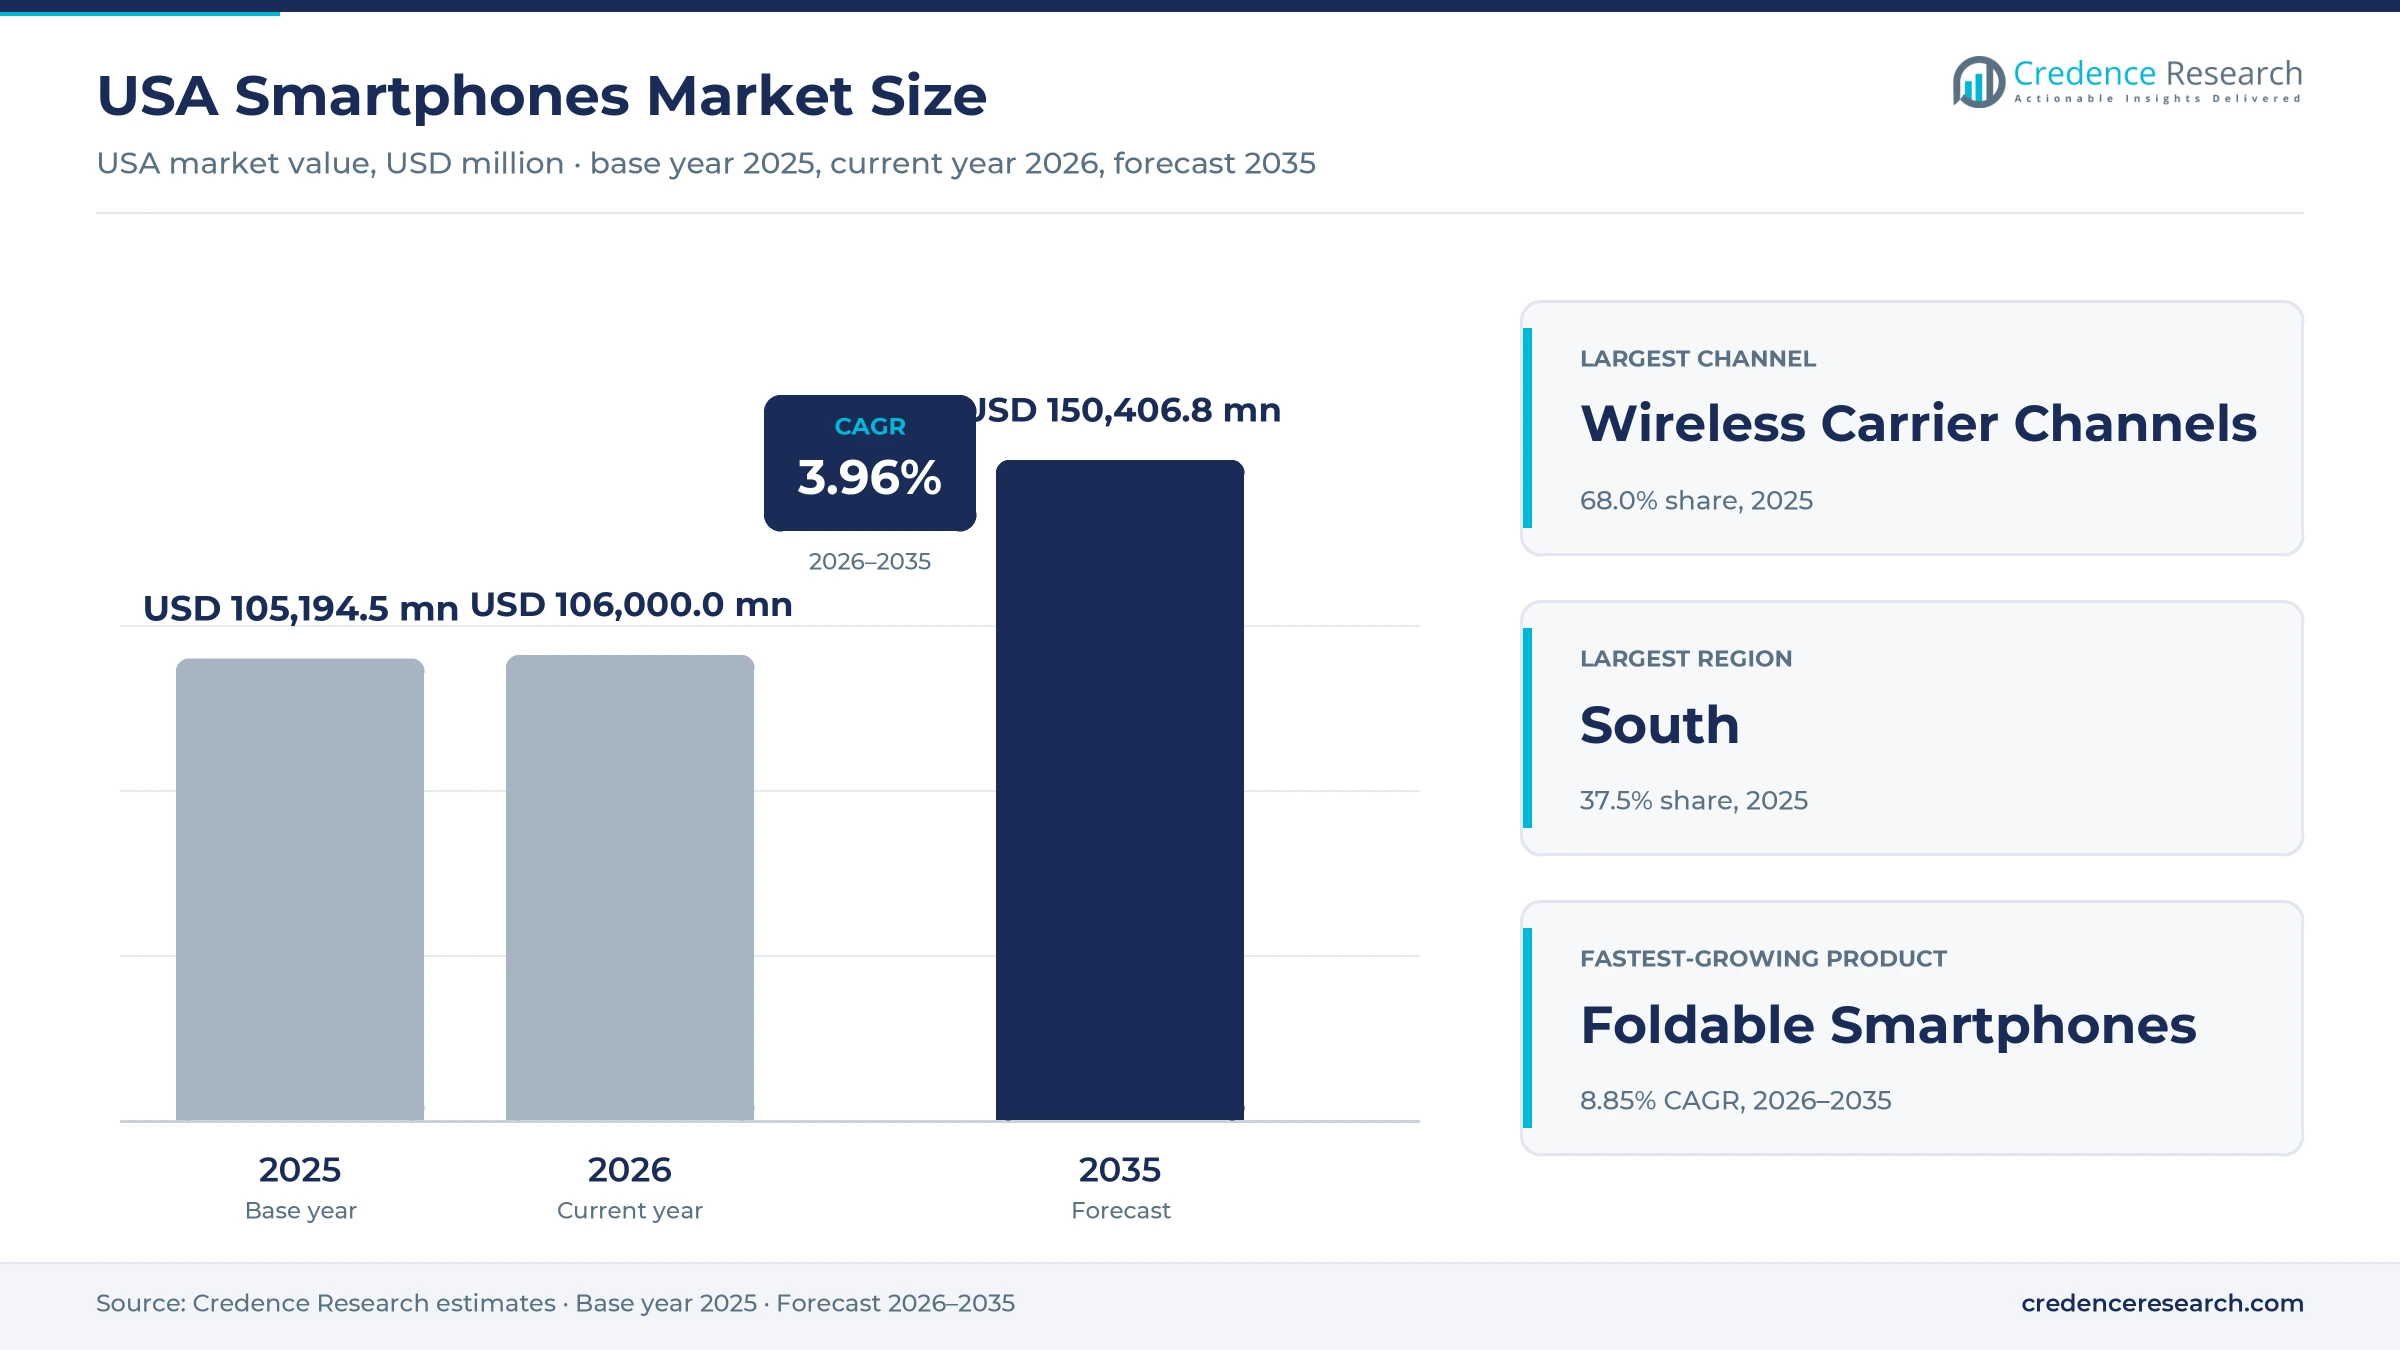
The USA smartphones market was valued at USD 101.96 billion in 2025 and is projected to increase from USD 106.00 billion in 2026 to USD 150.41 billion by 2035, registering a CAGR of 3.96% during 2026–2035. Demand comes mainly from replacement purchases, because Pew Research Center finds that about 91% of American adults already own a smartphone. Wireless carriers finance a large part of those purchases, while higher memory costs are lifting list prices as units soften, with first-quarter 2026 shipments down 3% at 33.4 million units, according to MacTech. The South held the largest regional share at 37.5% in 2025, in line with its position as the most populous Census region. The South is also the fastest-growing region at 4.28% a year. The commercial picture changed on Sept. 9, 2026, when Apple unveiled its first foldable iPhone at a starting price of $1,999, bringing the largest U.S. vendor into a category previously served by Android brands.
What does the U.S. handset market count, and how do Americans buy?
The market counts the value of new smartphones sold to American consumers, companies, public agencies and schools. Most buyers purchase through a carrier plan with monthly installments and trade-in credits, although unlocked sales through manufacturer stores, big-box retailers and online marketplaces are also counted.
Service plans, accessories, repair and used or refurbished devices are excluded from the totals. The value chain runs from chip and memory suppliers through contract assemblers, mostly in Asia, to brand owners, carriers and retailers, and higher prices are offsetting part of the decline in shipments during 2026.
USA Smartphones Market Insights
- The market rises from USD 101.96 billion in 2025 to USD 150.41 billion by 2035, a 3.96% CAGR built on replacement buying and richer price mix rather than new users.
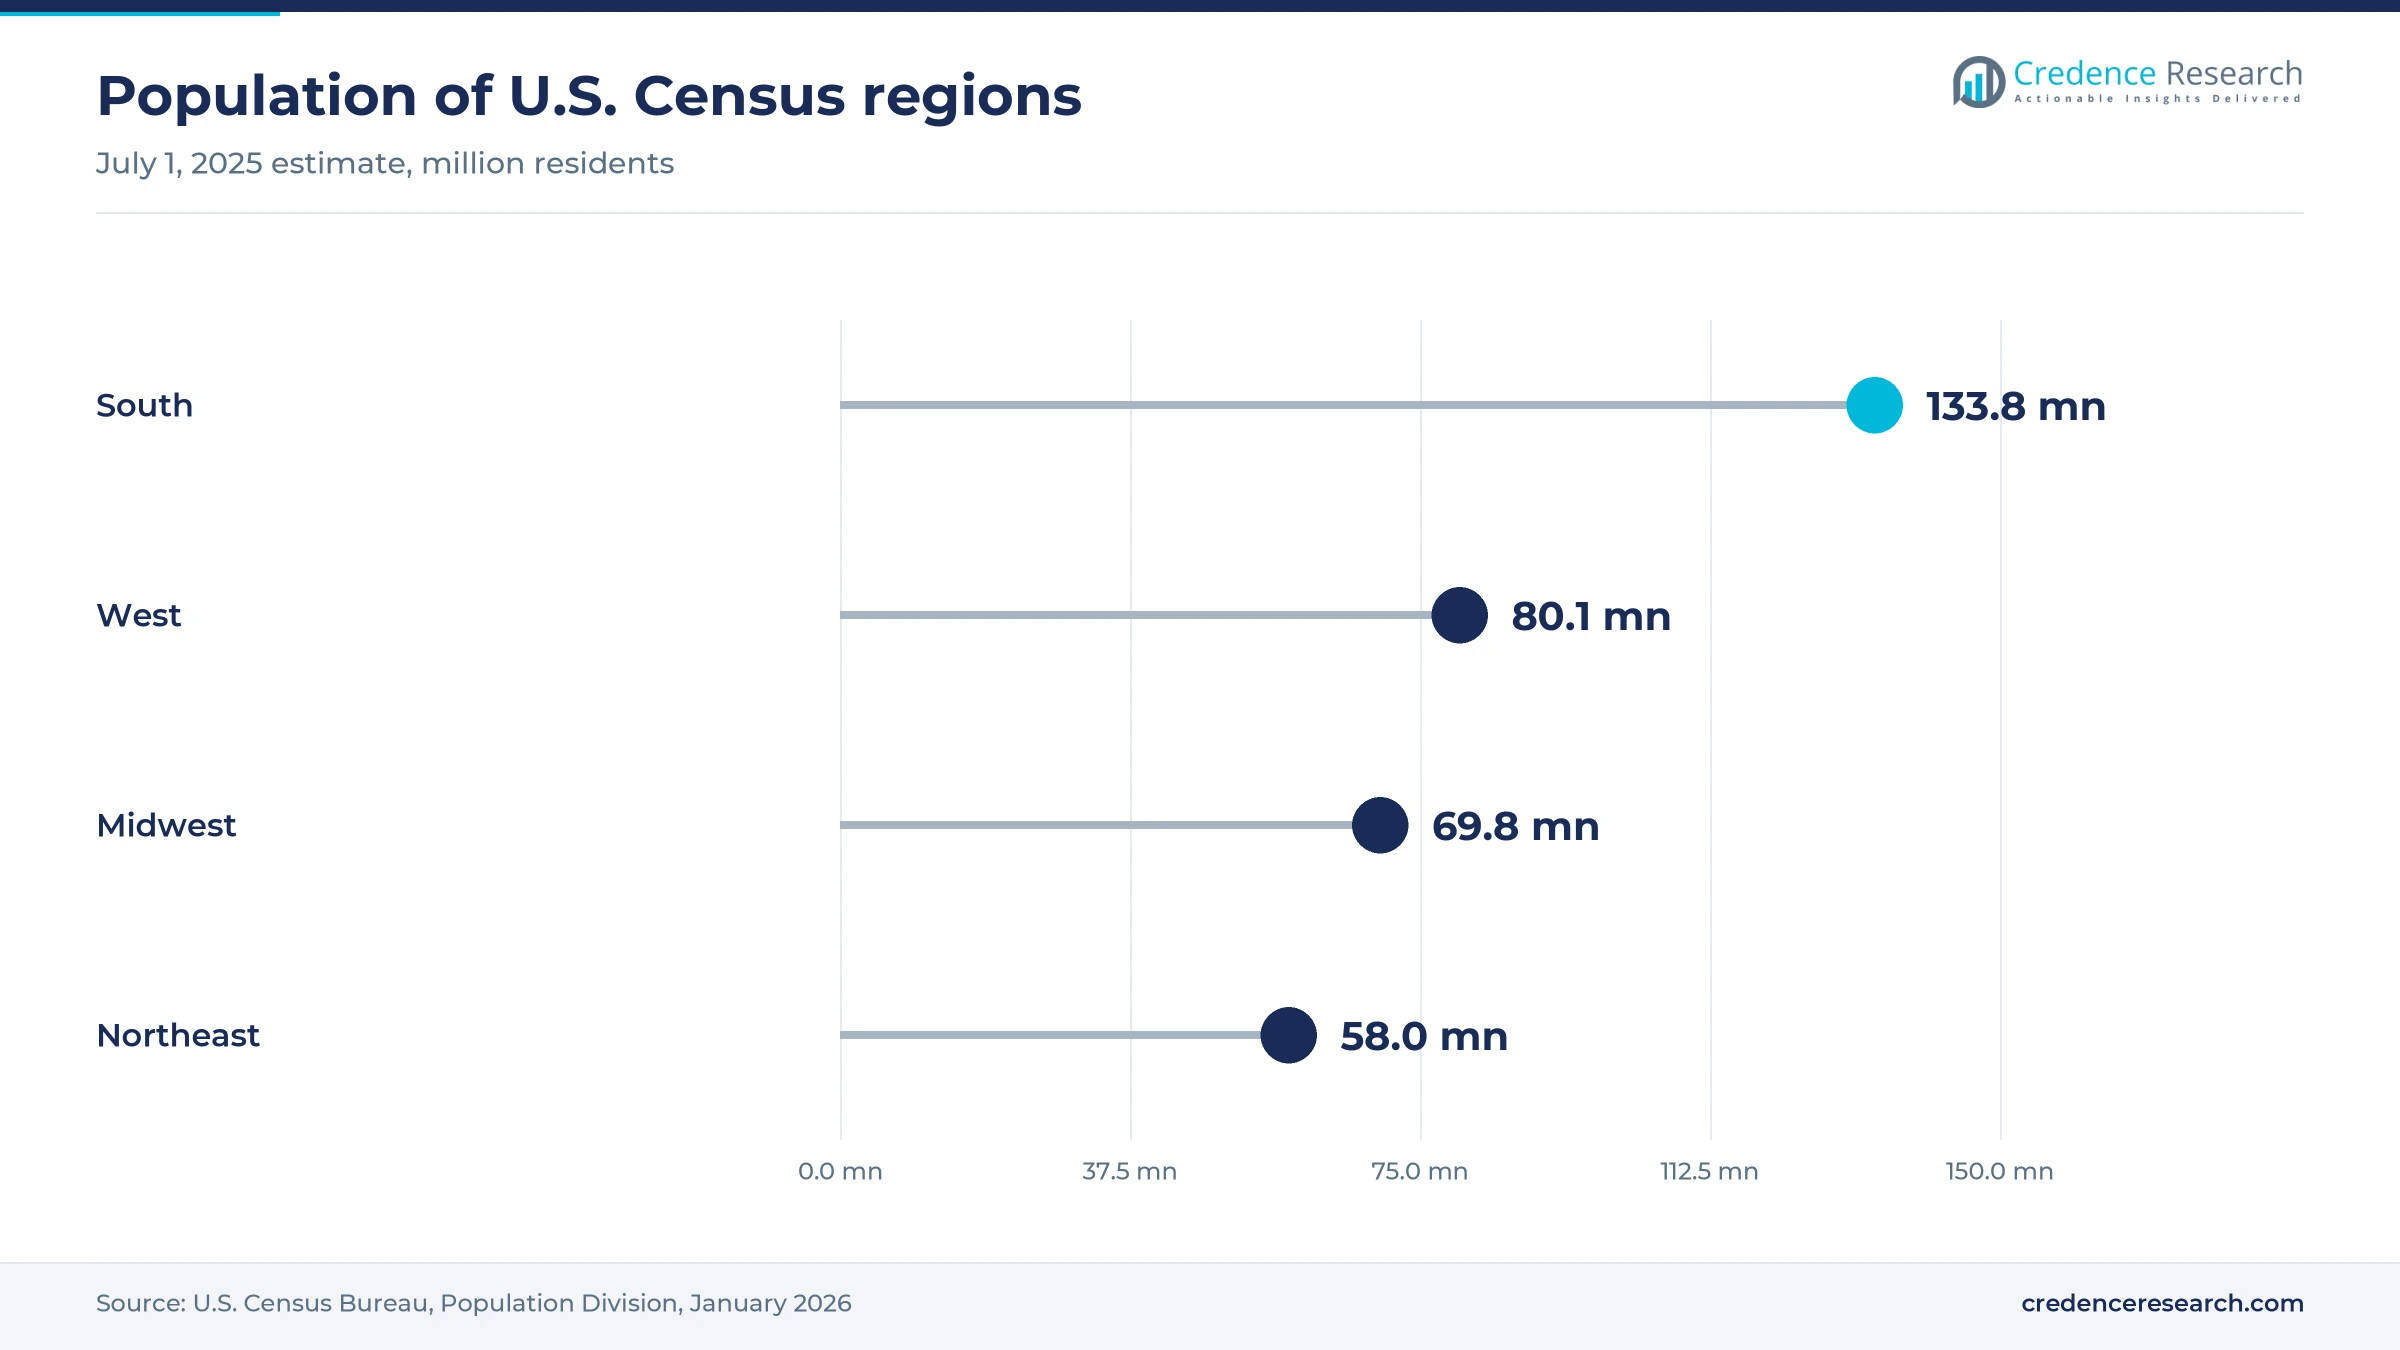
- The South held 37.5% of 2025 value, which tracks the 133.8 million residents counted there by Census Bureau estimates in July 2025.
- Wireless Carrier Channels held 68.0% of 2025 value, because most Americans still buy handsets alongside a plan, installment contract and trade-in offer.
- Apple unveiled its first foldable iPhone on Sept. 9, 2026, bringing the largest vendor into a category that Android brands had served alone until then.
- MacTech reported Apple, Samsung and Motorola at 95% of first-quarter 2026 shipments, so smaller brands now compete mainly for prepaid and specialty buyers.
Premium pricing and carrier sales define value share
Why do bar phones dominate while foldables grow fastest?
Based on product type, the market is categorized into standard bar smartphones, foldable smartphones, rugged smartphones and gaming smartphones. Standard Bar Smartphones led with 92.5% of 2025 value because volume models anchor every major vendor, and Apple alone shipped 19.9 million iPhones in the first quarter of 2026, according to MacTech. Foldable Smartphones grow fastest at 8.85% a year as Apple joined Samsung in folding handsets on Sept. 9, 2026, at $1,999, according to Fox Business. Rugged models serve a narrower field, shown by the MIL-STD-810H certified Sonim XP Pro that reached AT&T on June 6, 2025.
Which buyers pay for most American handsets?
Based on end user, the market is categorized into individual consumers, corporate-liable users, government and public safety, and education users. Individual Consumers led with 84.0% of 2025 value because household buyers fund most purchases, and a Reviews.org survey of 1,000 U.S. adults in August 2026 found they paid $634 on average for their current phone. Government and Public Safety grows fastest at 5.16% a year as AT&T reported more than 7 million FirstNet connections in March 2025. Education buying stays limited, because Ballotpedia counted 33 states with statewide K-12 cellphone limits by March 2026, which restricts classroom use of personal devices.
How does price tier shape spending?
Based on price tier, the market is categorized into entry smartphones below USD 300, mid-range smartphones USD 300-599, premium smartphones USD 600-999 and ultra-premium smartphones USD 1,000 and above. Premium Smartphones USD 600-999 led with 38.0% of 2025 value because Apple's mainstream models sit in this band, and MacTech reported that the iPhone 17 series made up 70% of Apple shipments in early 2026. Ultra-Premium Smartphones USD 1,000 and Above grow fastest at 4.85% a year as list prices climb, with the iPhone 18 Pro starting at $1,199 against $1,099 for the iPhone 17 Pro. Entry models are repricing too, since Samsung raised the Galaxy A17 by $50 in July 2026, according to iClarified.
Why do carriers still control the American sale?
Based on distribution channel, the market is categorized into wireless carrier channels, OEM direct channels, electronics and mass retail, and e-commerce marketplaces. Wireless Carrier Channels led with 68.0% of 2025 value because carriers bundle devices with plans and financing, and Apple accounted for a record 89% of smartphone sales at AT&T in the fourth quarter of 2025, according to MacTech. E-Commerce Marketplaces grow fastest at 5.58% a year as Census Bureau data show online retail sales up 12.2% in the second quarter of 2026, against 6.7% for all retail. Motorola also sold the Moto G Play unlocked on Amazon.com from Nov. 13, 2025.
| Segment Group | Leading Sub-segment | Share, 2025 | Fastest-growing Sub-segment | CAGR, 2026–2035 |
|---|---|---|---|---|
| By Product Type | Standard Bar Smartphones | 92.5% | Foldable Smartphones | 8.85% |
| By End User | Individual Consumers | 84.0% | Government and Public Safety | 5.16% |
| By Price Tier | Premium Smartphones USD 600-999 | 38.0% | Ultra-Premium Smartphones USD 1,000 and Above | 4.85% |
| By Distribution Channel | Wireless Carrier Channels | 68.0% | E-Commerce Marketplaces | 5.58% |
Request a Free Sample
Fill in your details and we'll send you a free sample report.
- Sample data tables & charts
- Research methodology
Older phones and carrier offers keep replacement moving
How does a near-universal installed base create replacement demand?
Replacement is the core of demand because few American adults remain to be added as first-time owners. Pew Research Center puts smartphone ownership at 91% of U.S. adults, unchanged across its 2024, 2025 and 2026 surveys. Aging devices therefore create the next sale, and Assurant said the average iPhone traded in during the second quarter of 2026 passed four years of age for the first time. Buyers also intend to return sooner than they do, as Reviews.org found in August 2026 that Americans plan to upgrade after about 20 months. In turn, the South gains most from this cycle, because its population is expanding faster than that of other regions.
How do premium and AI-capable devices lift value?
Premium migration lifts value even when unit sales stall, because spending is moving toward costlier devices. MacTech reported that sub-$300 sales fell 7% in the fourth quarter of 2025, while Apple's share reached a record 69%. MacTech reported that $800-plus shipments fell only 1% in the first quarter of 2026, against 19% for the $300 to $599 band, although entry units rose 8% as channels bought ahead of price increases on select value models. AI adds a further reason to trade up, and the Consumer Technology Association said in January 2026 that its market is increasingly driven by premium features and AI-enabled experiences. As a result, Ultra-Premium Smartphones USD 1,000 and Above grow at 4.85% a year.
Why does rising data traffic support newer 5G handsets?
Heavier network use gives households a practical reason to replace older handsets, because traffic keeps climbing on networks built for 5G. CTIA reported that Americans used 159.3 trillion megabytes of wireless data in 2025, up 20% from 2024. CTIA also counted nearly $30 billion in operator investment that year, and nearly 16 million Americans subscribed to 5G home service, the core of fixed wireless access in the country. Further capacity is planned, since Congress requires an upper C-band auction by July 4, 2027, with the FCC proposing 100 MHz to 180 MHz, according to PhoneArena. Sub-6 phones stand to benefit most, because that spectrum sits just above the 3.7 to 3.98 GHz band already in use.
How do carrier offers keep handsets affordable?
Carrier financing and plan-led promotions keep handsets within reach for buyers who would otherwise delay a purchase. MacTech reported in May 2026 that carrier financing supported $800-plus phones, while plan-linked promotions helped sub-$300 models in the first quarter. Distribution reach adds volume, as Android Central reported that every major carrier was due to stock the $199 Moto G by Jan. 15, 2026. Network competition also brings new lines, because Verizon recorded 406,000 net postpaid phone additions in the third quarter of 2026, its strongest third quarter in five years. Business buyers receive similar incentives, as T-Mobile offered the $599.99 Galaxy XCover7 Pro free on eligible business lines in May 2025.
Memory costs and foldables are reshaping the handset mix
A shift toward higher entry prices as memory costs climb
Memory inflation is pushing the cheapest phones out of the market and resetting the starting price for American buyers. iClarified reported in August 2026 that sub-$100 smartphone sales fell 64% in the second quarter, as manufacturers stopped shipping such devices or raised prices. Motorola's Moto G increases roughly tripled the market share of the $200 to $299 band from a year earlier, according to the same data. Prepaid sales fell 11% in that quarter, although Samsung and Motorola gained share as carriers promoted Galaxy A and Moto G models. The same report expected average selling prices to keep climbing in the third quarter of 2026, which supports value growth despite softer unit volume.
The rise of satellite links as a mainstream phone feature
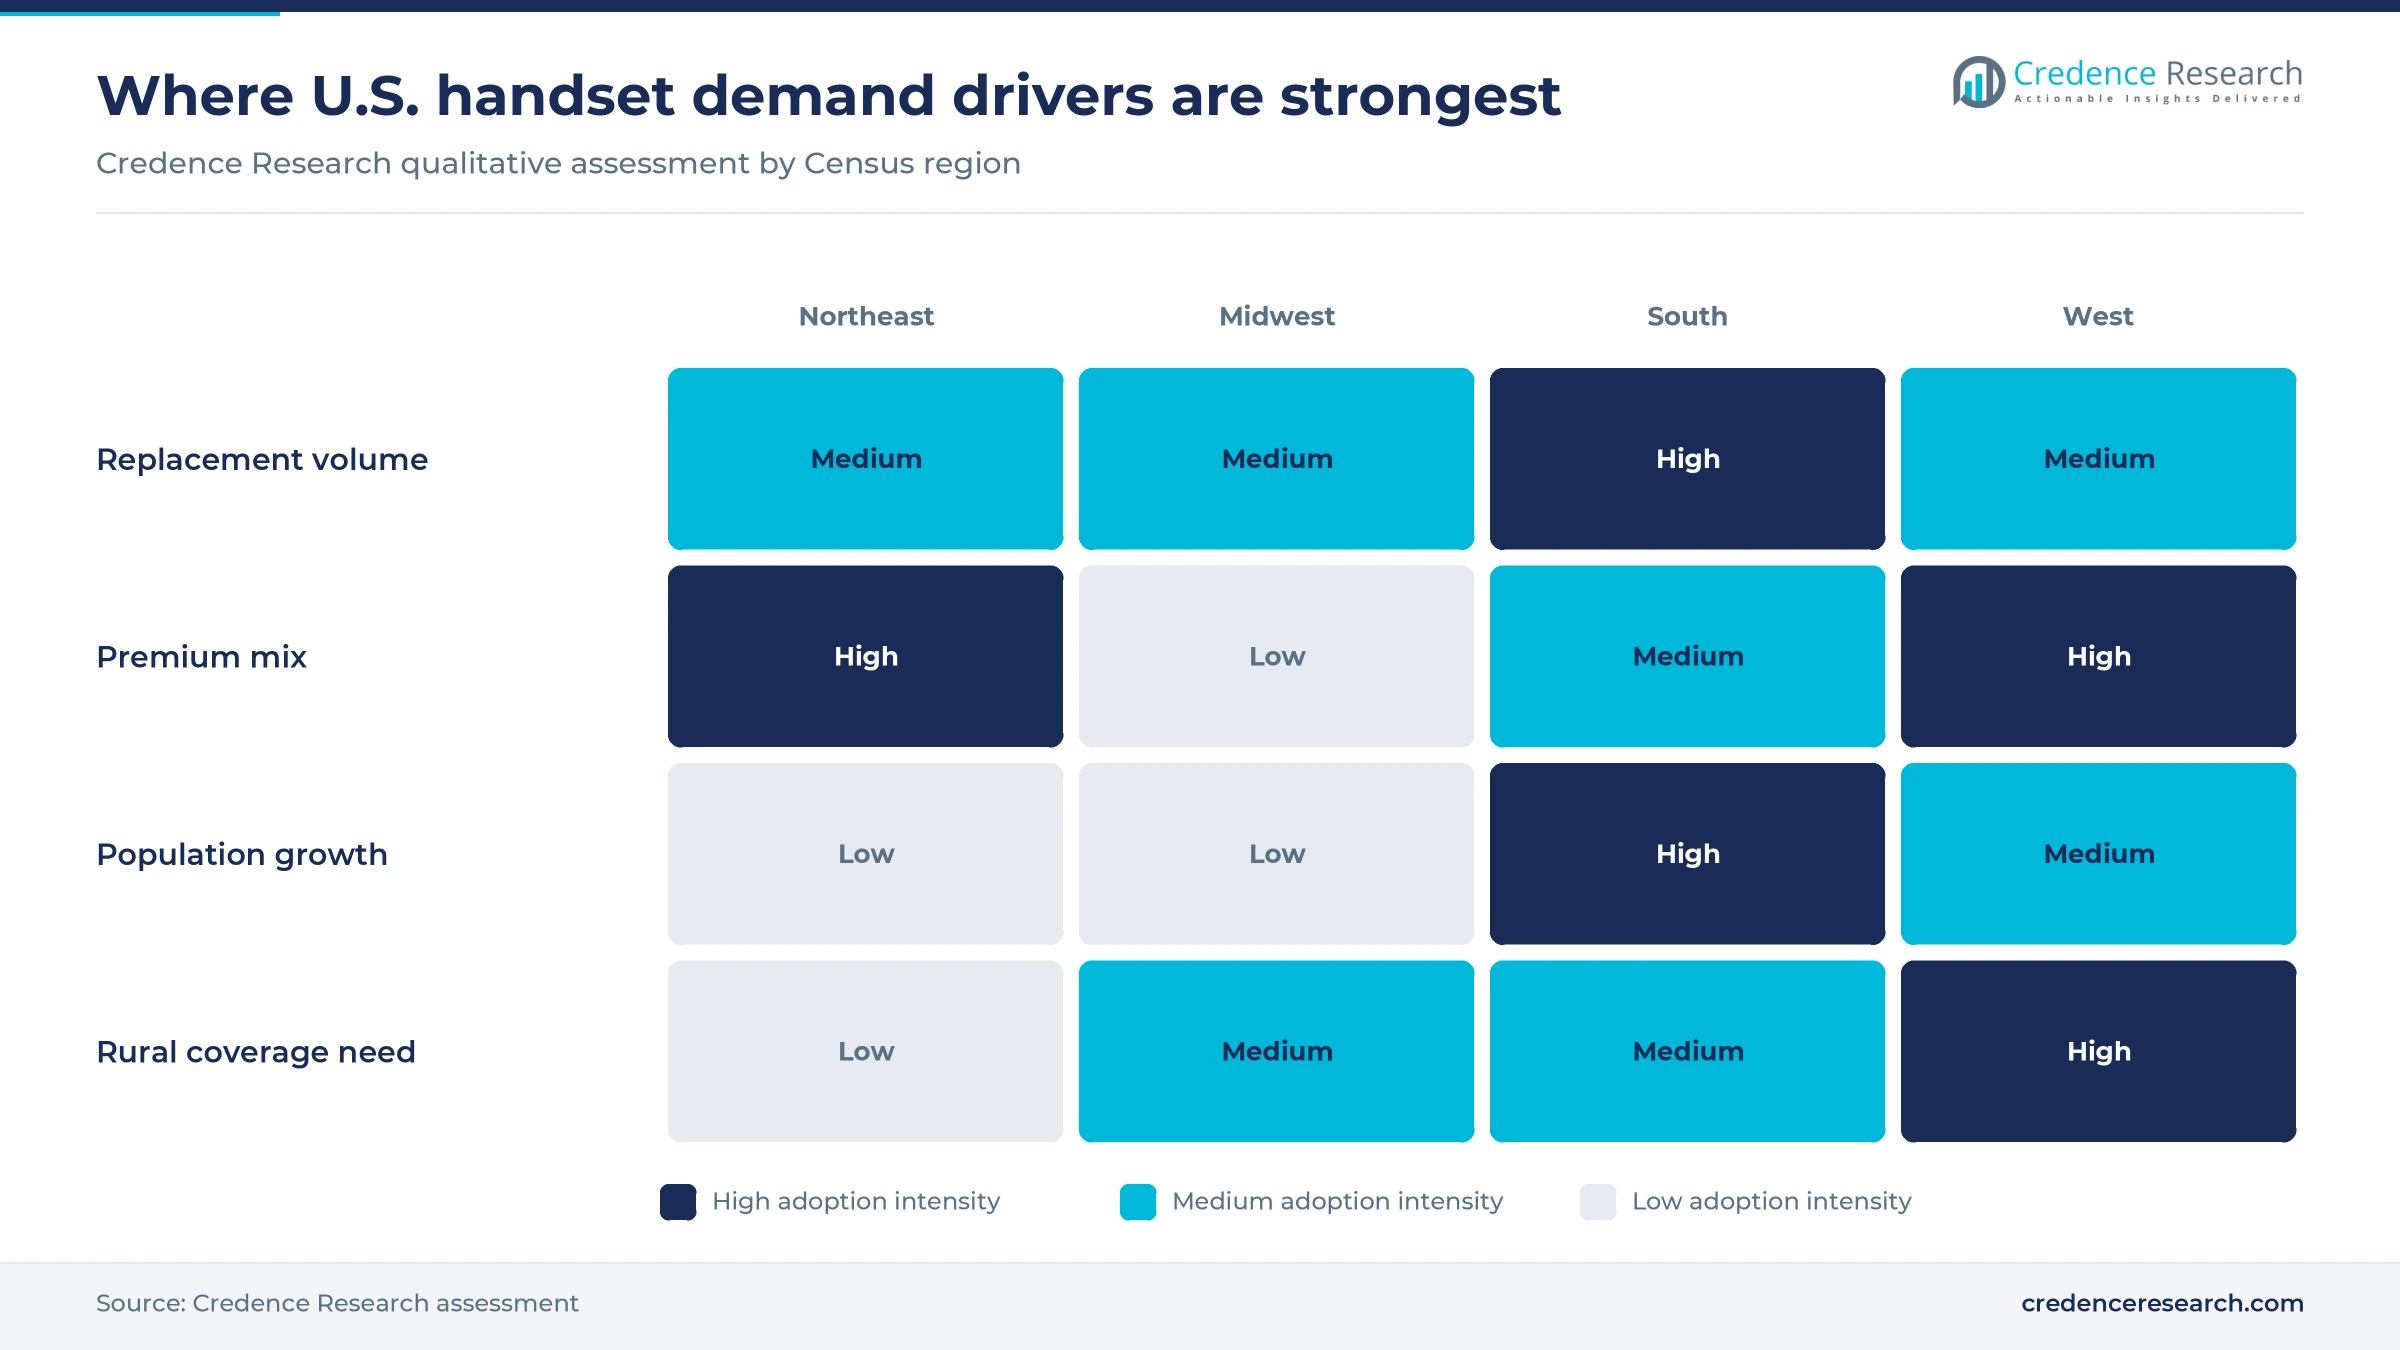
Satellite connectivity is moving from an emergency extra toward a mainstream plan feature for American phone users. T-Mobile opened T-Satellite across the country on July 23, 2025, according to Engadget, and made it free on its Experience Beyond plan. Other users, including AT&T and Verizon customers, can add it for $10 a month, which extends the service beyond one carrier base. Public safety is involved too, because RCR Wireless reported in March 2025 that FirstNet covers nearly 3 million of the country's 3.8 million square miles and is working with AST SpaceMobile on non-terrestrial coverage. Credence Research expects these moves to make coverage a stronger reason to replace older devices in rural parts of the West and Midwest.
An opening for foldables after Apple enters the category
Foldables offer the clearest opening for value growth because each unit sells for far more than a bar phone. Android Authority reported a December 2025 projection of 29.7% worldwide foldable growth for 2026 and an average selling price about three times that of a regular phone. American demand was already visible, as Android Central reported in July 2025 that Galaxy Z Fold7 pre-orders ran nearly 50% ahead of the prior model, while carriers saw a 60% spike. Apple's entry in September 2026 widens the pool of buyers considering the format. Carriers and retailers able to finance these devices can therefore benefit from Foldable Smartphones, which grow at 8.85% a year through the forecast period.
An opening in trade-in credits and certified used devices
Trade-in and used-device supply give sellers a way to serve buyers squeezed by higher list prices. Assurant reported that mobile trade-in programs returned $1.43 billion to U.S. consumers in the second quarter of 2026, while Computer Weekly cited $1.63 billion for the first quarter, up 31% from a year earlier. Those credits lower the net cost of a new device, and returned phones feed the refurbished handset channel. Long retention makes this stock older but larger, as Reviews.org found that Americans now keep phones for 32 months on average, up from 29 months in 2025. Manufacturers are already active, since Android Central saw a certified refurbished Galaxy Z Fold7 listed at $1,699 on Samsung's site.
Long ownership and input costs limit unit recovery
How far can memory costs push handset prices?
Memory costs are the most immediate threat to unit demand, because Computer Weekly reported Assurant saying DRAM and NAND increases were pushing device prices up 7% to 10% in early 2026, with some flagships $100 to $200 higher. Apple warned in mid-2026 that memory costs and supply constraints would worsen in the September quarter. Smaller vendors are most exposed, since iClarified reported sales outside the top four brands falling 45% in the second quarter. Lower-memory configurations and longer installment plans offer only partial relief for budget buyers.
Will longer ownership keep limiting annual sales?
Long ownership cuts the number of sales each year, even with a very large base of users. Verizon CFO Tony Skiadas said at a Morgan Stanley conference in early 2025 that the average upgrade cycle had passed 42 months, and Verizon cited significantly lower upgrade volumes in its Oct. 26, 2026, results. MacTech also reported more selective carrier subsidies in May 2026. Vendors and carriers are responding with trade-in credits and financing, although more selective subsidies leave less room for aggressive offers.
How exposed is handset supply to trade policy?
Supply depends on a few Asian assembly bases, which leaves prices open to trade decisions in Washington. AppleInsider reported that India's share of U.S. smartphone imports rose from 13% to 44% between the second quarters of 2024 and 2025, while China's fell from 61% to 25%. White & Case noted that the Jan. 14, 2026, Section 232 proclamation left broader semiconductor tariffs open for later consideration. Apple's commitment to Corning in Kentucky covers cover glass, so it reduces only part of this exposure.
Can smaller brands keep a foothold?
Vendor concentration limits choice and leaves little room for smaller brands to win carrier shelf space. 01net reported TCL shipments falling 17% to 0.5 million units in the first quarter of 2026, while other small brands fell 28%. HMD Global said on July 11, 2025, that it would scale back its U.S. operations, citing a challenging geopolitical and economic environment. As a result, carriers have fewer low-price alternatives when Moto G and Galaxy A prices rise, and budget buyers may hold their phones for longer.
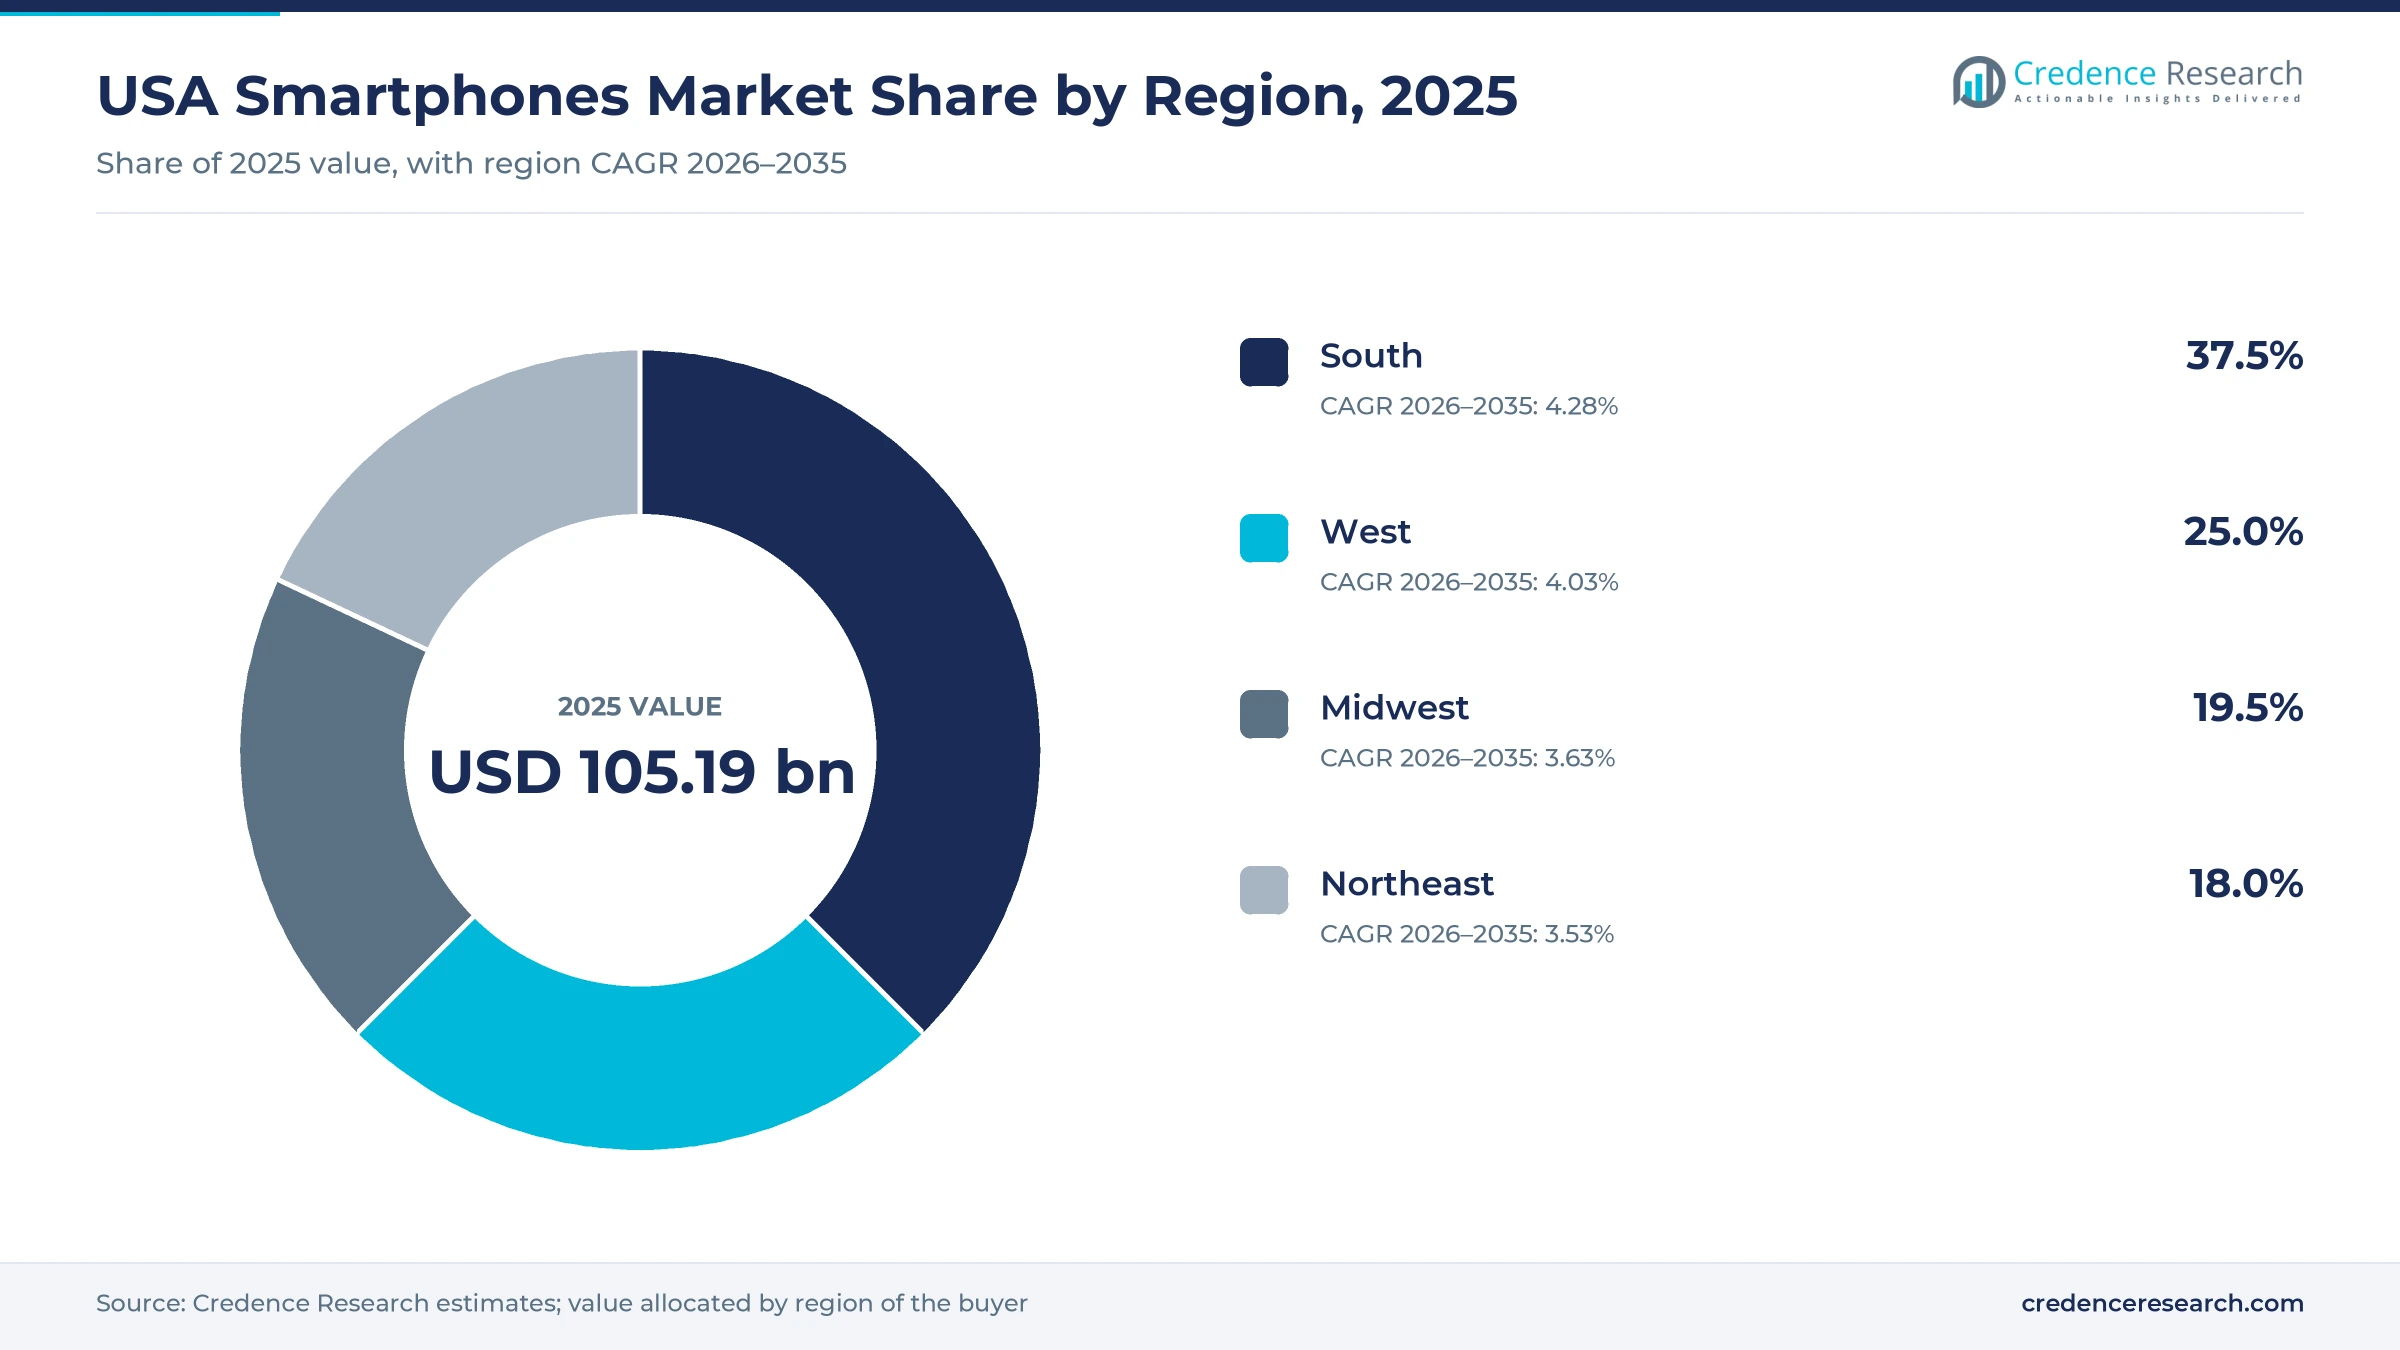
The South leads on population and outlying metro growth
| Region | Value, 2025 (USD billion) | Share, 2025 | CAGR, 2026–2035 |
|---|---|---|---|
| South | 38.24 | 37.5% | 4.28% |
| West | 25.49 | 25.0% | 4.03% |
| Midwest | 19.88 | 19.5% | 3.63% |
| Northeast | 18.35 | 18.0% | 3.53% |
South leads as outlying metro counties keep adding residents
The South held 37.5% of 2025 value and grows at 4.28% a year, the fastest rate among the four regions. U.S. Census Bureau estimates placed 133.8 million residents in the region on July 1, 2025, more than any other zone. The bureau said in June 2026 that all age groups in the South grew faster than elsewhere from 2020 to 2025, driven by outlying metro counties. Local supply has a foothold as well, because Corning's Harrodsburg, Kentucky, plant will make all iPhone cover glass under a $2.5 billion Apple commitment.
West spends above its population share on costlier devices
The West held 25.0% of 2025 value and grows at 4.03% a year, supported by 80.1 million residents in Census Bureau estimates for July 2025. That population equals about 23% of the national total, so the value share runs ahead of headcount, which Credence Research links to a richer device mix. Long distances also favor new coverage tools, since T-Satellite targets areas beyond terrestrial towers. Hawaii adopted a statewide school phone policy on Feb. 12, 2026, according to Ballotpedia, which shows that student limits are spreading here too.
Midwest demand tracks a stable base and new school limits
The Midwest held 19.5% of 2025 value and grows at 3.63% a year, reflecting a large but slower-growing base of 69.8 million residents in Census Bureau estimates. Value share runs slightly below the region's population share of about 20%, which Credence Research links to a more price-sensitive device mix. Policy is also moving quickly here, because Ballotpedia recorded new school phone laws in Michigan on Feb. 10, Indiana on March 5 and Kansas on March 20, 2026, which limit classroom use rather than ownership.
Northeast spends more per person but grows the slowest
The Northeast held 18.0% of 2025 value and grows at 3.53% a year, the slowest rate among the four regions. Census Bureau estimates counted 58.0 million residents in July 2025, the smallest of the zones at about 17% of the national total. Its value share still exceeds that population share, which Credence Research links to higher incomes in the dense corridor markets. New Jersey signed a K-12 phone law on Jan. 8, 2026, according to Ballotpedia, adding to school limits across the country.
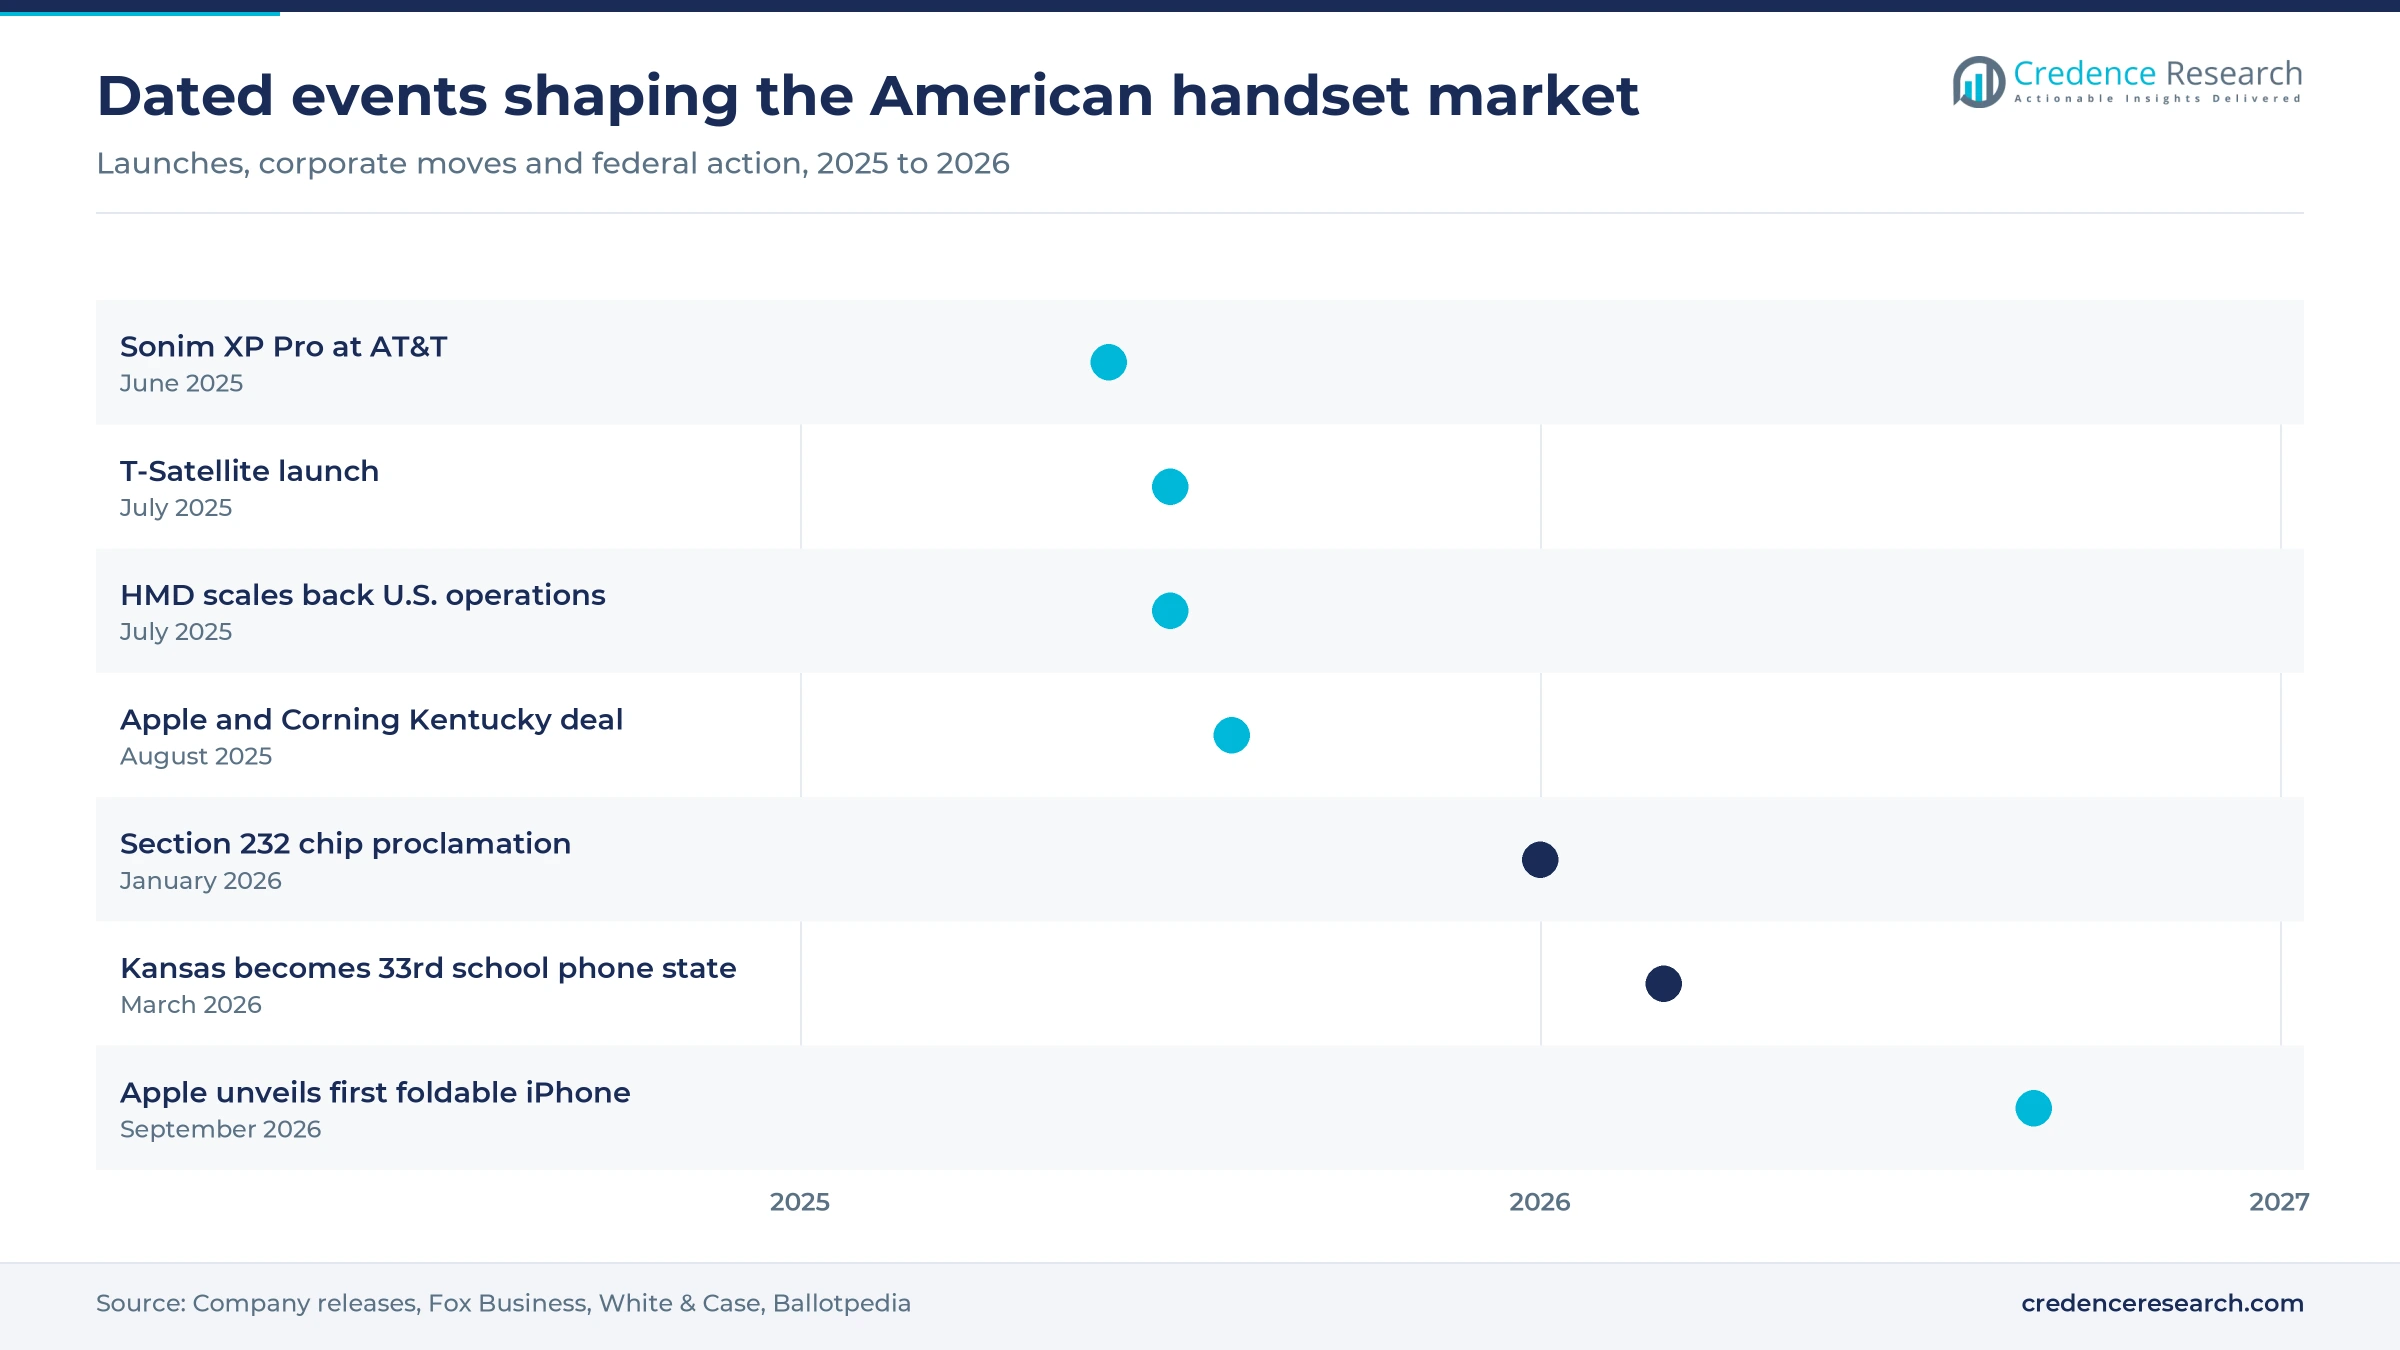
Launches and trade actions reset the market in 2025-2026
| Development | Status and market relevance |
|---|---|
| In June 2025, Sonim put its XP Pro on sale at AT&T for enterprise and FirstNet users, with FirstNet Ready certification. | On sale from June 6, 2025 |
| In July 2025, HMD Global said it would scale back U.S. operations while keeping warranty and service support for products on the market. | Retreat from the U.S. budget tier |
| In August 2025, Apple and Corning said the Harrodsburg, Kentucky, plant would make all iPhone and Apple Watch cover glass. | Corning expects a 50% larger Kentucky workforce |
| In January 2026, a Section 232 proclamation set a 25% tariff on a narrow set of advanced semiconductors from Jan. 15. | Broader chip tariffs remain possible |
| In September 2026, Apple unveiled its first foldable iPhone alongside the iPhone 18 Pro lineup at its fall keynote. | Priced well above the iPhone 18 Pro |
AI features, satellite links and mmwave separate models
- AI features are becoming a baseline for flagship buyers, and Apple listed Apple Intelligence on the iPhone 17 Pro in its Sept. 9, 2025, release while the Consumer Technology Association named AI a defining 2026 theme.
- mmWave radios remain a U.S. feature, as MacRumors reported that the iPhone 17 and iPhone 17 Pro support mmWave only in this country, while the iPhone Air uses sub-6 5G chipsets alone.
- Pro video capture targets creators, since Apple called the iPhone 17 Pro the first smartphone to support ProRes RAW, Log 2 and genlock for synchronized multi-camera shoots.
- Active cooling defines the gaming niche, as T3 reported that the RedMagic 11 Pro launched in the U.S. from $749 with a liquid system, while the Entertainment Software Association says 80% of American players use mobile gaming.
Need a Custom Version of This Report?
Tailor the scope, geography, or segments to your exact requirements.
- Custom geography or segment scope
- Direct access to our analyst team
Apple leads while Samsung and Motorola contest Android
Competition in the USA smartphones market is concentrated among a few brands, and each one defends a different price position. Apple remains the volume leader, with MacTech crediting it with 60% of shipments in the first quarter of 2026. Samsung reached 30% of second-quarter shipments, according to PhoneArena, helped by the Galaxy A17 5G, and early Galaxy S26 pre-orders ran nearly 25% ahead of the S25. Motorola holds about 11% through Moto G models sold across prepaid and postpaid brands. Google stayed near 3% of first-quarter 2026 shipments, according to MacTech. TCL competes at the low end, while specialists such as Sonim serve public safety buyers. HMD Global has scaled back, which leaves its budget volume open to the larger vendors.
Companies profiled and their roles in this market
| Company | Type | Role in the market |
|---|---|---|
| Apple Inc. | Platform owner and vendor | Volume leader, iPhone 17 and 18 lines, first foldable iPhone, Corning glass commitment in Kentucky |
| Samsung Electronics Co., Ltd. | Android vendor | Galaxy A17 5G, Galaxy S26, Galaxy Z Fold7 and XCover7 Pro for business lines |
| Motorola Mobility LLC | Android vendor | Moto G and Moto G Play at $199 and $169.99, stocked widely across carrier brands |
| Google LLC | Android platform owner and vendor | Pixel 10 and Pixel 11 lines, a small share of 2026 shipments |
| TCL Communication Technology Holdings Limited | Value Android vendor | Low-end phones, 0.5 million units in the first quarter of 2026 |
| HMD Global Oy | Value vendor, scaling back | U.S. operations reduced from July 2025, with warranty and service support kept |
Value should outrun units as buyers trade up less often
Credence Research's view is that the USA smartphones market has become a pricing and timing story rather than a user-growth story. Ownership has stopped rising, shipments fell in the first quarter of 2026, and phones are staying in pockets for longer. Value still grows because each sale carries a richer mix, from foldables to AI-ready flagships, and because financing hides part of the increase from buyers. The most important variable to watch is carrier subsidy policy, since a sharper pullback would expose higher list prices directly. Vendors with strong trade-in programs are best placed to protect their replacement volume.
How the U.S. handset value estimate was built
The report uses 2025 as the base year and 2035 as the forecast year, and market values come from the Credence Research model. The 2025 estimate was checked against unit shipments multiplied by a blended realized price. Segment and regional splits are Credence Research estimates informed by public records. Sources are public statistics, regulator and federal documents, company releases, survey publishers and named trade publications, and no interviews or surveys were conducted for this report.
Price mix and foldables shape the path to 2035
The USA smartphones market is expected to reach USD 150.41 billion by 2035 at a 3.96% CAGR, as higher prices offset softer units in 2026. Growth should firm once memory costs ease and buyers with four-year-old devices return, with the upper C-band auction adding network capacity after 2027. Foldable Smartphones should gain the most share from a small base, and the South should remain the largest and fastest region. The main uncertainty is whether carriers keep funding upgrades and whether broader chip tariffs reach finished handsets.
Frequently Asked Questions
How big is the USA smartphones market?
What drives growth in the American handset market?
Which product type is largest?
Which product type grows fastest?
Which channel leads handset sales?
Which region holds the largest share?
Who are the leading companies?
What are the main risks to the forecast?
Table of Content
Chapter 1 Market Segmentation
- 1.1 Segmentation Framework
- 1.1.1 Product and Service Classification
- 1.1.2 Application and End-Use Classification
- 1.1.3 Technology and Solution Classification
- 1.1.4 Customer and Distribution Channel Classification
- 1.1.5 Geographic Segmentation
- 1.1.6 Market Segment Definitions and Boundaries
- 1.2 By Product Type
- 1.2.1 Standard Bar Smartphones
- 1.2.2 Foldable Smartphones
- 1.2.3 Rugged Smartphones
- 1.2.4 Gaming Smartphones
- 1.3 By End User
- 1.3.1 Individual Consumers
- 1.3.2 Corporate-Liable Users
- 1.3.3 Government and Public Safety
- 1.3.4 Education Users
- 1.4 By Price Tier
- 1.4.1 Entry Smartphones Below USD 300
- 1.4.2 Mid-Range Smartphones USD 300-599
- 1.4.3 Premium Smartphones USD 600-999
- 1.4.4 Ultra-Premium Smartphones USD 1,000 and Above
Chapter 2 Introduction
- 2.1 Report Objectives and Scope
- 2.2 Product Definition and Industry Terminology
- 2.3 Market Inclusions and Exclusions
- 2.4 Research Process
- 2.4.1 Primary Research and Expert Interviews
- 2.4.2 Secondary Research and Source Review
- 2.4.3 Top-Down and Bottom-Up Estimation
- 2.4.4 Data Triangulation and Verification
- 2.5 Market Size Measurement Basis
- 2.5.1 2025: USD 101.96 billion → 2035: USD 150.41 billion
- 2.6 Historical and Forecast Reference Periods
- 2.6.1 Historical Period: 2018-2025
- 2.6.2 Base Year: 2025
- 2.6.3 Forecast Period: 2025-2035
- 2.7 Research Assumptions and Limitations
Chapter 3 Executive Summary
- 3.1 Market Snapshot and Key Findings
- 3.2 Base-Year Market Size, 2025
- 3.3 Forecast Market Size, 2035
- 3.4 Revenue and Volume Growth Outlook
- 3.5 Key Demand and Supply Indicators
- 3.6 Leading Market Segments
- 3.7 Fastest-Growing Market Opportunities
- 3.8 Regional Performance Highlights
- 3.9 Technology and Industry Transformation
- 3.10 Competitive Landscape Summary
- 3.11 Analyst View and Strategic Implications
Chapter 4 USA Smartphones Market Trends and Developments
- 4.1 Historical Industry Development, 2018-2025
- 4.2 Recent Market Trends and Developments
- 4.3 Demand and Customer Behavior Trends
- 4.4 Technology and Product Innovation
- 4.5 Artificial Intelligence, Automation and Digitalization
- 4.6 Local Manufacturing and Supply Chain Realignment
- 4.7 Industry Partnerships, Mergers and Acquisitions
- 4.8 Sustainability and Circular Economy Developments
- 4.9 Government and Private Sector Investment Trends
- 4.10 Emerging Business Models and Commercialization
- 4.11 Industry Developments and Announcements
Chapter 5 USA Smartphones Market Production, Supply and Demand Analysis
- 5.1 Demand Trend and Consumption Analysis, 2018-2025
- 5.2 Demand Forecast, 2025-2035
- 5.3 Production and Output Trend, 2018-2025
- 5.4 Production and Output Forecast, 2025-2035
- 5.5 Installed Capacity and Capacity Utilization
- 5.6 Company-Wise Production Plants and Statistics
- 5.6.1 Installed Production Capacity
- 5.6.2 Actual Production
- 5.6.3 Planned Capacity and Expansion Targets
- 5.7 Supply Chain Structure and Procurement Trends
- 5.8 Supply-Demand Gap and Bottlenecks
- 5.9 Import Dependence and Sourcing Structure
- 5.10 Contract Manufacturing and Outsourcing
- 5.11 Regional Supply and Demand Concentration
Chapter 6 USA Smartphones Market Pricing Analysis
- 6.1 Pricing Structure and Measurement
- 6.2 Historical Pricing Trends, 2018-2025
- 6.3 Pricing Outlook, 2025-2035
- 6.4 Average Selling Price and Unit Economics
- 6.5 Pricing by Product and Market Segment
- 6.6 Geographic Pricing Differences
- 6.7 Key Input, Energy, Labor and Logistics Costs
- 6.8 Contract Pricing and Purchasing Models
- 6.9 Pricing Sensitivity and Competitive Positioning
- 6.10 Price, Margin and Profitability Implications
Chapter 7 USA Smartphones Market Dynamics
- 7.1 Market Growth Drivers
- 7.1.1 Demand-Side Drivers
- 7.1.2 Technology and Innovation Drivers
- 7.1.3 Infrastructure and Investment Drivers
- 7.1.4 Regulatory and Policy Drivers
- 7.2 Market Restraints
- 7.2.1 Cost and Affordability Constraints
- 7.2.2 Technology and Adoption Barriers
- 7.2.3 Supply Chain and Operational Constraints
- 7.3 Market Challenges
- 7.3.1 Competitive Pressure and Margin Erosion
- 7.3.2 Skills, Infrastructure and Implementation Gaps
- 7.4 Emerging Market Opportunities
- 7.5 Market Dynamics Impact and Time-Horizon Assessment
Chapter 8 USA Smartphones Value Chain Analysis
- 8.1 Industry Value Chain Overview
- 8.2 Upstream Suppliers and Critical Inputs
- 8.3 Technology and Component Providers
- 8.4 Manufacturing or Service Delivery
- 8.5 Distribution, Channel Partners and Integrators
- 8.6 Downstream Applications and End Users
- 8.7 Value Addition and Profit Pools
- 8.8 Vertical Integration and Outsourcing
- 8.9 Supplier Concentration and Risk
- 8.10 Supply Chain Localization and Resilience
Chapter 9 USA Smartphones Market Regulations and Policies
- 9.1 Relevant Laws, Standards and Compliance Frameworks
- 9.2 Product, Service, Safety and Quality Requirements
- 9.3 Government Policies, Incentives and Subsidies
- 9.4 Imports, Exports and Trade Barriers
- 9.5 Public Procurement and Local Content Requirements
- 9.6 Environmental and Sustainability Compliance
- 9.7 Data Protection, AI and Cybersecurity Compliance
- 9.8 Upcoming Policy Changes and Market Implications
Chapter 10 USA Smartphones Market Hotspots and Opportunities
- 10.1 Market Opportunity Mapping and Growth Hotspots
- 10.2 High-Growth Applications and Customer Groups
- 10.3 Underserved Markets and White-Space Opportunities
- 10.4 Emerging Technology and Product Opportunities
- 10.5 New Capacity and Investment Hotspots
- 10.6 Market Entry and Expansion Opportunities
- 10.7 Distribution and Partnership Opportunities
- 10.8 Near-Term and Long-Term Commercial Potential
- 10.9 Opportunity Attractiveness and Execution Risks
Chapter 11 USA Smartphones Market Outlook, 2025-2035
- 11.1 Market Size and Analysis
- 11.1.1 Revenue (Market Measurement: 2025: USD 101.96 billion → 2035: USD 150.41 billion)
- 11.1.2 Market Volume and Quantity Sold
- 11.1.3 Historical Market Size, 2018-2025
- 11.1.4 Base-Year Market Size, 2025
- 11.2 Market Forecast, 2025-2035
- 11.2.1 Revenue Forecast to 2035
- 11.2.2 Volume Forecast to 2035
- 11.2.3 CAGR and Year-on-Year Growth
- 11.2.4 Incremental Revenue Opportunity
- 11.3 Forecast Assumptions and Scenario Analysis
- 11.3.1 Base-Case Forecast
- 11.3.2 Optimistic and Conservative Scenarios
- 11.3.3 Technology, Pricing and Policy Sensitivities
- 11.4 Market Attractiveness and Growth Outlook
Chapter 12 USA Smartphones Market Segmentation and Outlook
- 12.1 Segmentation Summary and Market Shares, 2025
- 12.2 Largest and Fastest-Growing Segments
- 12.3 By Product Type - Market Size and Forecast, 2025-2035
- 12.3.1 Segment Definition and Scope
- 12.3.2 Historical Market Size, 2018-2025
- 12.3.3 Revenue Forecast, 2025-2035
- 12.3.4 Volume Forecast, 2025-2035
- 12.3.5 Base-Year Market Share, 2025
- 12.3.6 Segment CAGR and Growth Drivers
- 12.3.7 Subsegment Market Size and Forecast
- 12.3.7.1 Standard Bar Smartphones
- 12.3.7.2 Foldable Smartphones
- 12.3.7.3 Rugged Smartphones
- 12.3.7.4 Gaming Smartphones
- 12.3.8 Subsegment Pricing and Adoption Trends
- 12.3.9 Leading Suppliers and Competition
- 12.3.10 Regional Demand and Opportunities
- 12.4 By End User - Market Size and Forecast, 2025-2035
- 12.4.1 Segment Definition and Scope
- 12.4.2 Historical Market Size, 2018-2025
- 12.4.3 Revenue Forecast, 2025-2035
- 12.4.4 Volume Forecast, 2025-2035
- 12.4.5 Base-Year Market Share, 2025
- 12.4.6 Segment CAGR and Growth Drivers
- 12.4.7 Subsegment Market Size and Forecast
- 12.4.7.1 Individual Consumers
- 12.4.7.2 Corporate-Liable Users
- 12.4.7.3 Government and Public Safety
- 12.4.7.4 Education Users
- 12.4.8 Subsegment Pricing and Adoption Trends
- 12.4.9 Leading Suppliers and Competition
- 12.4.10 Regional Demand and Opportunities
- 12.5 By Price Tier - Market Size and Forecast, 2025-2035
- 12.5.1 Segment Definition and Scope
- 12.5.2 Historical Market Size, 2018-2025
- 12.5.3 Revenue Forecast, 2025-2035
- 12.5.4 Volume Forecast, 2025-2035
- 12.5.5 Base-Year Market Share, 2025
- 12.5.6 Segment CAGR and Growth Drivers
- 12.5.7 Subsegment Market Size and Forecast
- 12.5.7.1 Entry Smartphones Below USD 300
- 12.5.7.2 Mid-Range Smartphones USD 300-599
- 12.5.7.3 Premium Smartphones USD 600-999
- 12.5.7.4 Ultra-Premium Smartphones USD 1,000 and Above
- 12.5.8 Subsegment Pricing and Adoption Trends
- 12.5.9 Leading Suppliers and Competition
- 12.5.10 Regional Demand and Opportunities
- 12.6 Segment Growth Comparison
- 12.7 Segment Attractiveness and Priority Matrix
Chapter 13 USA Smartphones End-Use and Application Market Outlook
- 13.1 End-Use Industry and Customer Demand Structure
- 13.2 Leading Applications and Customer Groups
- 13.3 End-Use Market Size, Share and Forecast
- 13.4 Major End-Use Industry Deep Dives
- 13.4.1 Customer Requirements and Use Cases
- 13.4.2 Demand and Replacement Cycles
- 13.4.3 Technical and Regulatory Considerations
- 13.4.4 Purchasing and Procurement Models
- 13.4.5 Leading Vendors and Distribution Channels
- 13.4.6 Forecast and Commercial Opportunities
- 13.5 Emerging Applications and Cross-Segment Demand
- 13.6 End-Use Industry Investment Priorities
Chapter 14 USA Smartphones Geographic Market Outlook, 2025-2035
- 14.1 Domestic Market Distribution and Demand Clusters
- 14.2 State- or Province-Wise Market Size and Forecast, 2025-2035
- 14.3 City and Metropolitan Market Outlook
- 14.4 Industrial, Manufacturing and Commercial Clusters
- 14.5 Geographic Concentration of Key End Users
- 14.6 Local Pricing and Purchasing Differences
- 14.7 Domestic Production Facilities and Capacity Map
- 14.8 Local Infrastructure and Project Pipeline
- 14.9 State-Level Policy and Incentive Differences
- 14.10 Subnational Investment Hotspots and Opportunities
- 14.11 Distribution and Logistics Networks
- 14.12 Domestic Competitive Footprint
Chapter 15 USA Smartphones Technology, Innovation and Sustainability Outlook
- 15.1 Technology Landscape and Maturity
- 15.2 Product, Process and Service Innovation
- 15.3 AI, Automation and Digital Tools in the Industry
- 15.4 Technology Adoption and Performance Benchmarking
- 15.5 Innovation Pipeline and R&D Investment
- 15.6 Patent and Intellectual Property Trends
- 15.7 Energy Efficiency and Resource Management
- 15.8 Sustainability, Recycling and Circularity
- 15.9 Technology Roadmap, 2025-2035
- 15.10 Risks of Obsolescence and Technology Substitution
Chapter 16 USA Smartphones Market Key Strategic Imperatives
- 16.1 Growth and Market Entry Priorities
- 16.2 High-Return Products and Segments
- 16.3 Pricing, Profitability and Cost Optimization
- 16.4 Technology Investment and Product Differentiation
- 16.5 Supply Chain Localization and Resilience
- 16.6 Distribution and Customer Acquisition
- 16.7 Partnership, Acquisition and Capacity Strategy
- 16.8 Regional Expansion Priorities
- 16.9 Short-, Medium- and Long-Term Actions
Chapter 17 Competition Outlook
- 17.1 Industry Competition Characteristics
- 17.2 Market Structure and Concentration
- 17.3 Market Share and Competitive Positioning, 2025
- 17.4 Company-Wise Revenue and Product Benchmarking
- 17.5 Production and Service Capacity Benchmarking
- 17.6 Technology, Pricing and Differentiation
- 17.7 Regional Footprint and Distribution Strength
- 17.8 Mergers, Acquisitions and Strategic Alliances
- 17.9 New Entrants and Competitive Threats
- 17.10 Porter's Five Forces and Industry Attractiveness
- 17.11 Competitive Outlook, 2025-2035
Chapter 18 Company Profiles
- 18.1 Company Coverage and Selection Criteria
- 18.2 Apple Inc.
- 18.2.1 Business Description
- 18.2.2 Company Ownership and Geographic Presence
- 18.2.3 Product and Service Portfolio
- 18.2.4 Manufacturing and Operating Footprint
- 18.2.5 Production Capacity and Expansion Plans
- 18.2.6 Financial Performance and Investment
- 18.2.7 Market Share and Competitive Position
- 18.2.8 Technology and Innovation Capabilities
- 18.2.9 Strategic Alliances or Partnerships
- 18.2.10 Recent Developments
- 18.2.11 Growth Strategy and Outlook
- 18.3 Samsung Electronics Co., Ltd.
- 18.4 Motorola Mobility LLC
- 18.5 Google LLC
- 18.6 TCL Communication Technology Holdings Limited
- 18.7 HMD Global Oy
- 18.8 Other Relevant Market Participants
Note: Every listed company is profiled on the structure shown under the first company. The company list is preliminary and may change based on research findings, market developments, data availability and client requirements.
Chapter 19 Disclaimer
- 19.1 Research and Forecast Disclaimer
- 19.2 Data Source and Estimation Limitations
Note: The depth of individual sections depends on data availability for this market. Volume, capacity, trade and other unit-based metrics are included where applicable.

