
Hard twists anchor demand as filled formats gain ground
The North America pretzel market was valued at USD 2.09 billion in 2025 and is projected to increase from USD 2.20 billion in 2026 to USD 3.35 billion by 2035, registering a CAGR of 4.78% during 2026–2035. Demand comes from household snacking, soft pretzels served at stadiums and malls, and flavor launches that bring shoppers back to the salty aisle. The United States held the largest share, 87.5% in 2025, because retail and venue demand are both well established there. Mexico is the fastest-growing country at 6.26% a year as chains such as Auntie Anne’s open their first Mexican units and OXXO adds baked pretzels in Monterrey. The main commercial change is the challenge from Dot’s Homestyle Pretzels, which Food Dive reported in October 2026 held 23% of the U.S. category. Hershey and Utz Brands have also added filled, buffalo and protein lines, while PepsiCo’s February 2026 snack price cuts raise pressure on mainstream shelf prices.
What does the North America pretzel market include and how is it bought?
The market counts hard pretzels, pretzel crisps and thins, soft pretzels and filled and coated pretzels sold to households, foodservice operators and institutional buyers in the United States, Canada and Mexico. Households buy mostly through grocery, club and convenience stores, while operators buy soft pretzels through foodservice supply for stadiums, theaters, malls and schools. Credence Research states the market at producer and supplier value, which is why it sits below the shelf-price sales tracked at U.S. retail.
The estimate excludes pretzel-flavored confectionery and snack mixes in which pretzels are a minor ingredient, along with bakers’ flour and seasoning sold upstream. The value chain runs from flour millers and seasoning houses through brand owners and contract bakers such as Pretzels Inc., Hershey’s co-manufacturing unit, to direct-store routes, wholesalers and foodservice distributors.
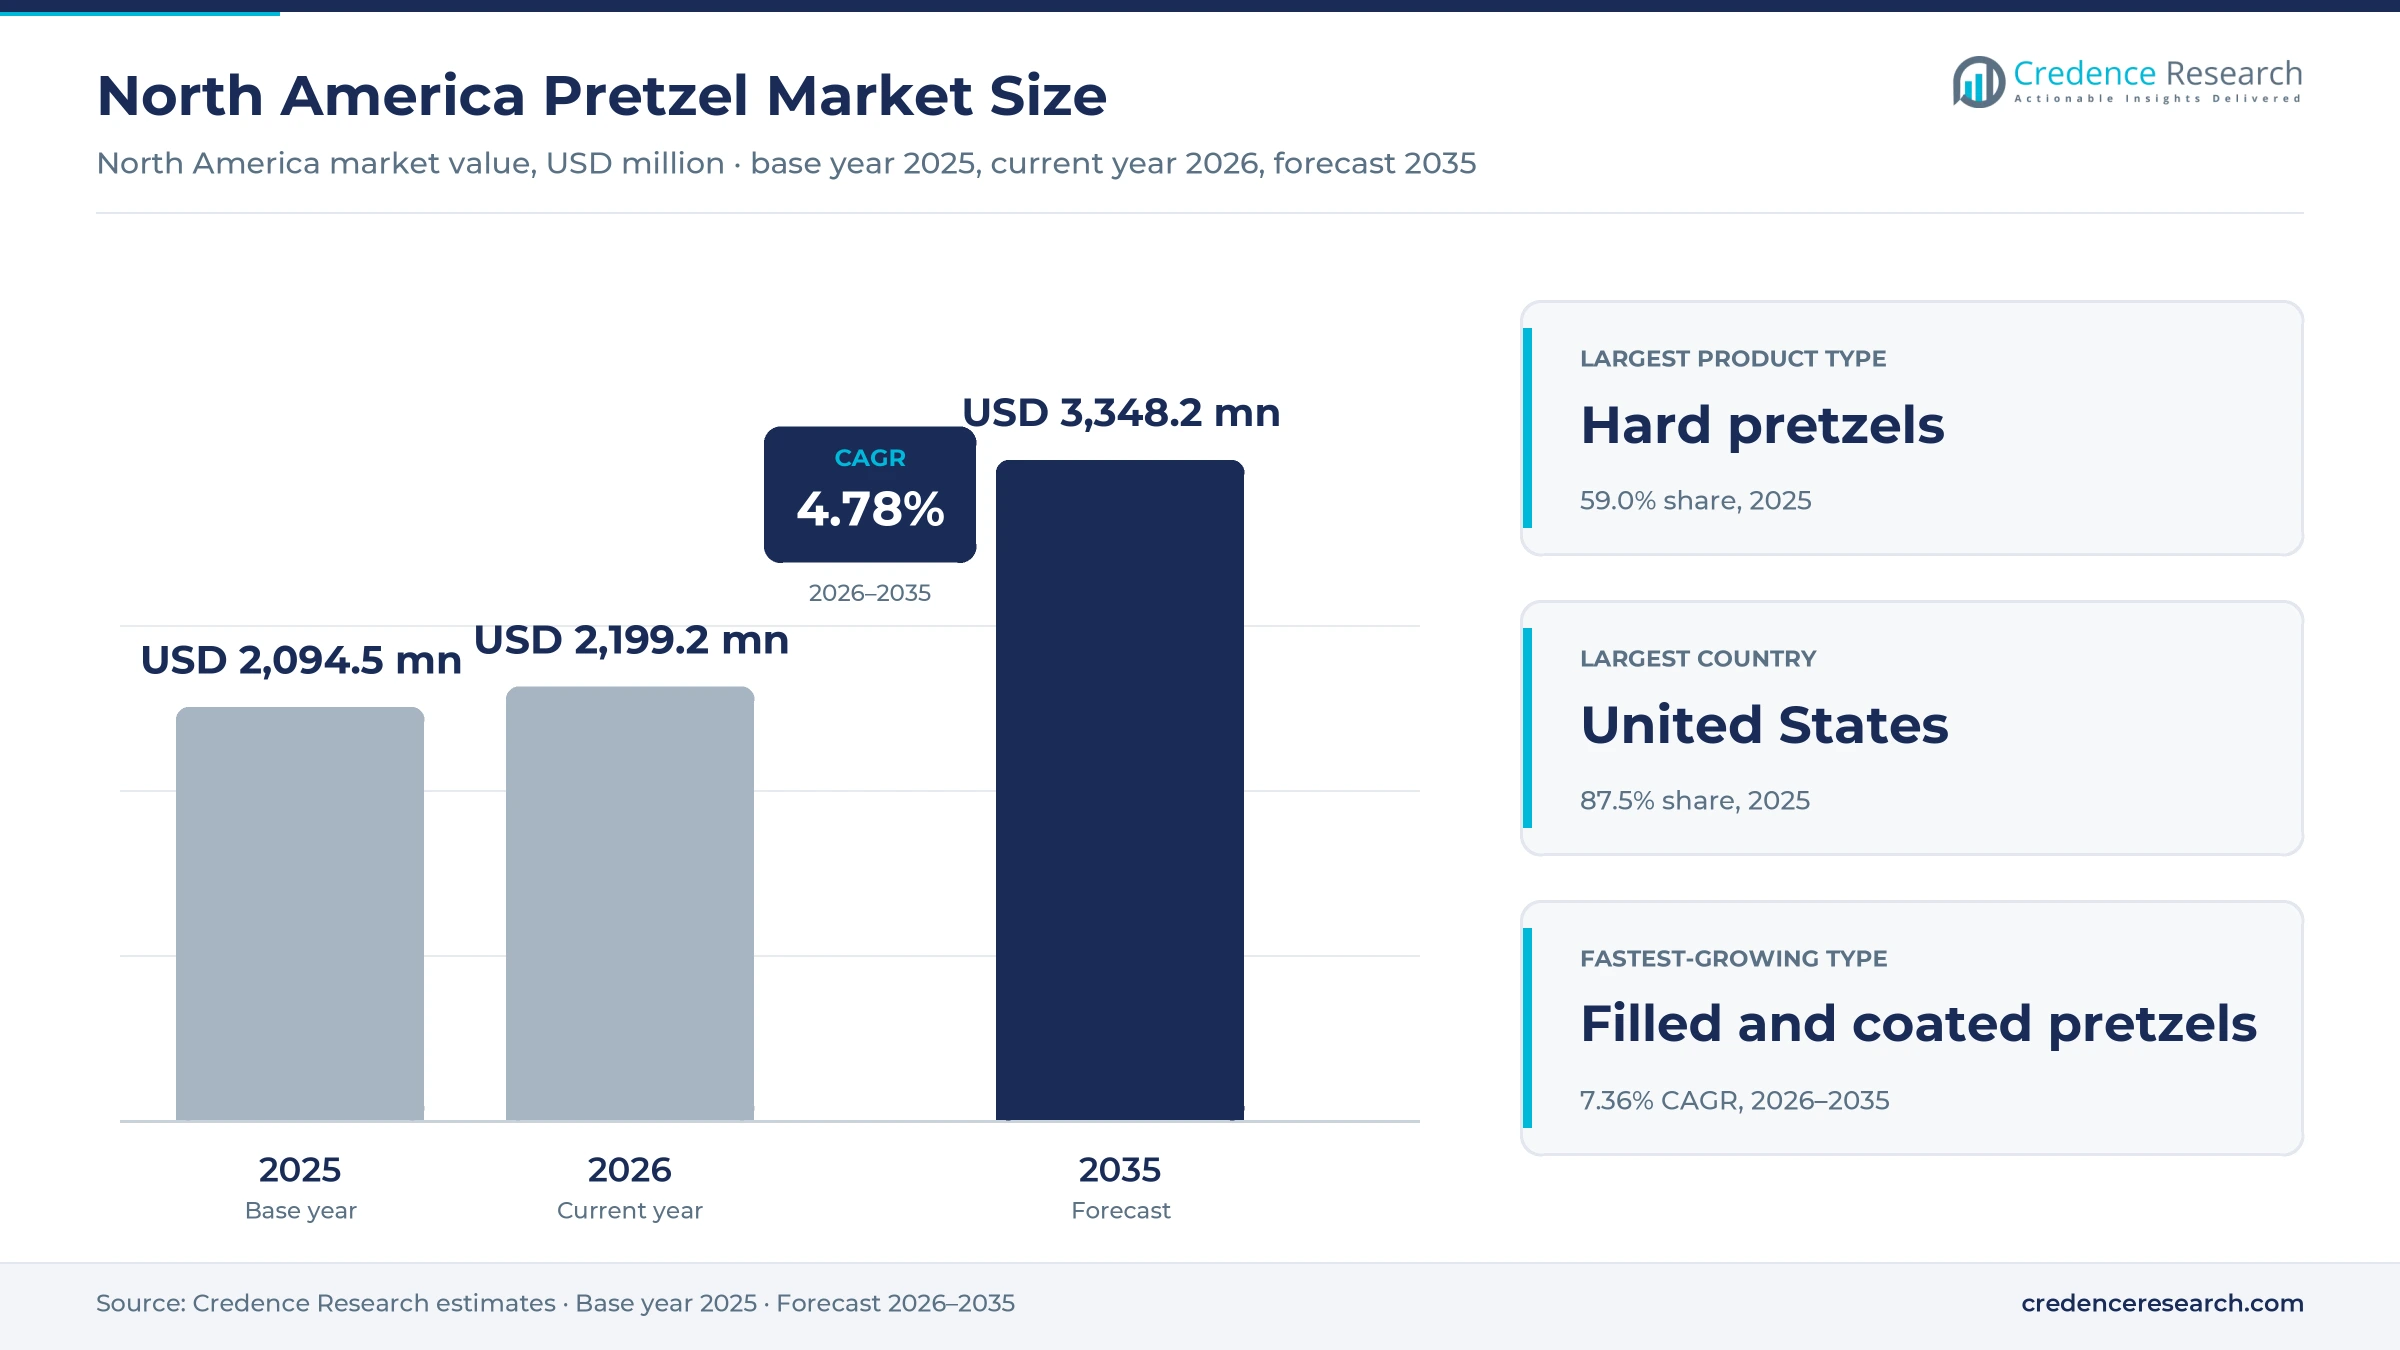
North America Pretzel Market Insights
- The North America pretzel market was valued at USD 2.09 billion in 2025 and is projected to reach USD 3.35 billion by 2035, a 4.78% CAGR during 2026–2035.
- The United States held 87.5% of 2025 value, supported by tracked U.S. retail pretzel sales of $2.9 billion in the 52 weeks to Dec. 28, 2025.
- Hard pretzels led product types with 59.0% of 2025 value, while grocery and club retail led channels with 66.0% of 2025 value.
- Pretzel dollar sales listed under the Hershey name, separately from Dot’s, rose 546% in the year to March 22, 2026, after Reese’s filled pretzels launched in April 2025, according to Food Business News.
- Dot’s held 23% of the U.S. pretzel category by October 2026 and grew 9.3% against 2.5% for the category, widening its contest with Snyder’s of Hanover.
Hard pretzels lead while filled formats grow fastest
Why do hard pretzels lead while filled pretzels grow fastest?
Based on product type, the market is categorized into hard pretzels, pretzel crisps and thins, soft pretzels and filled and coated pretzels. Hard pretzels led with 59.0% of 2025 value because twists, rods and sticks anchor the salty aisle, and Food Business News shows pretzel units rising 1.2% in the 52 weeks to March 22, 2026. Filled and coated pretzels grow fastest at 7.36% a year as the same report shows pretzel dollar sales listed under the Hershey name, separately from Dot’s, up 546% over the same weeks, following the April 2025 launch of Reese’s filled pretzels.
Which price tier holds the most value and which is gaining?
Based on price tier, the market is categorized into value, mainstream and premium products. Mainstream led with 58.0% of 2025 value because national brands dominate the shelf, and Retail figures reported by Snack Food & Wholesale Bakery in March 2026 place Dot’s, Snyder’s-Lance and Utz at about 48% of U.S. retail dollars. Premium grows fastest at 5.73% a year as private label, the main value tier, slipped 1.2% to $519.3 million while the average pretzel purchase price rose 2%. Uncle Jerry’s co-owner Misty Skolnick told the same publication that shoppers are moving away from cheap, mass-produced options.
How do retail, online and foodservice channels compare?
Based on distribution channel, the market is categorized into grocery and club retail, convenience and specialty retail, e-commerce and foodservice supply. Grocery and club retail led with 66.0% of 2025 value because direct-store delivery gives brands wide reach, and Utz Brands’ fiscal 2025 annual report counts about 2,500 routes serving more than 84,700 stores. E-commerce grows fastest at 7.30% a year as the U.S. Census Bureau reported online sales up 12.2% in the year to the second quarter of 2026, and Food Business News lists Amazon among the outlets for Meir Bagel’s protein pretzels.
Why do bags dominate and where are multipacks gaining?
Based on packaging format, the market is categorized into flexible bags, cartons and multipacks, rigid containers and bulk and unpackaged supply. Flexible bags led with 64.0% of 2025 value because bags are the standard retail pack, and Utz Brands names flexible films as primary flexible packaging in its fiscal 2025 annual report. Cartons and multipacks grow fastest at 6.47% a year as Hershey’s Natalie Perera told Snack Food & Wholesale Bakery in July 2025 that multipacks are the fastest-growing pack type in salty snacks, and Food Business News reported in September 2026 that Campbell’s will focus its back-to-school campaign on multipacks.
| Segment Group | Leading Sub-segment | Share, 2025 | Fastest-growing Sub-segment | CAGR, 2026–2035 |
|---|---|---|---|---|
| By Product Type | Hard pretzels | 59.0% | Filled and coated pretzels | 7.36% |
| By Price Tier | Mainstream | 58.0% | Premium | 5.73% |
| By Distribution Channel | Grocery and club retail | 66.0% | E-commerce | 7.30% |
| By Packaging Format | Flexible bags | 64.0% | Cartons and multipacks | 6.47% |
Request a Free Sample
Fill in your details and we'll send you a free sample report.
- Sample data tables & charts
- Research methodology
Unit growth and soft pretzel foodservice lift demand
Established category demand and physical consumption
Pretzels keep gaining physical volume while the wider aisle stalls, which gives the category an unusually sound base. Snack Food & Wholesale Bakery reported U.S. pretzel dollar sales up 3.9% to $2.9 billion in the 52 weeks to Dec. 28, 2025, with average price up 2% and units up 1.8%. By contrast, total salty snacks fell 0.2% to $42.5 billion, and units dropped 0.1%, across the same weeks. Pretzels therefore hold about 6.8% of that savory snack spending and are adding units, not only price. Earlier retail data for the 52 weeks to May 18, 2025, also showed household demand holding, with purchase frequency up 1.8%. As a result, the United States remains the anchor of regional demand.
Foodservice soft-pretzel demand from venues and chains
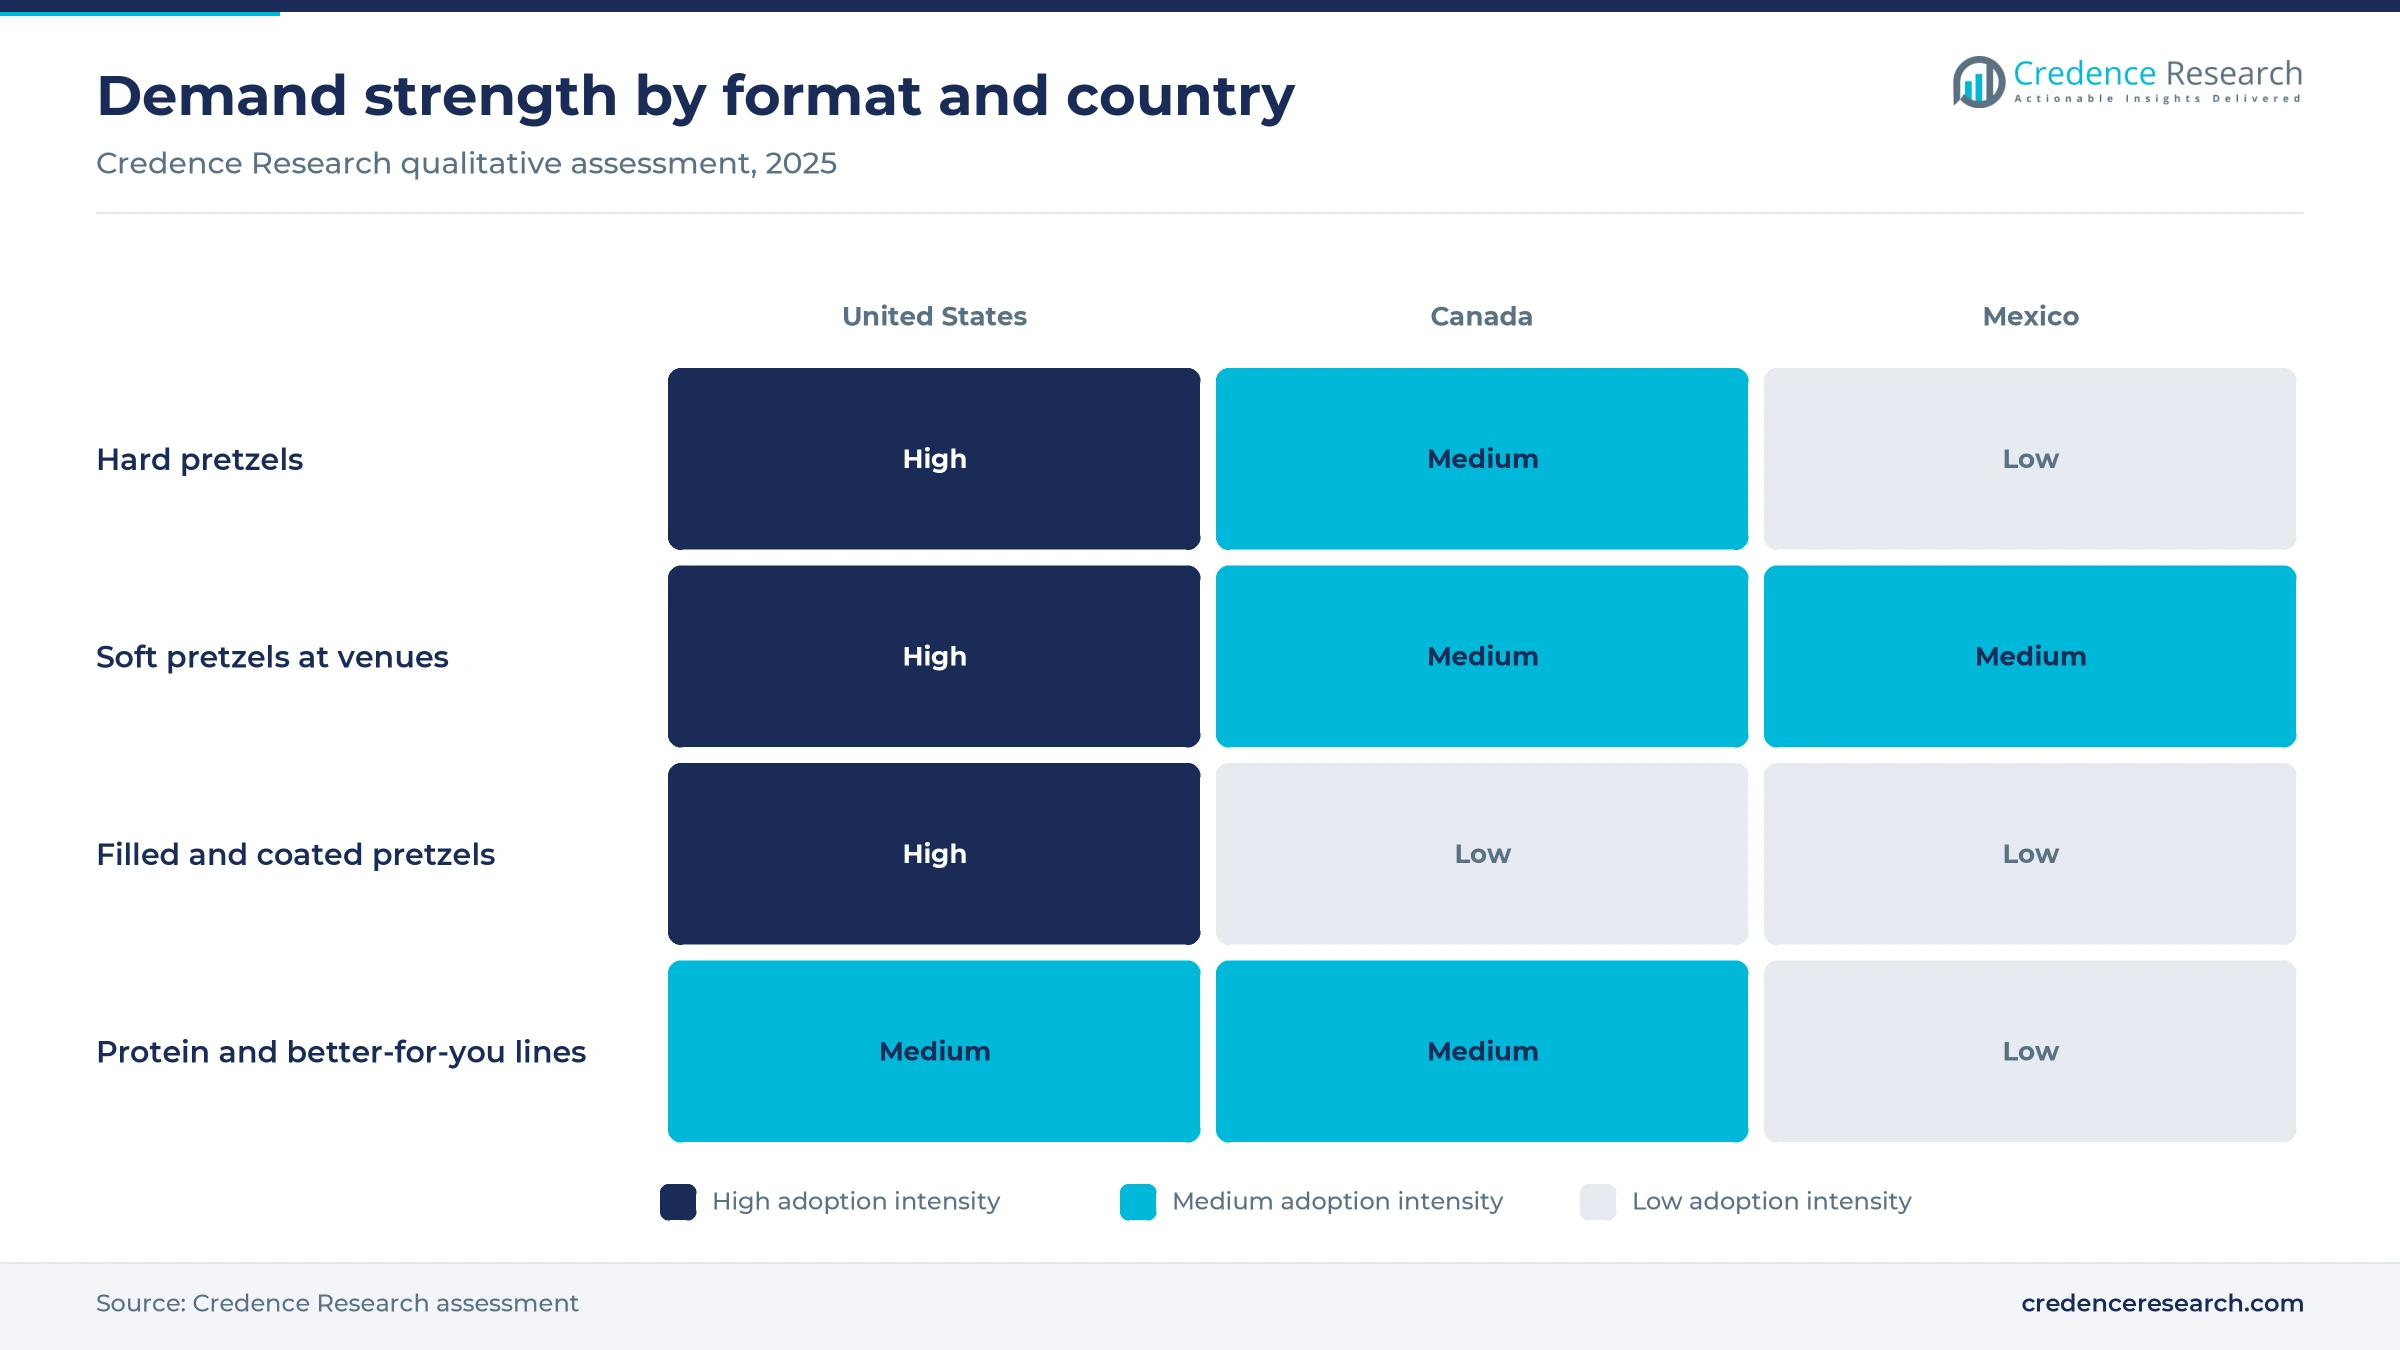
Soft pretzels add a sales base that does not depend on the snack aisle, because they are bought hot and eaten at the point of sale. The J&J Snack Foods annual report for fiscal 2025 shows food service soft pretzel sales up 3.5%, while its retail supermarket pretzel sales slipped 0.1%, although part of the gain came from pricing. The same filing lists stadiums, theme parks, movie theaters, convenience stores and schools as buyers, and it notes that whole grain versions qualify under USDA school nutrition rules. In addition, Restaurant Dive reported in March 2026 that Wetzel’s Pretzels has 20 convenience-store sites, with 10 to 15 more in development. These outlets give operators a growing number of hot pretzel sales points.
Flavor differentiation and brand visibility in the aisle
Flavor launches now decide share, since a seasoned twist commands attention that a plain rod cannot. Food Business News reported that Dot’s dollars rose 17% and its units 19% in the 52 weeks to March 22, 2026, ahead of a category growing 3.6%. Hershey made Dot’s buffalo seasoned twists permanent in September 2025, adding to original, Parmesan garlic, honey mustard and barbecue. Campbell’s followed in January 2026 with its first Goldfish seasoned pretzels in honey mustard and hot buffalo. Visibility matters as well, since Food Dive reported in October 2026 that Hershey plans a new Dot’s marketing campaign in 2027 built around tailgating and sports viewing. This activity supports Filled and coated pretzels and seasoned hard lines alike.
Game-day and seasonal occasions that concentrate sales
Sporting events and holidays concentrate pretzel purchases into short, promotable windows, which rewards brands with strong displays. PotatoPro reported that pretzels sold 11.1 million pounds worth $52.2 million in the week ending Feb. 9, 2025, a 22.5% gain that sat alongside ready-to-eat popcorn among the largest savory increases that Super Bowl week. Hershey also ran Dot’s retail activations around March Madness and fall football, according to Snack Food & Wholesale Bakery. Seasonal lines add to this pattern, since Snack Factory re-released Pumpkin Spice White Crème Pretzel Crisps and Uncle Jerry’s plans more seasonal and gift-friendly assortments over the next 12 months. Hershey’s 18-ounce Reese’s jars, described by New Food Magazine as made for sharing, serve the same occasion.
Filled, protein and multipack formats reshape the aisle
Shift toward filled pretzels as a sweet and salty format
Filling has moved from a niche idea to a mainstream shelf format within about 18 months. Hershey’s April 2025 launch of Reese’s filled pretzels came in 5-ounce bags, 9-ounce pouches and 18-ounce jars, according to New Food Magazine. Food Business News then reported sales listed under the Hershey name, separately from Dot’s, up 546% for the year to March 22, 2026, with units up 612%. Quinn Snacks followed in February 2026 with peanut butter and honey filled sticks at Northeast Costco locations in 10 states and the District of Columbia. Pretzelized has also taken its Pretzel Snackers into foodservice in 2-ounce bags, according to Snack Food & Wholesale Bakery. As a result, Filled and coated pretzels are forecast to grow at 7.36% a year.
Rise of protein pretzels across natural and mainstream retail
Protein claims are the second visible shift, as pretzel makers answer shoppers who read the nutrition panel before the flavor name. Utz Brands unveiled three protein pretzels at Natural Products Expo West in early March 2026, with 10 grams per serving in sea salt and 8 grams in honey mustard and cheddar. Meir Bagel’s Crisp Power Protein Pretzels added three flavors the same month, with up to 28 grams of protein, and sell through Costco, Wegmans, Hy-Vee and The Vitamin Shoppe, according to Food Business News. Quinn’s filled sticks carry a 3-gram claim plus gluten-free labeling. Kindling chief executive Cameron Smith told Snack Food & Wholesale Bakery in July 2025 that the snacking aisle is losing shoppers over nutrition and ingredients.
Opportunity in Mexico as pretzel chains build first networks
Mexico offers the clearest geographic opening, because branded pretzel retail there is only now being built. Expansión reported in March 2026 that Auntie Anne’s opened a kiosk at Galerías Monterrey in January 2026 and reached its three-month sales forecast within 15 days. Master franchisee Beegroup plans 40 units in five years, backed by more than 200 million pesos, starting in border cities such as Tijuana before Mexico City and Guadalajara. Separately, FEMSA announced in January 2025 that OXXO, with more than 24,000 stores across its markets, would bake Ditsch pretzels at a Monterrey outlet. Local flavors such as pepperoni and jalapeño, at tickets of 140 to 150 pesos, fit the market. Mexico therefore gives chains a rare chance to build a pretzel habit from a low base.
Opportunity in multipacks and convenience-store bakery sites
Multipacks and convenience-store bakery sites give brands a route to on-the-go buyers without winning more center-aisle space. Hershey’s Natalie Perera told Snack Food & Wholesale Bakery in July 2025 that multipacks are the fastest-growing pack type in salty snacks, and Dot’s has added variety packs. Campbell’s plans a multipack-focused back-to-school campaign, according to Food Business News in September 2026. Wetzel’s Pretzels aims to double its convenience-store sites within two years in a store-within-a-store format, Restaurant Dive reported in March 2026, targeting California, Illinois, Virginia and Washington. Online adds a further route to demand, since e-commerce reached 17.1% of U.S. retail sales in the second quarter of 2026. Cartons and multipacks are forecast to grow at 6.47% a year on this demand.
Price cuts, sodium rules and GLP-1 use pressure brands
Salty snack price cuts narrow room for mainstream brands
RTÉ reported on Feb. 3, 2026, that PepsiCo would cut U.S. prices on Lay’s, Doritos and other brands by up to 15% after North American food volumes fell. Campbell’s then reported snacks volume down 6% for the quarter ended May 3, 2026, according to Potato Business. Pretzel brands that rely on steady average price gains now compete with cheaper chips on the same shelf. Mainstream producers are responding with tighter assortments, promotions and new price-pack sizes.
Sodium targets and warning symbols raise reformulation costs
The FDA issued draft Phase II sodium targets on Aug. 15, 2024, covering 163 food categories, as average U.S. intake runs near 3,400 milligrams a day. Canada’s front-of-package symbol then became mandatory on Jan. 1, 2026, at 15% of daily value for most foods, according to a JD Supra legal summary. Salted hard pretzels are the most exposed format, and importers may need to relabel products for Canada. Producers can mitigate this risk with lower-salt recipes, although reformulation adds cost.
GLP-1 use reduces household snack baskets
A Cornell study reported by AgFunderNews in January 2025 found that households with a GLP-1 user cut grocery spending by 5.5% within six months, with the sharpest declines in savory snacks and baked goods. Users then represented 7.7% of tracked households, so routine home snacking faces a persistent drag. Higher-income homes cut spending by 8.6%, which matters for premium pretzels. Brands can respond with smaller packs and protein claims that suit reduced appetites.
Cross-border tariffs and Mexican snack tax add uncertainty
CBC reported in March 2025 that Canada’s 25% counter-tariff plan, set out in phases, named prepared bakery products, which raised sourcing questions for U.S. suppliers. In Mexico, Expansión reported in September 2026 that consumer groups want the 8% tax on snacks above 275 kilocalories per 100 grams raised to 20%, although the measure had not been adopted at that date. Exporters and Mexican chains therefore face uncertain shelf prices over the budget cycle. Local baking and flexible pack sizes can reduce part of this exposure.
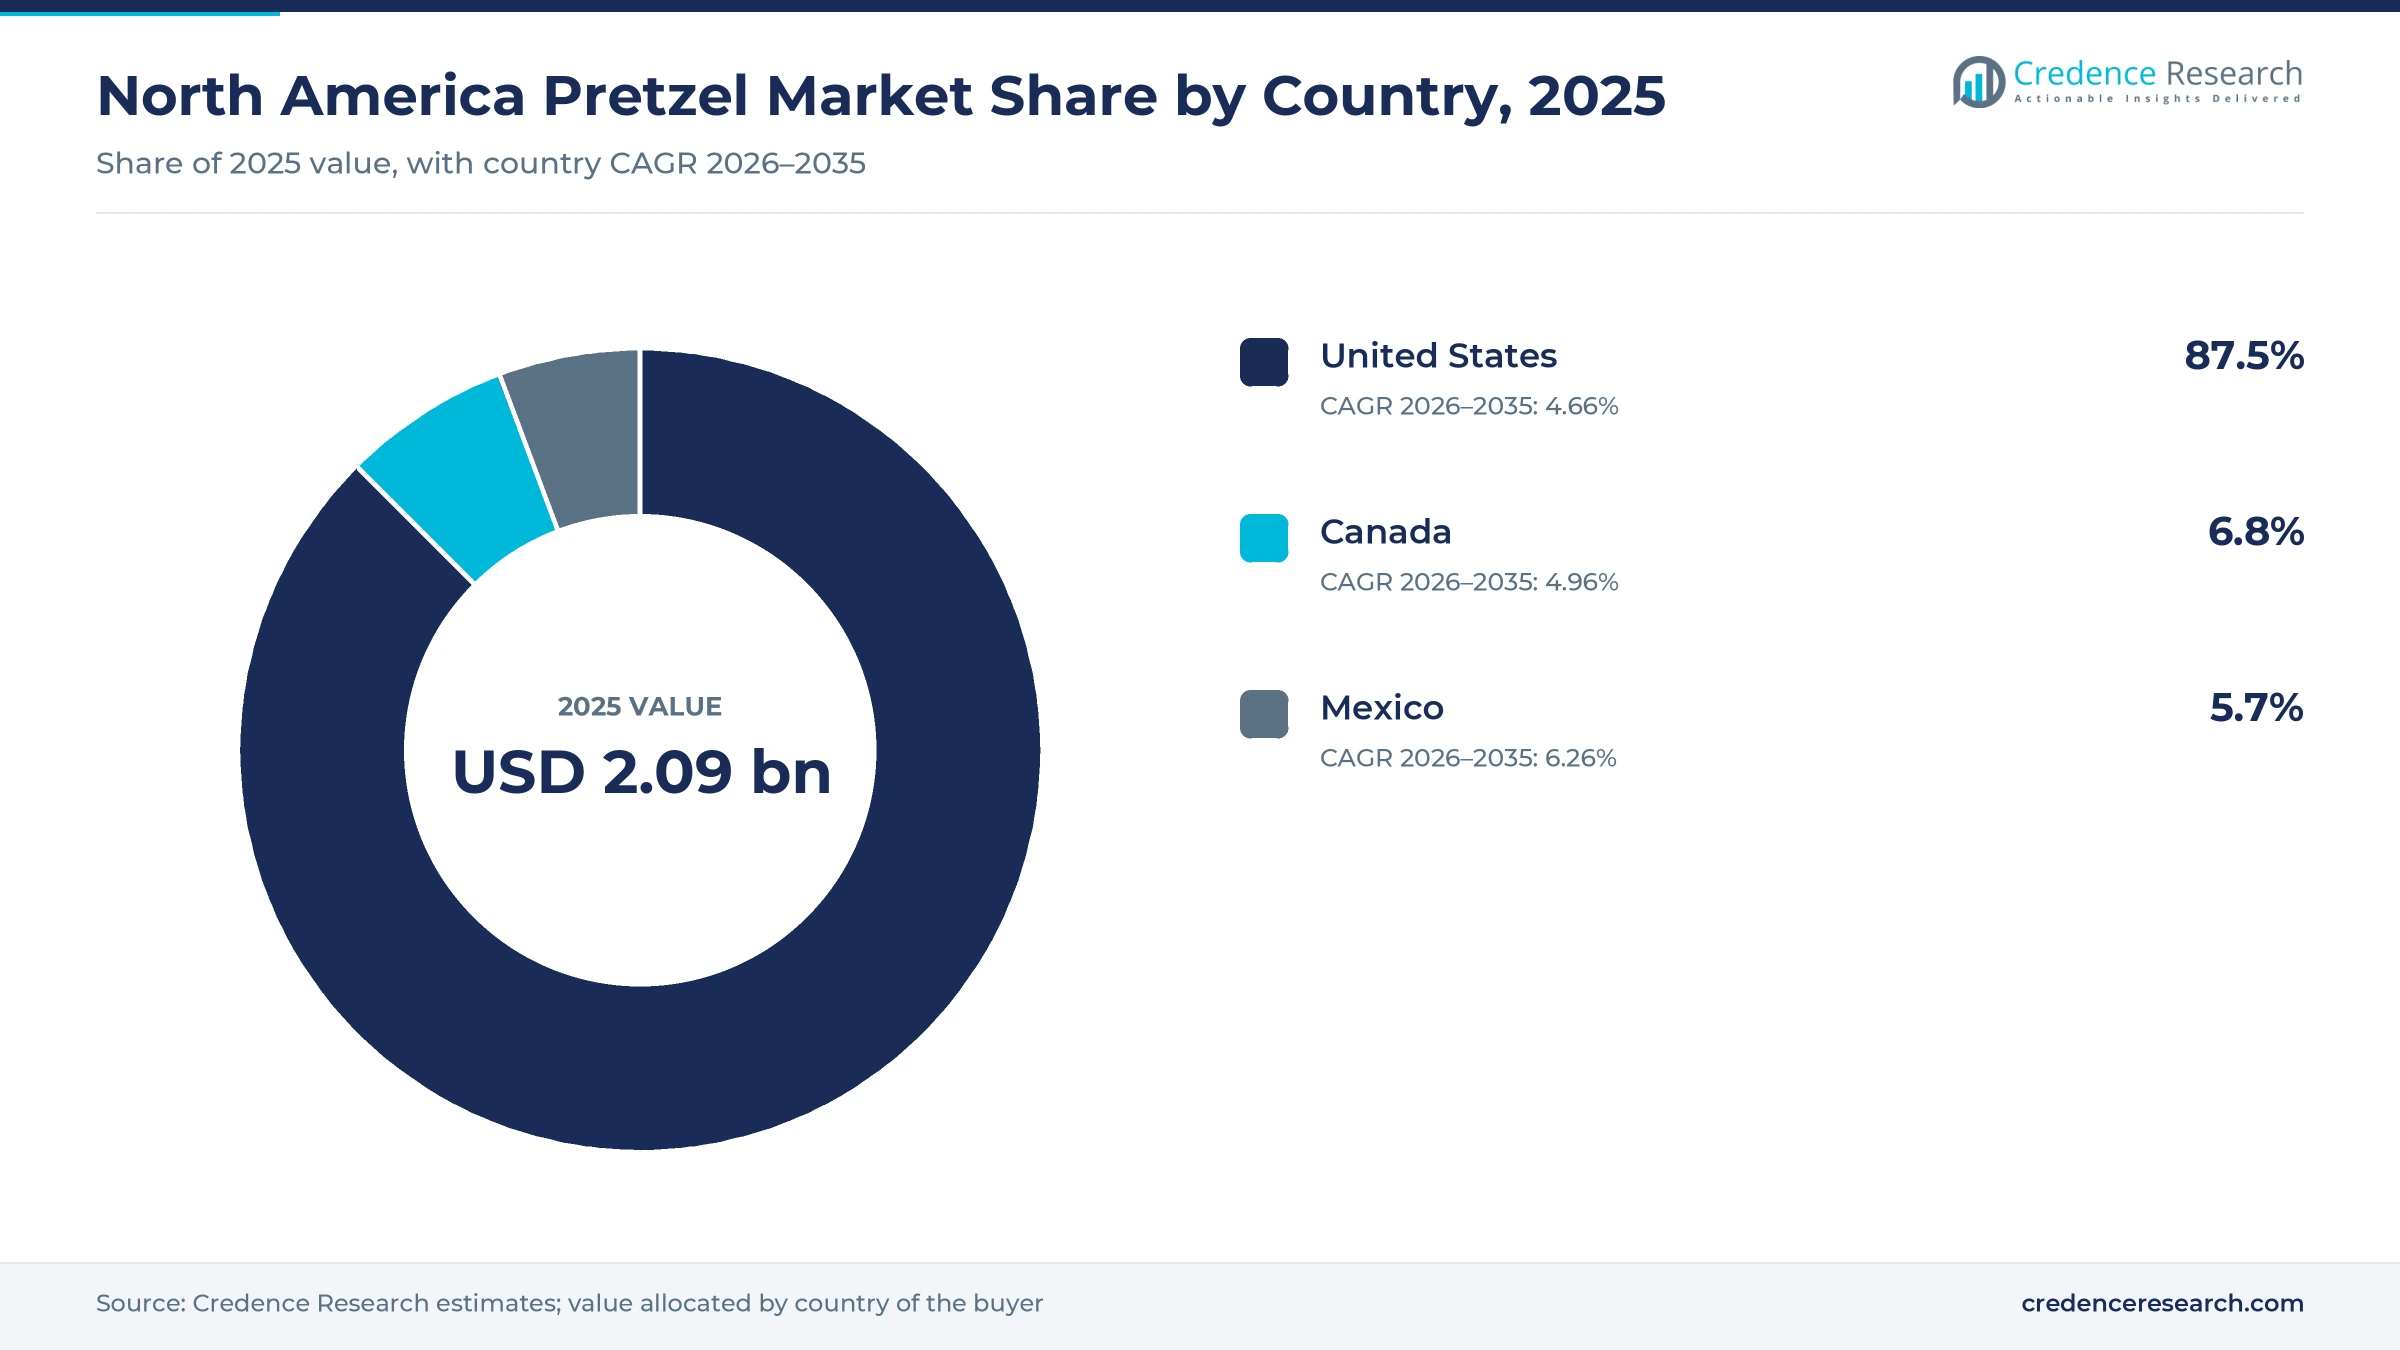
The United States dominates while Mexico expands fastest
| Country | Value, 2025 (USD billion) | Share, 2025 | CAGR, 2026–2035 |
|---|---|---|---|
| United States | 1.83 | 87.5% | 4.66% |
| Canada | 0.14 | 6.8% | 4.96% |
| Mexico | 0.12 | 5.7% | 6.26% |
United States holds the established retail and venue base
The United States held 87.5% of 2025 value and grows at 4.66% a year, because both retail and venue demand are mature and well served. Food Dive sized the tracked category at $2.7 billion in October 2026, with growth slowing to 2.5%. Production is also local, since Baking Business lists Dot’s and Pretzels Inc. plants in Kansas, Arizona and Indiana, while J&J Snack Foods bakes soft pretzels in six U.S. locations. Together these assets keep the market short on import dependence and long on brand competition.
Canada adds labeling rules and a growing chain presence
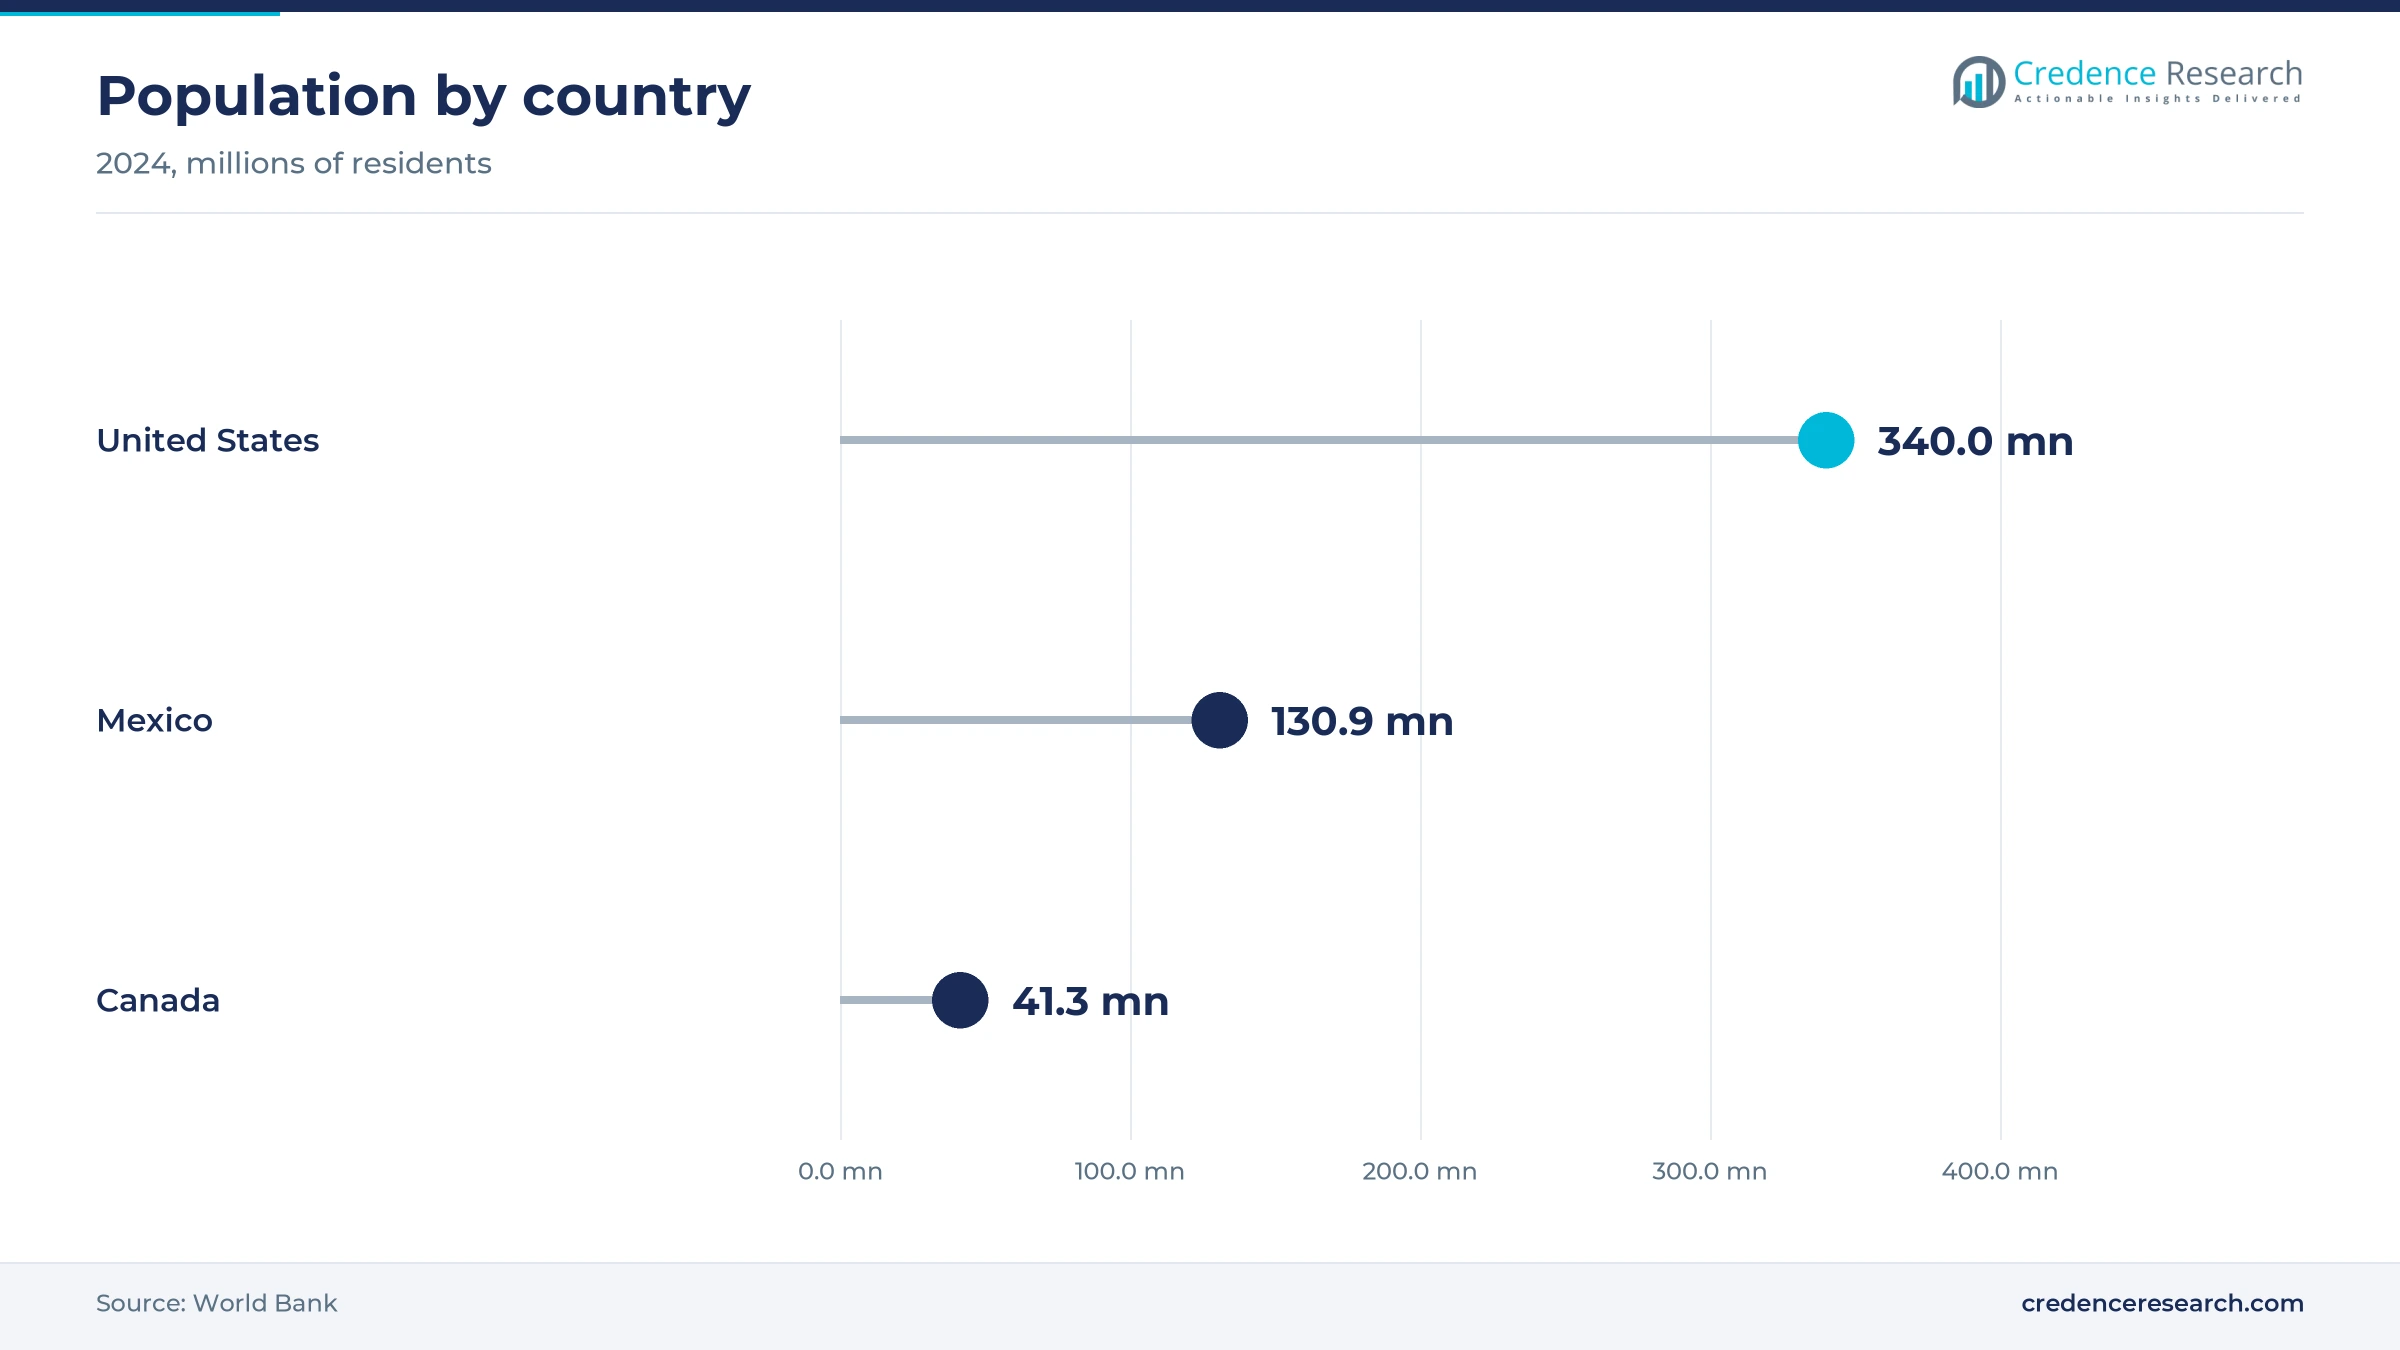
Canada held 6.8% of 2025 value and grows at 4.96% a year, as a smaller population of 41.3 million, according to the World Bank, limits scale. Retail Insider reported in December 2023 that Wetzel’s Pretzels, owned by Montreal-based MTY Food Group, had five Canadian stores and planned growth from malls into travel plazas and food trucks. Packaged products face a different test, since the mandatory front-of-package symbol applied from Jan. 1, 2026. Salted pretzels therefore require label or recipe review before they reach Canadian shelves.
Mexico starts small but expands fastest through chains
Mexico held 5.7% of 2025 value yet grows fastest at 6.26% a year, because a large population meets a young branded pretzel offer. World Bank data show 130.9 million residents in 2024 but GDP per capita near $13,988, against about $86,170 in the United States, which explains the small current share. Auntie Anne’s reached Monterrey in January 2026, according to Expansión, and OXXO began baking Ditsch pretzels there in 2025. The main risk is the snack tax debate, because an increase would reach pretzels above the calorie threshold.
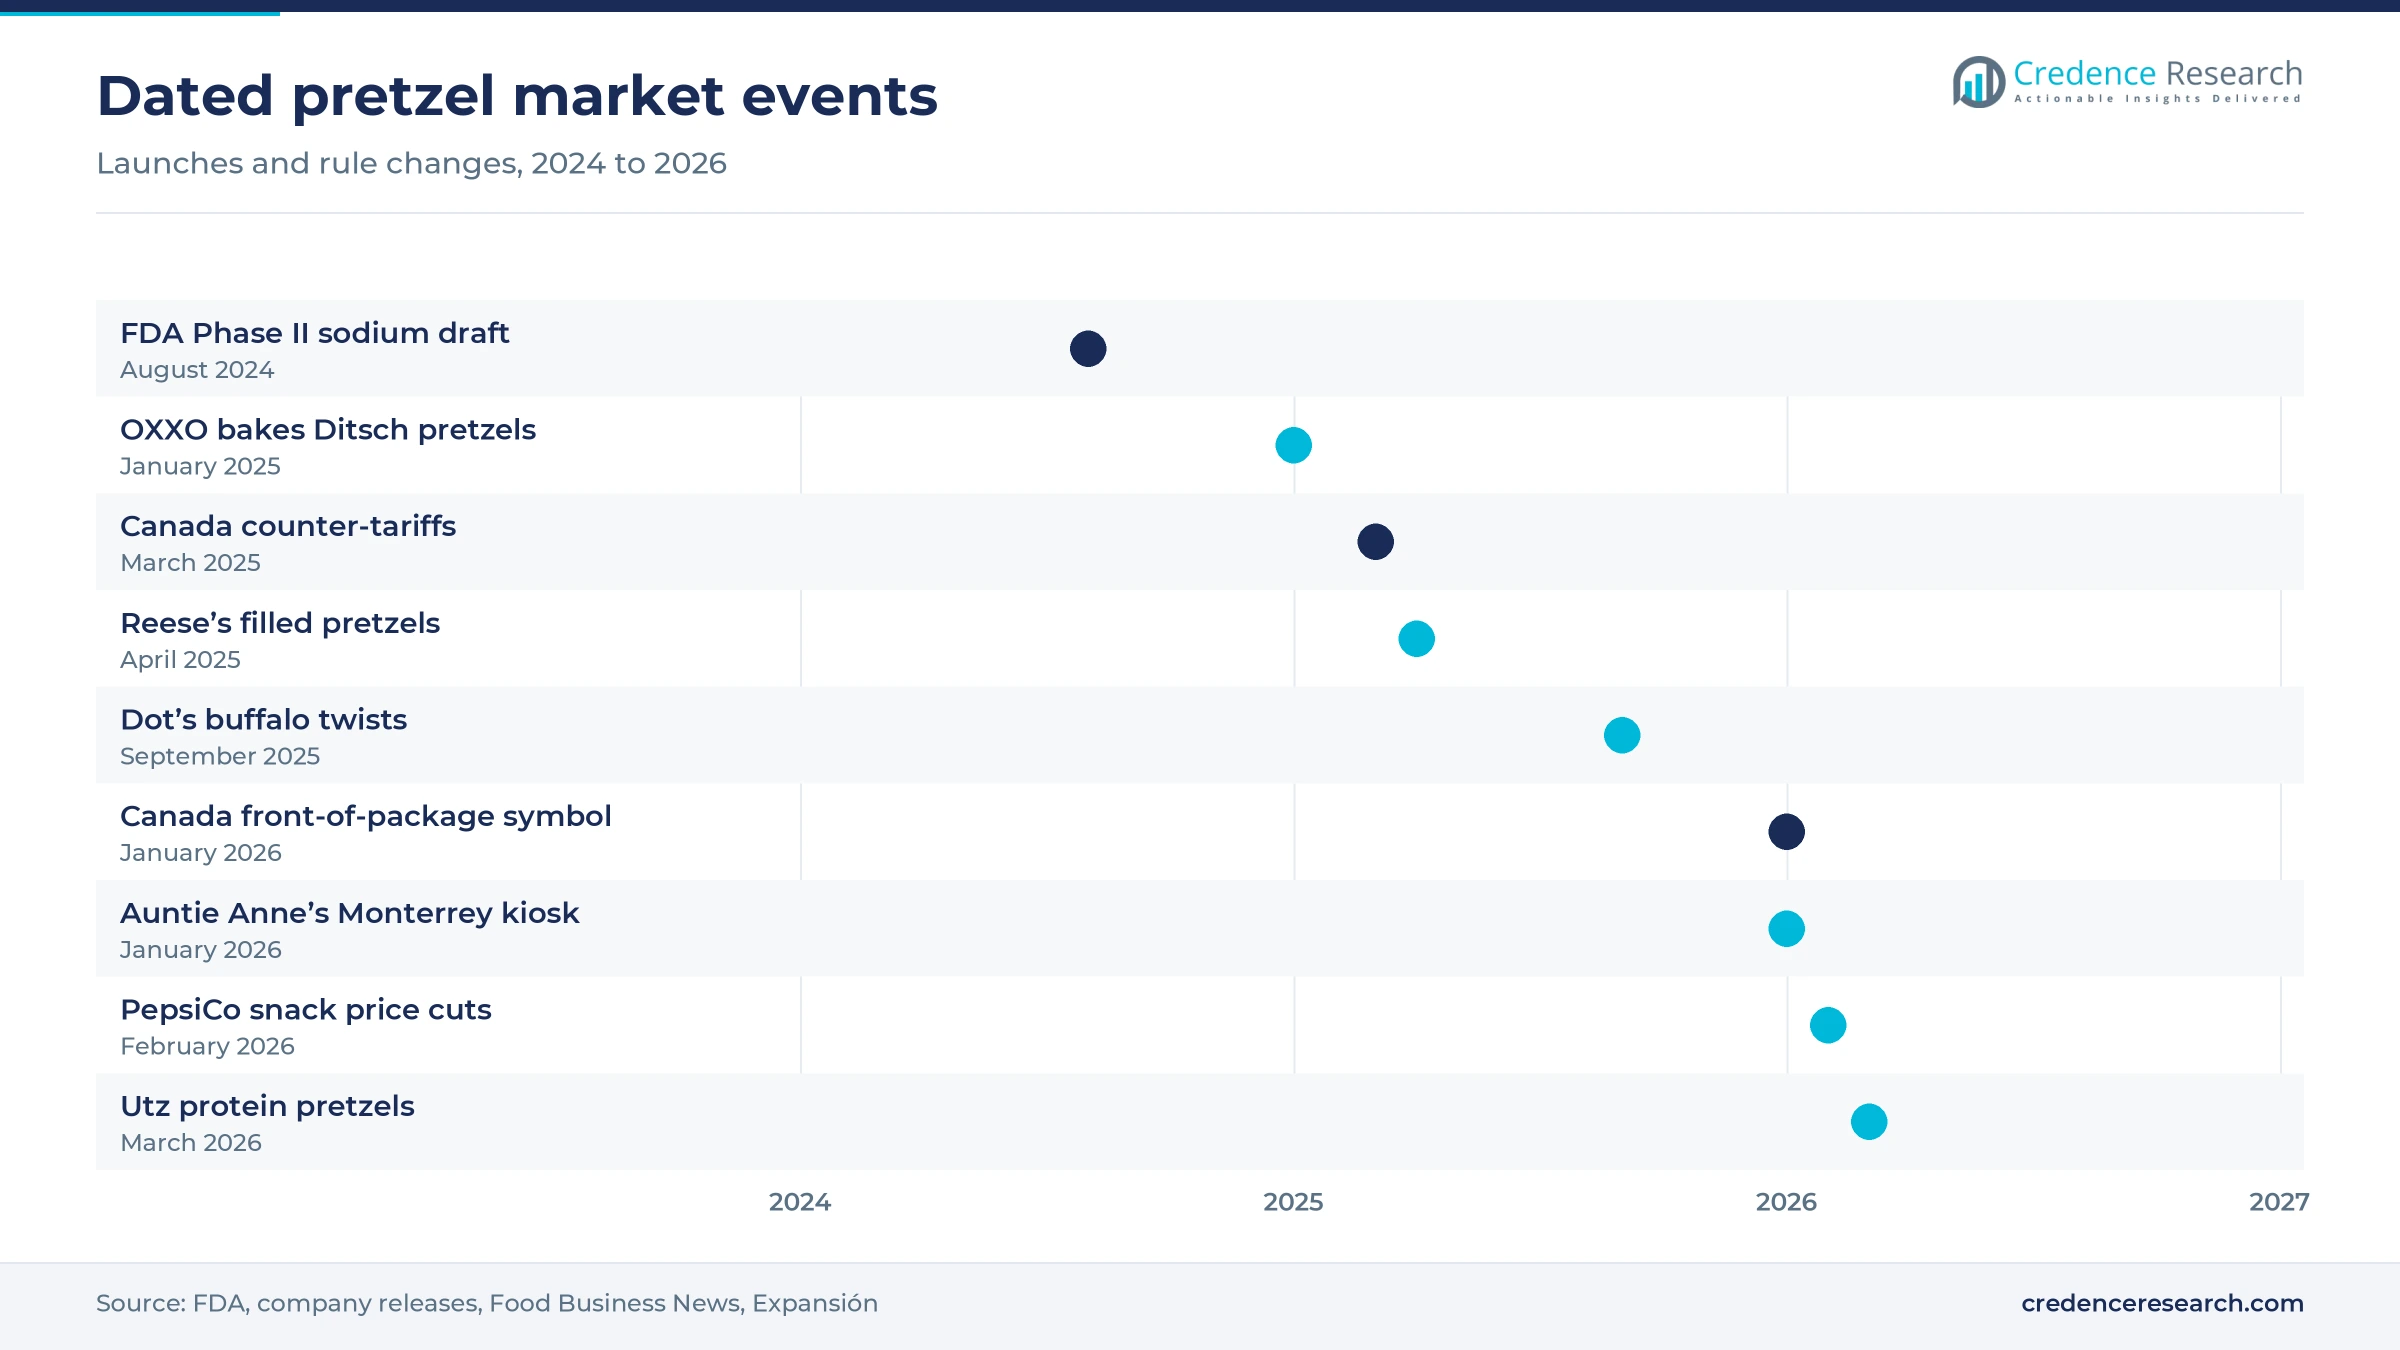
Launches and rule changes from 2024 to 2026 set direction
| Development | Status and market relevance |
|---|---|
| In August 2024, the FDA issued draft Phase II voluntary sodium targets for 163 food categories, with comments due by January 2025. | Draft guidance; relevant to salted pretzel recipes |
| In January 2025, FEMSA announced that OXXO would bake Ditsch pretzels and other products at a Monterrey outlet. | Launched; tests hot pretzels in Mexican convenience retail |
| In April 2025, Hershey launched Reese’s filled pretzels in U.S. retail in bags, pouches and jars. | On the market; Hershey-name pretzel sales rose 546% in the year to March 2026 |
| In September 2025, Hershey made Dot’s buffalo seasoned twists a permanent flavor. | On the market; supports game-day positioning |
| In January 2026, Canada’s front-of-package nutrition symbol became mandatory and Auntie Anne’s opened its first Mexican kiosk in Monterrey. | In force and open; 40 Mexican units planned over five years |
Fillings, seasonings and bake-off supply shape products
- Filled pretzel lines pair a salted shell with a peanut butter center, as Hershey’s Reese’s and Quinn’s sticks show.
- Seasoning systems carry bold flavors such as buffalo, Parmesan garlic and honey mustard onto twists, which is how Dot’s and Goldfish pretzels differentiate at shelf.
- Protein fortification raises a serving to 8 to 10 grams in the Utz range, a level that Food Business News reported from Natural Products Expo West.
- Bake-off supply ships frozen bakery products for finishing on site, as OXXO does in Monterrey with Ditsch pretzels produced in Germany and the United States.
Need a Custom Version of This Report?
Tailor the scope, geography, or segments to your exact requirements.
- Custom geography or segment scope
- Direct access to our analyst team
Dot’s challenge to Snyder’s reorders the pretzel aisle
Competition centers on a two-way contest between Hershey’s Dot’s and Campbell’s Snyder’s of Hanover, with Utz Brands, PepsiCo’s Frito-Lay and private label behind them. Retail data reported by Snack Food & Wholesale Bakery in March 2026 show Dot’s up 17.5% and Snyder’s-Lance down 8.7% in 2025, which moved Dot’s into first place. Utz reports a 13% share in its core geographies and competes through direct-store routes and protein launches. Frito-Lay’s pretzel sales fell 1.4%, and PepsiCo is cutting its U.S. product count by about 20%. J&J Snack Foods holds a different position, since its SUPERPRETZEL brand and soft pretzels serve venues and supermarkets. Smaller brands, including Quinn, Unique Snacks and Uncle Jerry’s, compete on ingredients and clubs. Campbell’s has promised Snyder’s of Hanover innovation later in fiscal 2027 as part of its snacks turnaround.
Companies profiled and their roles in this market
| Company | Type | Role in the market |
|---|---|---|
| The Hershey Company | Brand owner | Owns Dot’s Homestyle Pretzels, Pretzels Inc. and Reese’s filled pretzels |
| The Campbell’s Company | Brand owner | Owns Snyder’s of Hanover, Snack Factory Pretzel Crisps and Goldfish seasoned pretzels |
| Utz Brands | Brand owner | Holds 13% of pretzel retail sales in core geographies, with protein pretzels unveiled in March 2026 |
| PepsiCo | Brand owner | Sells pretzels through Frito-Lay and is reducing its U.S. product count and snack prices |
| J&J Snack Foods | Foodservice and retail supplier | Supplies SUPERPRETZEL and soft pretzels to venues, schools and supermarkets from six plants |
Brand momentum matters more than category price growth
Credence Research’s view is that this market will be decided by mix and brand rather than by broad pricing. Tracked category growth has slowed from 5.5% in May 2025 to 2.5% by October 2026, so the forecast depends on filled, protein and foodservice formats earning a premium over plain twists. Dot’s has shown that a seasoned brand can take pretzel share quickly, reaching 23% of the category, yet its 9.3% pace is also slowing. Suppliers should therefore treat flavor as an entry ticket and focus on occasions, multipacks and Mexican chain supply.
Credence Research model and public company filings
The report uses 2025 as the base year and 2026 to 2035 as the forecast period. Market values come from the Credence Research model, and country and segment splits are Credence Research estimates informed by retail tracking data reported in trade publications, company annual reports, regulator publications, World Bank and U.S. Census Bureau statistics, and dated company news. No interviews or surveys were conducted for this edition, and retail figures quoted from trade publications are shelf-price sales that differ from the producer-value market estimate.
Mix gains and Mexico support growth through 2035
The market is projected to rise from USD 2.20 billion in 2026 to USD 3.35 billion by 2035, a 4.78% CAGR, with volume growth modest in the United States and faster chain-led gains in Mexico. Filled and coated lines should take share from plain hard pretzels, while foodservice supply benefits from convenience-store and venue bakery sites. Sodium targets, Canadian labels and possible Mexican tax changes will shape recipes and prices. Brands that combine seasoned or protein products with multipack formats should keep the strongest position through 2035.
Frequently Asked Questions
How big is the North America pretzel market?
Which country leads the North America pretzel market?
Which country is growing fastest?
Which product type holds the largest share?
Why are filled pretzels growing so quickly?
How important is foodservice for soft pretzels?
What are the main challenges for pretzel makers?
Who are the key companies in this market?
Table of Content
Chapter 1 Market Segmentation
- 1.1 Segmentation Framework
- 1.1.1 Product and Service Classification
- 1.1.2 Application and End-Use Classification
- 1.1.3 Technology and Solution Classification
- 1.1.4 Customer and Distribution Channel Classification
- 1.1.5 Geographic Segmentation
- 1.1.6 Market Segment Definitions and Boundaries
- 1.2 By Product Type
- 1.2.1 Hard pretzels
- 1.2.2 Soft pretzels
- 1.2.3 Pretzel crisps and thins
- 1.2.4 Filled and coated pretzels
- 1.3 By Price Tier
- 1.3.1 Mainstream
- 1.3.2 Value
- 1.3.3 Premium
- 1.4 By Packaging Format
- 1.4.1 Flexible bags
- 1.4.2 Cartons and multipacks
- 1.4.3 Rigid containers
- 1.4.4 Bulk and unpackaged supply
- 1.5 By Country
- 1.5.1 United States
- 1.5.2 Canada
- 1.5.3 Mexico
Chapter 2 Introduction
- 2.1 Report Objectives and Scope
- 2.2 Product Definition and Industry Terminology
- 2.3 Market Inclusions and Exclusions
- 2.4 Research Process
- 2.4.1 Primary Research and Expert Interviews
- 2.4.2 Secondary Research and Source Review
- 2.4.3 Top-Down and Bottom-Up Estimation
- 2.4.4 Data Triangulation and Verification
- 2.5 Market Size Measurement Basis
- 2.5.1 2025: USD 2.09 billion → 2035: USD 3.35 billion
- 2.6 Historical and Forecast Reference Periods
- 2.6.1 Historical Period: 2018-2025
- 2.6.2 Base Year: 2025
- 2.6.3 Forecast Period: 2025-2035
- 2.7 Research Assumptions and Limitations
Chapter 3 Executive Summary
- 3.1 Market Snapshot and Key Findings
- 3.2 Base-Year Market Size, 2025
- 3.3 Forecast Market Size, 2035
- 3.4 Revenue and Volume Growth Outlook
- 3.5 Key Demand and Supply Indicators
- 3.6 Leading Market Segments
- 3.7 Fastest-Growing Market Opportunities
- 3.8 Regional Performance Highlights
- 3.9 Technology and Industry Transformation
- 3.10 Competitive Landscape Summary
- 3.11 Analyst View and Strategic Implications
Chapter 4 North America Pretzel Market Trends and Developments
- 4.1 Historical Industry Development, 2018-2025
- 4.2 Recent Market Trends and Developments
- 4.3 Demand and Customer Behavior Trends
- 4.4 Technology and Product Innovation
- 4.5 Artificial Intelligence, Automation and Digitalization
- 4.6 Local Manufacturing and Supply Chain Realignment
- 4.7 Industry Partnerships, Mergers and Acquisitions
- 4.8 Sustainability and Circular Economy Developments
- 4.9 Government and Private Sector Investment Trends
- 4.10 Emerging Business Models and Commercialization
- 4.11 Industry Developments and Announcements
Chapter 5 North America Pretzel Market Production, Supply and Demand Analysis
- 5.1 Demand Trend and Consumption Analysis, 2018-2025
- 5.2 Demand Forecast, 2025-2035
- 5.3 Production and Output Trend, 2018-2025
- 5.4 Production and Output Forecast, 2025-2035
- 5.5 Installed Capacity and Capacity Utilization
- 5.6 Company-Wise Production Plants and Statistics
- 5.6.1 Installed Production Capacity
- 5.6.2 Actual Production
- 5.6.3 Planned Capacity and Expansion Targets
- 5.7 Supply Chain Structure and Procurement Trends
- 5.8 Supply-Demand Gap and Bottlenecks
- 5.9 Import Dependence and Sourcing Structure
- 5.10 Contract Manufacturing and Outsourcing
- 5.11 Regional Supply and Demand Concentration
Chapter 6 North America Pretzel Market Pricing Analysis
- 6.1 Pricing Structure and Measurement
- 6.2 Historical Pricing Trends, 2018-2025
- 6.3 Pricing Outlook, 2025-2035
- 6.4 Average Selling Price and Unit Economics
- 6.5 Pricing by Product and Market Segment
- 6.6 Geographic Pricing Differences
- 6.7 Key Input, Energy, Labor and Logistics Costs
- 6.8 Contract Pricing and Purchasing Models
- 6.9 Pricing Sensitivity and Competitive Positioning
- 6.10 Price, Margin and Profitability Implications
Chapter 7 North America Pretzel Market Dynamics
- 7.1 Market Growth Drivers
- 7.1.1 Demand-Side Drivers
- 7.1.2 Technology and Innovation Drivers
- 7.1.3 Infrastructure and Investment Drivers
- 7.1.4 Regulatory and Policy Drivers
- 7.2 Market Restraints
- 7.2.1 Cost and Affordability Constraints
- 7.2.2 Technology and Adoption Barriers
- 7.2.3 Supply Chain and Operational Constraints
- 7.3 Market Challenges
- 7.3.1 Competitive Pressure and Margin Erosion
- 7.3.2 Skills, Infrastructure and Implementation Gaps
- 7.4 Emerging Market Opportunities
- 7.5 Market Dynamics Impact and Time-Horizon Assessment
Chapter 8 North America Pretzel Value Chain Analysis
- 8.1 Industry Value Chain Overview
- 8.2 Upstream Suppliers and Critical Inputs
- 8.3 Technology and Component Providers
- 8.4 Manufacturing or Service Delivery
- 8.5 Distribution, Channel Partners and Integrators
- 8.6 Downstream Applications and End Users
- 8.7 Value Addition and Profit Pools
- 8.8 Vertical Integration and Outsourcing
- 8.9 Supplier Concentration and Risk
- 8.10 Supply Chain Localization and Resilience
Chapter 9 North America Pretzel Market Regulations and Policies
- 9.1 Relevant Laws, Standards and Compliance Frameworks
- 9.2 Product, Service, Safety and Quality Requirements
- 9.3 Government Policies, Incentives and Subsidies
- 9.4 Imports, Exports and Trade Barriers
- 9.5 Public Procurement and Local Content Requirements
- 9.6 Environmental and Sustainability Compliance
- 9.7 Upcoming Policy Changes and Market Implications
Chapter 10 North America Pretzel Market Hotspots and Opportunities
- 10.1 Market Opportunity Mapping and Growth Hotspots
- 10.2 High-Growth Applications and Customer Groups
- 10.3 Underserved Markets and White-Space Opportunities
- 10.4 Emerging Technology and Product Opportunities
- 10.5 New Capacity and Investment Hotspots
- 10.6 Market Entry and Expansion Opportunities
- 10.7 Distribution and Partnership Opportunities
- 10.8 Near-Term and Long-Term Commercial Potential
- 10.9 Opportunity Attractiveness and Execution Risks
Chapter 11 North America Pretzel Market Outlook, 2025-2035
- 11.1 Market Size and Analysis
- 11.1.1 Revenue (Market Measurement: 2025: USD 2.09 billion → 2035: USD 3.35 billion)
- 11.1.2 Market Volume and Quantity Sold
- 11.1.3 Historical Market Size, 2018-2025
- 11.1.4 Base-Year Market Size, 2025
- 11.2 Market Forecast, 2025-2035
- 11.2.1 Revenue Forecast to 2035
- 11.2.2 Volume Forecast to 2035
- 11.2.3 CAGR and Year-on-Year Growth
- 11.2.4 Incremental Revenue Opportunity
- 11.3 Forecast Assumptions and Scenario Analysis
- 11.3.1 Base-Case Forecast
- 11.3.2 Optimistic and Conservative Scenarios
- 11.3.3 Technology, Pricing and Policy Sensitivities
- 11.4 Market Attractiveness and Growth Outlook
Chapter 12 North America Pretzel Market Segmentation and Outlook
- 12.1 Segmentation Summary and Market Shares, 2025
- 12.2 Largest and Fastest-Growing Segments
- 12.3 By Product Type - Market Size and Forecast, 2025-2035
- 12.3.1 Segment Definition and Scope
- 12.3.2 Historical Market Size, 2018-2025
- 12.3.3 Revenue Forecast, 2025-2035
- 12.3.4 Volume Forecast, 2025-2035
- 12.3.5 Base-Year Market Share, 2025
- 12.3.6 Segment CAGR and Growth Drivers
- 12.3.7 Subsegment Market Size and Forecast
- 12.3.7.1 Hard pretzels
- 12.3.7.2 Soft pretzels
- 12.3.7.3 Pretzel crisps and thins
- 12.3.7.4 Filled and coated pretzels
- 12.3.8 Subsegment Pricing and Adoption Trends
- 12.3.9 Leading Suppliers and Competition
- 12.3.10 Regional Demand and Opportunities
- 12.4 By Price Tier - Market Size and Forecast, 2025-2035
- 12.4.1 Segment Definition and Scope
- 12.4.2 Historical Market Size, 2018-2025
- 12.4.3 Revenue Forecast, 2025-2035
- 12.4.4 Volume Forecast, 2025-2035
- 12.4.5 Base-Year Market Share, 2025
- 12.4.6 Segment CAGR and Growth Drivers
- 12.4.7 Subsegment Market Size and Forecast
- 12.4.7.1 Mainstream
- 12.4.7.2 Value
- 12.4.7.3 Premium
- 12.4.8 Subsegment Pricing and Adoption Trends
- 12.4.9 Leading Suppliers and Competition
- 12.4.10 Regional Demand and Opportunities
- 12.5 By Packaging Format - Market Size and Forecast, 2025-2035
- 12.5.1 Segment Definition and Scope
- 12.5.2 Historical Market Size, 2018-2025
- 12.5.3 Revenue Forecast, 2025-2035
- 12.5.4 Volume Forecast, 2025-2035
- 12.5.5 Base-Year Market Share, 2025
- 12.5.6 Segment CAGR and Growth Drivers
- 12.5.7 Subsegment Market Size and Forecast
- 12.5.7.1 Flexible bags
- 12.5.7.2 Cartons and multipacks
- 12.5.7.3 Rigid containers
- 12.5.7.4 Bulk and unpackaged supply
- 12.5.8 Subsegment Pricing and Adoption Trends
- 12.5.9 Leading Suppliers and Competition
- 12.5.10 Regional Demand and Opportunities
- 12.6 By Country - Market Size and Forecast, 2025-2035
- 12.6.1 Segment Definition and Scope
- 12.6.2 Historical Market Size, 2018-2025
- 12.6.3 Revenue Forecast, 2025-2035
- 12.6.4 Volume Forecast, 2025-2035
- 12.6.5 Base-Year Market Share, 2025
- 12.6.6 Segment CAGR and Growth Drivers
- 12.6.7 Subsegment Market Size and Forecast
- 12.6.7.1 United States
- 12.6.7.2 Canada
- 12.6.7.3 Mexico
- 12.6.8 Subsegment Pricing and Adoption Trends
- 12.6.9 Leading Suppliers and Competition
- 12.6.10 Regional Demand and Opportunities
- 12.7 Segment Growth Comparison
- 12.8 Segment Attractiveness and Priority Matrix
Chapter 13 North America Pretzel Geographic Market Outlook, 2025-2035
- 13.1 Regional Market Size and Country-Level Shares, 2025
- 13.2 Country Market Size Comparison, 2025
- 13.3 Country Market Forecasts, 2025-2035
- 13.4 Subregional Industrial and Demand Clusters
- 13.5 Intra-Regional Pricing and Cost Differences
- 13.6 Cross-Border Trade and Supply Networks
- 13.7 Regional Supply and Demand Balances
- 13.8 Country Opportunity Comparison and Prioritization
Note: Every listed country is covered on the structure shown under the first country.
Chapter 14 North America Pretzel Technology, Innovation and Sustainability Outlook
- 14.1 Technology Landscape and Maturity
- 14.2 Product, Process and Service Innovation
- 14.3 AI, Automation and Digital Tools in the Industry
- 14.4 Technology Adoption and Performance Benchmarking
- 14.5 Innovation Pipeline and R&D Investment
- 14.6 Patent and Intellectual Property Trends
- 14.7 Energy Efficiency and Resource Management
- 14.8 Sustainability, Recycling and Circularity
- 14.9 Technology Roadmap, 2025-2035
- 14.10 Risks of Obsolescence and Technology Substitution
Chapter 15 North America Pretzel Market Key Strategic Imperatives
- 15.1 Growth and Market Entry Priorities
- 15.2 High-Return Products and Segments
- 15.3 Pricing, Profitability and Cost Optimization
- 15.4 Technology Investment and Product Differentiation
- 15.5 Supply Chain Localization and Resilience
- 15.6 Distribution and Customer Acquisition
- 15.7 Partnership, Acquisition and Capacity Strategy
- 15.8 Regional Expansion Priorities
- 15.9 Short-, Medium- and Long-Term Actions
Chapter 16 Competition Outlook
- 16.1 Industry Competition Characteristics
- 16.2 Market Structure and Concentration
- 16.3 Market Share and Competitive Positioning, 2025
- 16.4 Company-Wise Revenue and Product Benchmarking
- 16.5 Production and Service Capacity Benchmarking
- 16.6 Technology, Pricing and Differentiation
- 16.7 Regional Footprint and Distribution Strength
- 16.8 Mergers, Acquisitions and Strategic Alliances
- 16.9 New Entrants and Competitive Threats
- 16.10 Porter's Five Forces and Industry Attractiveness
- 16.11 Competitive Outlook, 2025-2035
Chapter 17 Company Profiles
- 17.1 Company Coverage and Selection Criteria
- 17.2 The Campbell’s Company
- 17.2.1 Business Description
- 17.2.2 Company Ownership and Geographic Presence
- 17.2.3 Product and Service Portfolio
- 17.2.4 Manufacturing and Operating Footprint
- 17.2.5 Production Capacity and Expansion Plans
- 17.2.6 Financial Performance and Investment
- 17.2.7 Market Share and Competitive Position
- 17.2.8 Technology and Innovation Capabilities
- 17.2.9 Strategic Alliances or Partnerships
- 17.2.10 Recent Developments
- 17.2.11 Growth Strategy and Outlook
- 17.3 The Hershey Company
- 17.4 J&J Snack Foods
- 17.5 PepsiCo
- 17.6 Utz Brands
- 17.7 Other Relevant Market Participants
Note: Every listed company is profiled on the structure shown under the first company. The company list is preliminary and may change based on research findings, market developments, data availability and client requirements.
Chapter 18 Disclaimer
- 18.1 Research and Forecast Disclaimer
- 18.2 Data Source and Estimation Limitations
Note: The depth of individual sections depends on data availability for this market. Volume, capacity, trade and other unit-based metrics are included where applicable.

