CHAPTER NO. 1 : GENESIS OF THE MARKET
1.1 Market Prelude – Introduction & Scope
1.2 The Big Picture – Objectives & Vision
1.3 Strategic Edge – Unique Value Proposition
1.4 Stakeholder Compass – Key Beneficiaries
CHAPTER NO. 2 : EXECUTIVE LENS
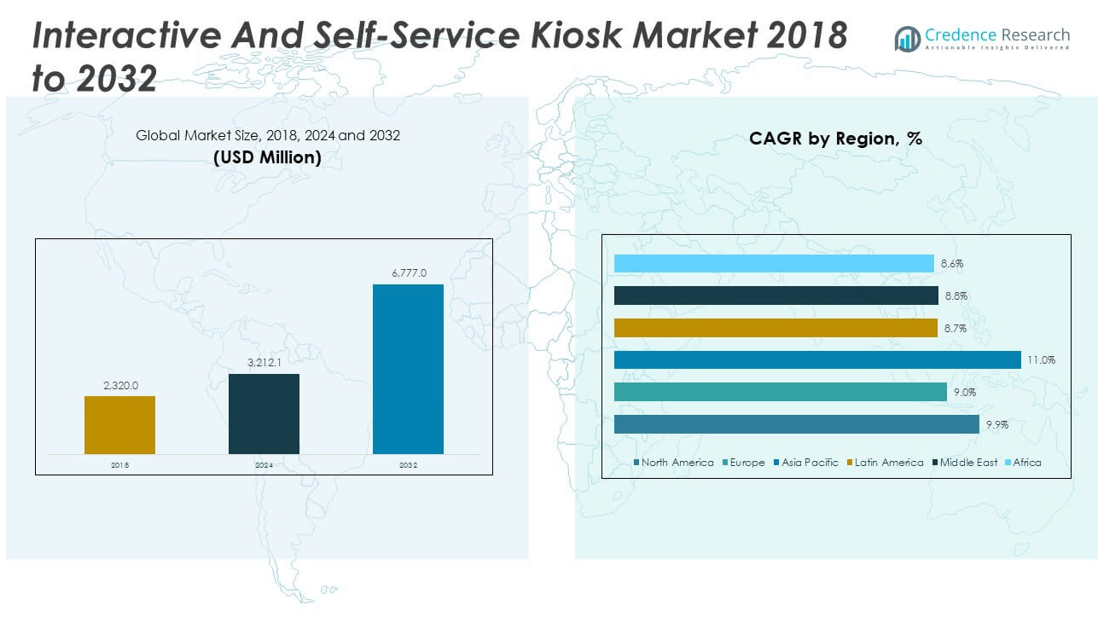
2.1 Pulse of the Industry – Market Snapshot
2.2 Growth Arc – Revenue Projections (USD Million)
2.3. Premium Insights – Based on Primary Interviews
CHAPTER NO. 3 : INTERACTIVE AND SELF-SERVICE KIOSK MARKET FORCES & INDUSTRY PULSE
3.1 Foundations of Change – Market Overview
3.2 Catalysts of Expansion – Key Market Drivers
3.2.1 Momentum Boosters – Growth Triggers
3.2.2 Innovation Fuel – Disruptive Technologies
3.3 Headwinds & Crosswinds – Market Restraints
3.3.1 Regulatory Tides – Compliance Challenges
3.3.2 Economic Frictions – Inflationary Pressures
3.4 Untapped Horizons – Growth Potential & Opportunities
3.5 Strategic Navigation – Industry Frameworks
3.5.1 Market Equilibrium – Porter’s Five Forces
3.5.2 Ecosystem Dynamics – Value Chain Analysis
3.5.3 Macro Forces – PESTEL Breakdown
3.6 Price Trend Analysis
3.6.1 Regional Price Trend
3.6.2 Price Trend by product
CHAPTER NO. 4 : KEY INVESTMENT EPICENTER
4.1 Regional Goldmines – High-Growth Geographies
4.2 Product Frontiers – Lucrative Product Categories
4.3 Deployment Sweet Spots – Emerging Demand Segments
CHAPTER NO. 5: REVENUE TRAJECTORY & WEALTH MAPPING
5.1 Momentum Metrics – Forecast & Growth Curves
5.2 Regional Revenue Footprint – Market Share Insights
5.3 Segmental Wealth Flow – Component & Deployment Revenue
CHAPTER NO. 6 : TRADE & COMMERCE ANALYSIS
6.1. Import Analysis by Region
6.1.1. Global Interactive And Self-Service Kiosk Market Import Revenue By Region
6.2. Export Analysis by Region
6.2.1. Global Interactive And Self-Service Kiosk Market Export Revenue By Region
CHAPTER NO. 7 : COMPETITION ANALYSIS
7.1. Company Market Share Analysis
7.1.1. Global Interactive And Self-Service Kiosk Market: Company Market Share
7.2. Global Interactive And Self-Service Kiosk Market Company Revenue Market Share
7.3. Strategic Developments
7.3.1. Acquisitions & Mergers
7.3.2. New Product Launch
7.3.3. Regional Expansion
7.4. Competitive Dashboard
7.5. Company Assessment Metrics, 2024
CHAPTER NO. 8 : INTERACTIVE AND SELF-SERVICE KIOSK MARKET – BY COMPONENT SEGMENT ANALYSIS
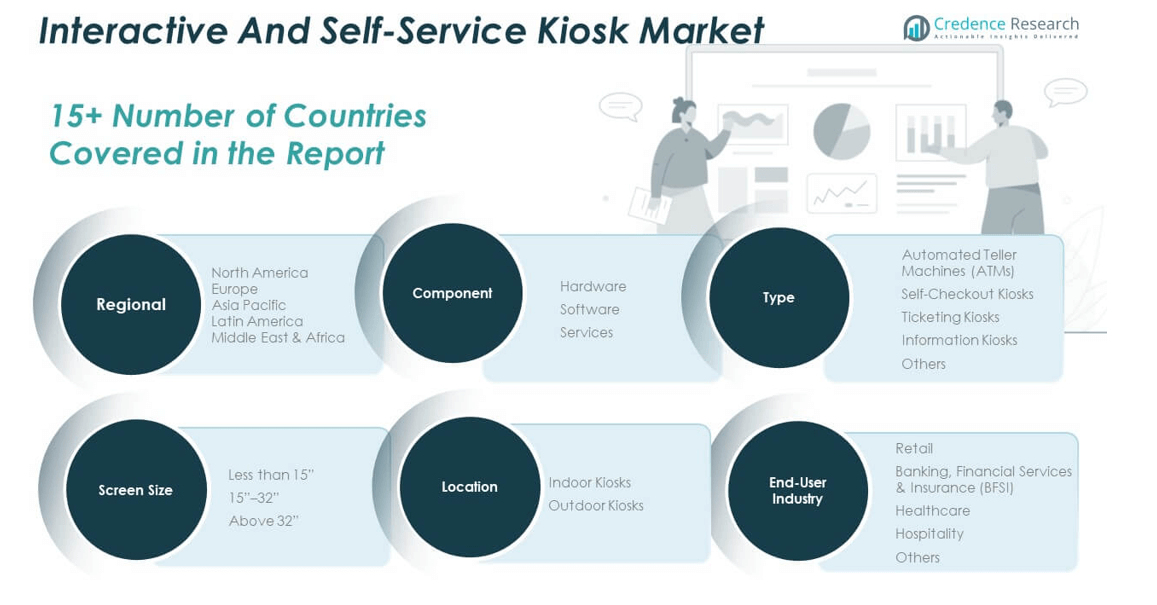
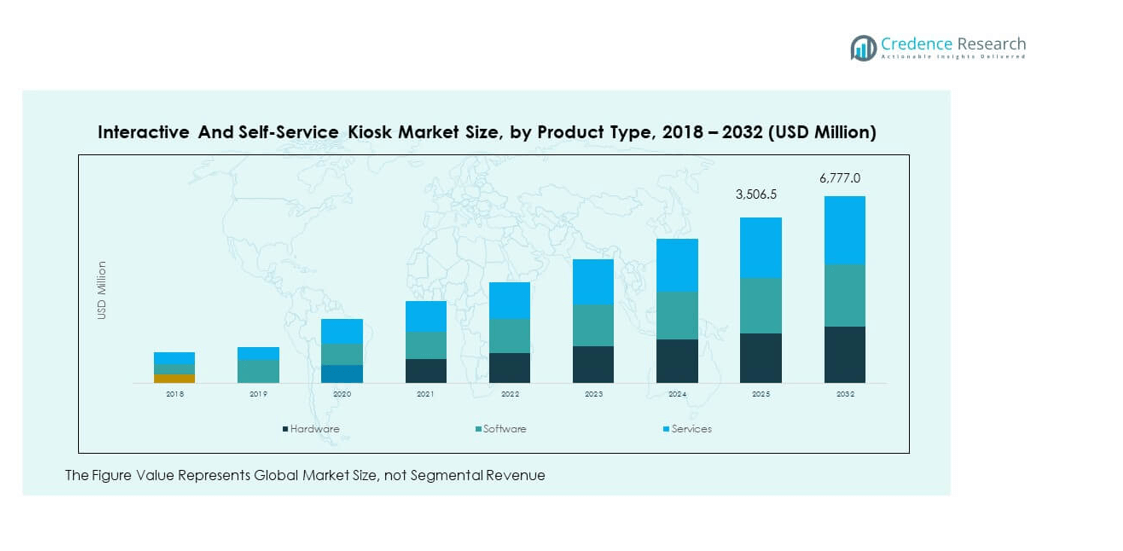
8.1. Interactive And Self-Service Kiosk Market Overview by Component Segment
8.1.1. Interactive And Self-Service Kiosk Market Revenue Share By Component
8.2. Hardware
8.3. Software
8.4. Services
CHAPTER NO. 9 : INTERACTIVE AND SELF-SERVICE KIOSK MARKET – BY TYPE SEGMENT ANALYSIS
9.1. Interactive And Self-Service Kiosk Market Overview by Type Segment
9.1.1. Interactive And Self-Service Kiosk Market Revenue Share By Type
9.2. Automated Teller Machines (ATMs)
9.3. Self-Checkout Kiosks
9.4. Ticketing Kiosks
9.5 Information Kiosks
9.6. Others
CHAPTER NO. 10 : INTERACTIVE AND SELF-SERVICE KIOSK MARKET – BY SCREEN SIZE SEGMENT ANALYSIS
10.1. Interactive And Self-Service Kiosk Market Overview by Screen Size Segment
10.1.1. Interactive And Self-Service Kiosk Market Revenue Share By Screen Size
10.2. Less than 15”
10.3. 15”–32”
10.4. Above 32”
CHAPTER NO. 11 : INTERACTIVE AND SELF-SERVICE KIOSK MARKET – BY END-USER INDUSTRY SEGMENT ANALYSIS
11.1. Interactive And Self-Service Kiosk Market Overview by End-User Industry Segment
11.1.1. Interactive And Self-Service Kiosk Market Revenue Share By End-User Industry
11.2. Retail
11.3. Banking, Financial Services & Insurance (BFSI)
11.4. Healthcare
11.5. Hospitality
11.6. Others
CHAPTER NO. 12 : INTERACTIVE AND SELF-SERVICE KIOSK MARKET – BY LOCATION SEGMENT ANALYSIS
12.1. Interactive And Self-Service Kiosk Market Overview by Location Segment
12.1.1. Interactive And Self-Service Kiosk Market Revenue Share By Location
12.2. Indoor Kiosks
12.3. Outdoor Kiosks
CHAPTER NO. 13 : INTERACTIVE AND SELF-SERVICE KIOSK MARKET – REGIONAL ANALYSIS
13.1. Interactive And Self-Service Kiosk Market Overview by Region Segment
13.1.1. Global Interactive And Self-Service Kiosk Market Revenue Share By Region
13.1.2. Regions
13.1.3. Global Interactive And Self-Service Kiosk Market Revenue By Region
13.1.4. Component
13.1.5. Global Interactive And Self-Service Kiosk Market Revenue By Component
13.1.6. Deployment
13.1.7. Global Interactive And Self-Service Kiosk Market Revenue By Deployment
13.1.8. Screen Size
13.1.9. Global Interactive And Self-Service Kiosk Market Revenue By Screen Size
13.1.10. End-User Industry
13.1.12. Global Interactive And Self-Service Kiosk Market Revenue By End-User Industry
13.1.13. Location
13.1.14. Global Interactive And Self-Service Kiosk Market Revenue By Location
CHAPTER NO. 14 : NORTH AMERICA INTERACTIVE AND SELF-SERVICE KIOSK MARKET – COUNTRY ANALYSIS
14.1. North America Interactive And Self-Service Kiosk Market Overview by Country Segment
14.1.1. North America Interactive And Self-Service Kiosk Market Revenue Share By Region
14.2. North America
14.2.1. North America Interactive And Self-Service Kiosk Market Revenue By Country
14.2.2. Component
14.2.3. North America Interactive And Self-Service Kiosk Market Revenue By Component
14.2.4. Deployment
14.2.5. North America Interactive And Self-Service Kiosk Market Revenue By Deployment
14.2.6. Screen Size
14.2.7. North America Interactive And Self-Service Kiosk Market Revenue By Screen Size
14.2.8. End-User Industry
14.2.9. North America Interactive And Self-Service Kiosk Market Revenue By End-User Industry
14.2.10. Location
14.2.11. North America Interactive And Self-Service Kiosk Market Revenue By Location
14.3. U.S.
14.4. Canada
14.5. Mexico
CHAPTER NO. 15 : EUROPE INTERACTIVE AND SELF-SERVICE KIOSK MARKET – COUNTRY ANALYSIS
15.1. Europe Interactive And Self-Service Kiosk Market Overview by Country Segment
15.1.1. Europe Interactive And Self-Service Kiosk Market Revenue Share By Region
15.2. Europe
15.2.1. Europe Interactive And Self-Service Kiosk Market Revenue By Country
15.2.2. Component
15.2.3. Europe Interactive And Self-Service Kiosk Market Revenue By Component
15.2.4. Deployment
15.2.5. Europe Interactive And Self-Service Kiosk Market Revenue By Deployment
15.2.6. Screen Size
15.2.7. Europe Interactive And Self-Service Kiosk Market Revenue By Screen Size
15.2.8. End-User Industry
15.2.9. Europe Interactive And Self-Service Kiosk Market Revenue By End-User Industry
15.2.10. Location
15.2.11. Europe Interactive And Self-Service Kiosk Market Revenue By Location
15.3. UK
15.4. France
15.5. Germany
15.6. Italy
15.7. Spain
15.8. Russia
15.9. Rest of Europe
CHAPTER NO. 16 : ASIA PACIFIC INTERACTIVE AND SELF-SERVICE KIOSK MARKET – COUNTRY ANALYSIS
16.1. Asia Pacific Interactive And Self-Service Kiosk Market Overview by Country Segment
16.1.1. Asia Pacific Interactive And Self-Service Kiosk Market Revenue Share By Region
16.2. Asia Pacific
16.2.1. Asia Pacific Interactive And Self-Service Kiosk Market Revenue By Country
16.2.2. Component
16.2.3. Asia Pacific Interactive And Self-Service Kiosk Market Revenue By Component
16.2.4. Deployment
16.2.5. Asia Pacific Interactive And Self-Service Kiosk Market Revenue By Deployment
16.2.6. Screen Size
16.2.7. Asia Pacific Interactive And Self-Service Kiosk Market Revenue By Screen Size
16.2.8. End-User Industry
16.2.9. Asia Pacific Interactive And Self-Service Kiosk Market Revenue By End-User Industry
16.2.10. Location
16.2.11. Asia Pacific Interactive And Self-Service Kiosk Market Revenue By Location
16.3. China
16.4. Japan
16.5. South Korea
16.6. India
16.7. Australia
16.8. Southeast Asia
16.9. Rest of Asia Pacific
CHAPTER NO. 17 : LATIN AMERICA INTERACTIVE AND SELF-SERVICE KIOSK MARKET – COUNTRY ANALYSIS
17.1. Latin America Interactive And Self-Service Kiosk Market Overview by Country Segme
17.1.1. Latin America Interactive And Self-Service Kiosk Market Revenue Share By Region
17.2. Latin America
17.2.1. Latin America Interactive And Self-Service Kiosk Market Revenue By Country
17.2.2. Component
17.2.3. Latin America Interactive And Self-Service Kiosk Market Revenue By Component
17.2.4. Deployment
17.2.5. Latin America Interactive And Self-Service Kiosk Market Revenue By Deployment
17.2.6. Screen Size
17.2.7. Latin America Interactive And Self-Service Kiosk Market Revenue By Screen Size
17.2.8. End-User Industry
17.2.9. Latin America Interactive And Self-Service Kiosk Market Revenue By End-User Industry
17.2.10. Location
17.2.11. Latin America Interactive And Self-Service Kiosk Market Revenue By Location
17.3. Brazil
17.4. Argentina
17.5. Rest of Latin America
CHAPTER NO. 18 : MIDDLE EAST INTERACTIVE AND SELF-SERVICE KIOSK MARKET – COUNTRY ANALYSIS
18.1. Middle East Interactive And Self-Service Kiosk Market Overview by Country Segment
18.1.1. Middle East Interactive And Self-Service Kiosk Market Revenue Share By Region
18.2. Middle East
18.2.1. Middle East Interactive And Self-Service Kiosk Market Revenue By Country
18.2.2. Component
18.2.3. Middle East Interactive And Self-Service Kiosk Market Revenue By Component
18.2.4. Deployment
18.2.5. Middle East Interactive And Self-Service Kiosk Market Revenue By Deployment
18.2.6. Screen Size
18.2.7. Middle East Interactive And Self-Service Kiosk Market Revenue By Screen Size
18.2.8. End-User Industry
18.2.9. Middle East Interactive And Self-Service Kiosk Market Revenue By End-User Industry
18.2.10. Location
18.2.11. Middle East Interactive And Self-Service Kiosk Market Revenue By Location
18.3. GCC Countries
18.4. Israel
18.5. Turkey
18.6. Rest of Middle East
CHAPTER NO. 19 : AFRICA INTERACTIVE AND SELF-SERVICE KIOSK MARKET – COUNTRY ANALYSIS
19.1. Africa Interactive And Self-Service Kiosk Market Overview by Country Segment
19.1.1. Africa Interactive And Self-Service Kiosk Market Revenue Share By Region
19.2. Africa
19.2.1. Africa Interactive And Self-Service Kiosk Market Revenue By Country
19.2.2. Component
19.2.3. Africa Interactive And Self-Service Kiosk Market Revenue By Component
19.2.4. Deployment
19.2.5. Africa Interactive And Self-Service Kiosk Market Revenue By Deployment
19.2.6. Screen Size
19.2.7. Africa Interactive And Self-Service Kiosk Market Revenue By Screen Size
19.2.8. End-User Industry
19.2.9. Africa Interactive And Self-Service Kiosk Market Revenue By End-User Industry
19.2.10. Location
19.2.11. Africa Interactive And Self-Service Kiosk Market Revenue By Location
19.3. South Africa
19.4. Egypt
19.5. Rest of Africa
CHAPTER NO. 20 : COMPANY PROFILES
20.1. Advantech Co., Ltd.
20.1.1. Company Overview
20.1.2. Product Portfolio
20.1.3. Financial Overview
20.1.4. Recent Developments
20.1.5. Growth Strategy
20.1.6. SWOT Analysis
20.2. Diebold Nixdorf, Incorporated
20.3. DynaTouch Corporation
20.4. Embross
20.5. Frank Mayer and Associates, Inc.
20.6. Glory Global Solutions Ltd.
20.7. GRGBanking
20.8. IER
20.9. Aksor SAS
20.10. Azkoyen SA
20.11. Diebold Nixdorf, Incorporated.
20.12. Embross Systems Pvt
20.13. Fuji Electric Co., Ltd.
20.14. Thales Group
20.15. Hitachi Payment Services Pvt. Ltd.
20.16. KIOSK Information Systems