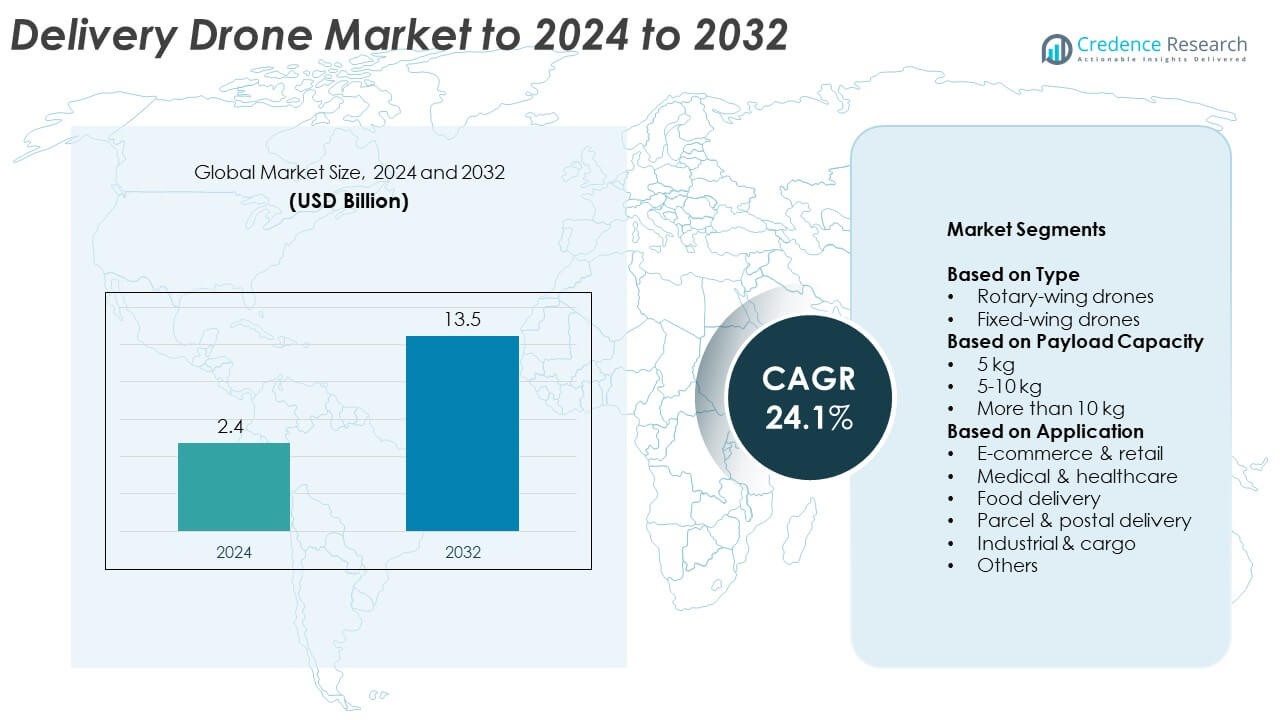
Delivery Drones Market By Type (Multi-rotor, Fixed-wing, Single-rotor, Hybrid VTOL) By Payload (Less than 2 kg, 2-5 kg, More than 5 kg) By Range (Less, than 25 km, More than 25 km) By End User (Healthcare Retailers & E-commerce, Food & Beverages, Logistics, Other End Users): Growth, Future Prospects & Competitive Analysis, 2016 – 2028

Report ID: 4923 | Report Format : Excel, PDF

About this report

The Global Delivery Drones Market report explores the critical analysis of the delivery drones industry using key parameters. The report consists of investment strategies, the need for investments in the delivery drones industry, and the multiple benefits for the investors. Importantly, this report sets out major changes in the global technical regulations for the delivery drone industry and how economic and non-economic barriers are helping the market grow. Moreover, the report analyses the global, regional, and country-level historic and forecasted market size. The report also provides a comprehensive analysis of key investment propositions, demand and supply gap, competitors positioning, STAR analysis, SRC analysis, and Tornado analysis. Key technological developments and other analyses such as porter’s five forces analysis, PESTEL analysis, value chain analysis, etc.

Delivery Drones Market


Key Highlights of the report

How are the major segments performing in the Delivery Drones Market?

  • The Hybrid VTOL segment led the market in terms of type in 2021 and is expected to continue throughout the projection period. The benefits of multi-rotor platforms with fixed-wing drones and the transition between the two modes during the flight are attributed to the segment’s growth. The ability to take off and land vertically without using a launcher or runway and an AI-based anti-collision mechanism enabled hybrid VTOL delivery drones to operate anywhere.
  • In 2021, the more than 5 kg segment in payload led the market. The use of this segment in aerial shipping of packages weighing more than 5 kg is responsible for its growth. Delivery drones transport goods in both rural and densely populated areas. These drones can transport critical supplies during medical emergencies and natural disasters. As a result, these factors encourage the use of delivery drones. 
  • In 2021, the more than 25 km segment in range led the market. The use of drones to provide shipping services over distances of more than 25 km is primarily responsible for the segment’s growth. These drones are used in various industries, including logistics, e-commerce, healthcare, retail, and food and beverage. The ability of these drones to deliver goods over distances of more than 25 km has prompted numerous companies worldwide to adopt drone services.
  • In the end-user category, the logistics sector held the largest market share in 2021. High speed, doorstep delivery, eliminating the need for road transportation, and cost-effectiveness all contribute to the increased use of delivery drones in logistics. Major e-commerce companies and local postal authorities are launching drone delivery services in collaboration with local governments to reduce the effort required to deliver packages and parcels to remote islands, mountainous areas, and cities.

Access crucial information at unmatched prices!

Request your sample report today & start making informed decisions powered by Credence Research Inc.!

Download Sample

Which region dominated the Delivery Drones Market?

North America dominated the delivery drones market in 2021 and is expected to continue its dominance over the forecast period. The increasing investments by key players to promote parcel drone delivery service platforms, as well as the increasing government measures to support the use of drone delivery services, are the key factors driving the North American market growth. The region has adopted delivery drone technology more frequently due to the rising demand for same-day delivery of e-commerce goods, the growing number of ongoing drone testing trials, and various Federal Aviation Administration (FAA) regulatory frameworks implemented by governments in nations like the U.S. and Canada. North American governments have granted licenses to companies such as Amazon.com Inc, Drone Delivery Canada Corp. (DDC), and Wing Aviation to operate package-delivery services using delivery drones. Government approvals have encouraged various public companies, private companies, and startups to use drone services to deliver food & beverages, retail goods, and medical supplies.

What is the competitive environment of the Delivery Drones Market?

The delivery drones industry’s competitive environment offers information on the total economic profit made by suppliers and businesses, the sales and revenues produced in this sector, the delivery drones market share globally, the business organization overview, the introduction of new products, and the opportunities for the industrial delivery drones market. For instance, in April 2022, Tulpar Research Labs joined the Drone Logistics Ecosystem to collaborate with its members, specifically AirGo, on developing standardized products and services for the drone delivery sector. On the other hand, Flytrex plans to expand its drone delivery service into Texas in March 2022. The Israeli company is expanding its partnership with Brinker International, the restaurant conglomerate that owns well-known brands like Chili and Maggiano’s. Those who live nearby can order food from those locations using the Flytrex app. Food should be delivered to a customer’s front or backyard in under five minutes, according to the company.

Executive Summary

What are all technical developments being developed in the Delivery Drones Market?

Technological advancements such as VTOL, IoT, geospatial mapping, and machine learning result in higher package delivery accuracy, fueling the market’s growth. Drone technology is used in various industries, including quick-service restaurants, logistics, e-commerce, and healthcare. Several logistics and transportation companies are heavily investing in developing effective technical infrastructure for airborne delivery via drones. Companies such as United Parcel Service of America (UPS), Zipline, and Deutsche Post DHL Group have established new technical platforms for commercial delivery services in recent years. For instance, in March 2020, UPS partnered with Wing copter to develop next-generation cargo drones with new features such as switching from VTOL to fixed-wing forward flight for high speed, long-range, and high take-off weight. These drones can support a wider range of industries and utilities. Technological advances in these systems enable drone package delivery operations to be carried out autonomously and safely, contributing to their increased adoption in the drone delivery ecosystem.

Which are the key investments by the players in the Delivery Drones Market?

The primary market driving factors are increasing investments by key players to promote parcel drone delivery service platforms and increasing government measures to support the use of drone delivery services. Significant investments in developing drone delivery technology continued in 2022, with many operators completing drone delivery test flights. For instance, ITOCHU Corporation announced a partnership with Wingcopter to distribute and lease the Wingcopter 198 in Japan beginning in March 2022. The Japanese corporation also made a strategic investment in Wingcopter. Market participants are focusing on strategic investments to increase their market presence. In March 2021, Flytrex, an Israeli drone delivery startup, raised $8 million in funding to expand in the United States.

Some of the major players in the market are Boeing Co, Amazon.com Inc, Airbus SE, Drone Delivery Canada Corp, Wing Aviation LLC, Flirtey, Zipline, Wingcopter GmbH, Flytrex Inc, Matternet Inc, Deutsche Post DHL Group, United Parcel Services, SF Express Co. Ltd, FLI Drone, and Rakuten Group Inc.

What are the Major Driving Factors for the Delivery Drones Market?

The increased use of drones in e-commerce, quick service restaurants, and healthcare supplies, as well as the introduction of hybrid drones for the logistics and transportation sectors, are some of the major factors driving the market growth. The market is expanding due to improvements in drone technology, a rise in the demand for quicker deliveries, and the need to reduce carbon emissions. The market is further enhanced by technological developments like VTOL, geospatial mapping, machine learning, and IoT, which increase the accuracy of package delivery.

What are the Major Risks for the Delivery Drones Market?

In the lack of more clearly defined regulatory requirements and restricted flying restrictions, the higher infrastructure cost is justifiable due to the need for many drone instructors to facilitate last-mile deliveries to meet client expectations. The lack of charging stations, micro-fulfillment centers, and drone flight operations centers is expected to impede market growth over the forecast period. Drone delivery is highly dependent on the weather. For instance, when it’s very hot outside, the air density decreases, impacting the lifting power of drones. The cold season also severely impacts the drone’s ability to store energy. Moreover, the main consideration with aerial delivery drones in civil and commercial applications is operational security. As a result, there have been more drone hacking incidents in various regions due to the growing use of aerial delivery drones in these applications.

Which is the key End-user in the Delivery Drones Market

The logistics sector dominated the delivery drones market in 2021, owing to increased demand for drones to deliver packages and parcels from retailers, e-commerce suppliers, last-mile delivery services companies, shore-to-ship drone operational processes, and postal companies. Major e-commerce businesses and municipal postal authorities are launching drone delivery services in collaboration with local governments to reduce the effort required to deliver packages and parcels to remote islands, mountainous areas, and cities. Due to a shortage of delivery personnel and the impact of the global pandemic, it is more important than ever to respond to logistics changes. Drones may help realize automatic, contactless delivery services in remote areas, boosting demand for the segment during the forecast period.

How is the Delivery Drones Market performing in regions?

North America dominated the global market for delivery drones in 2021. The rising popularity of online shopping on e-commerce platforms and the favorable FAA regulations in the U.S. are both responsible for the region’s growth. The region is expected to grow during the forecast period due to the efforts of numerous U.S. businesses to commercialize drone package delivery in the area for applications in the food, pharmaceutical, logistics, and retail sectors. For instance, Alphabet’s Wing is a drone delivery service in collaboration with FedEx (U.S.) and Walgreens (U.S.). It delivers FedEx packages and health and wellness products from Walgreens, such as over-the-counter prescription drugs.

Besides, Asia-Pacific is projected to expand the most over the forecast period. The region’s expansion of drone delivery services is fueled by the countries’ shifting regulations and growing support for commercial drone operations. Due to increased drone delivery operations by significant e-commerce companies like Alibaba Group and JD.com, China is the region’s largest market for delivery drones. Meituan, one of China’s largest internet organizations, has flown 19,000 meals to 8,000 customers across Shenzhen, a city of nearly 20 million people, in the last two years. The Chinese government adopted a new Configuration for Express Delivery Services by Unmanned Aircraft through the People’s Republic of China’s State Post Bureau, which went into effect in January 2021. Likewise, the Indian government intends to establish drone lanes to improve cargo transportation services.

What is the regulatory landscape for the Delivery Drones Market?

With the growing demands for drone delivery services worldwide, various countries are soothing regulations to allow drones to operate in their airspace, which is expected to accelerate the growth in drone procurements to provide new delivery routes for remote areas during the forecast period. The U.S. FAA regulations are favorable. Many U.S. companies are working to commercialize drone package delivery for food, pharmaceutical, logistics, and retail applications in North America. For instance, Flytrex received FAA clearance for drone delivery and flight over people in May 2021, enabling the business to increase retail drone delivery services in Fayetteville, North Carolina (United States). The FAA granted the company permission in December 2021 to increase its delivery radius to one nautical mile across all its operating stations in North Carolina.

What is the Market Size of the Delivery Drones Market regarding value?

The global delivery drone market is anticipated to grow at a substantial CAGR of 11.9% in the upcoming years. The global delivery drone industry was estimated to be worth USD 1.2 billion in 2021 and was expected to be worth USD 2.35 billion by 2028.

Shape Your Report to Specific Countries or Regions & Enjoy 30% Off!

What are major players planning for the future of the Delivery Drones Market?

The use of delivery drones and drone technology is inevitable. Many industries will soon use drone technology to advance their business sectors, such as surveillance, research, last-mile delivery, etc. E-commerce giant companies have been at the forefront of drone technology research, development, and patent filing. They are heavily investing in this area. They focus on lowering the cost of operations in last-mile delivery, improving delivery time, and integrating drone technology with mobile phone applications to provide better user experiences. Furthermore, the major players are expected to acquire or merge with major companies or startups to gain a competitive advantage. For instance, Wing Aviation LLC partnered with Kentucky Fried Chicken (KFC) (Australia) in February 2022 to deliver various hot and fresh menu items directly to homes and workplaces in Logan, Queensland.

Segmentation of Global Delivery Drones Market –

Global Delivery Drones Market – By Type

  • Multi-rotor
  • Fixed-wing
  • Single-rotor
  • Hybrid VTOL

 Global Delivery Drones Market – By Payload

  • Less than 2 kg
  • 2-5 kg
  • More than 5 kg

Global Delivery Drones Market – By Range

  • Less than 25 km
  • More than 25 km

Global Delivery Drones Market – By End User

  • Healthcare
  • Retailers & E-commerce
  • Food & Beverages
  • Logistics
  • Other End Users

Global Delivery Drones Market – By Region

  • North America
    • The U.S.
    • Canada
  • Europe
    • Germany
    • France
    • The U.K.
    • Italy
    • Spain
    • Rest of Europe
  • Asia Pacific
    • China
    • Japan
    • India
    • South Korea
    • South-east Asia
    • Rest of Asia Pacific
  • Latin America
    • Brazil
    • Mexico
    • Rest of Latin America
  • Middle East & Africa
    • GCC Countries
    • South Africa
    • Rest of the Middle East and Africa

1. Preface
1.1. Report Description
1.1.1. Purpose of the Report
1.1.2. Target Audience
1.1.3. USP and Key Offerings
1.2. Research Scope
1.3. Research Methodology
1.3.1. Phase I – Secondary Research
1.3.2. Phase II – Primary Research
1.3.3. Phase III – Expert Panel Review
1.3.4. Approach Adopted
1.3.4.1. Top-Down Approach
1.3.4.2. Bottom-Up Approach
1.3.5. Assumptions
1.4. Market Segmentation

2. Executive Summary
2.1. Market Snapshot: Global Delivery Drones Market
2.2. Global Delivery Drones Market, By Type
2.3. Global Delivery Drones Market, By Payload
2.4. Global Delivery Drones Market, By Range
2.5. Global Delivery Drones Market, By End User
2.6. Global Delivery Drones Market, By Region

3. Market Dynamics & Factors Analysis
3.1. Introduction
3.1.1. Global Delivery Drones Market Value, 2016-2028, (US$ Bn)
3.2. Market Dynamics
3.2.1. Key Growth Trends
3.2.2. Market Drivers
3.2.3. Market Restraints
3.2.4. Market Opportunities
3.2.5. Major Industry Challenges
3.3. Attractive Investment Proposition,2021
3.3.1. Type
3.3.2. Payload
3.3.3. Range
3.3.4. End User
3.3.5. Geography

4. Premium Insights
4.1. STAR (Situation, Task, Action, Results) Analysis
4.2. Porter’s Five Forces Analysis
4.2.1. Threat of New Entrants
4.2.2. Bargaining Power of Buyers/Consumers
4.2.3. Bargaining Power of Suppliers
4.2.4. Threat of Substitute Types
4.2.5. Intensity of Competitive Rivalry
4.3. Value Chain Analysis
4.4. Technology Analysis
4.5. Marketing Strategy Analysis
4.5.1. Direct Marketing
4.5.2. Indirect Marketing
4.5.3. Marketing Channel Development Trend

5. Market Positioning of Key Players, 2021
5.1. Company market share of key players, 2021
5.2. Competitive Benchmarking
5.3. Market Positioning of Key Vendors
5.4. Geographical Presence Analysis
5.5. Major Strategies Adopted by Key Players
5.5.1. Key Strategies Analysis
5.5.2. Mergers and Acquisitions
5.5.3. Partnerships
5.5.4. Product Launch
5.5.5. Geographical Expansion
5.5.6. Others

6. COVID 19 Impact Analysis
6.1. Global Delivery Drones Market Pre Vs Post COVID 19, 2019 – 2028
6.2. Impact on Import & Export
6.3. Impact on Demand & Supply

7. Global Delivery Drones Market
7.1. Global Delivery Drones Market, by Type, 2016-2028(US$ Bn)
7.1.1. Overview
7.1.2. Global Delivery Drones Market, By Type, 2021 vs 2028 (in%)
7.1.3. Global Delivery Drones Market, By Multi-rotor, 2016-2028 (US$ Bn)
7.1.4. Global Delivery Drones Market, By Fixed-wing, 2016-2028 (US$ Bn)
7.1.5. Global Delivery Drones Market, By Single-rotor, 2016-2028 (US$ Bn)
7.1.6. Global Delivery Drones Market, By Hybrid VTOL, 2016-2028 (US$ Bn)
7.2. Global Delivery Drones Market, by Payload, 2016-2028(US$ Bn)
7.2.1. Overview
7.2.2. Global Delivery Drones Market, By Payload, 2021 vs 2028 (in%)
7.2.3. Global Delivery Drones Market, By Less than 2 kg, 2016-2028 (US$ Bn)
7.2.4. Global Delivery Drones Market, By 2-5 kg, 2016-2028 (US$ Bn)
7.2.5. Global Delivery Drones Market, By More than 5 kg, 2016-2028 (US$ Bn)
7.3. Global Delivery Drones Market, by Range, 2016-2028(US$ Bn)
7.3.1. Overview
7.3.2. Global Delivery Drones Market, By Range, 2021 vs 2028 (in%)
7.3.3. Global Delivery Drones Market, By Less than 25 km, 2016-2028 (US$ Bn)
7.3.4. Global Delivery Drones Market, By More than 25 km, 2016-2028 (US$ Bn)
7.4. Global Delivery Drones Market, by End User, 2016-2028(US$ Bn)
7.4.1. Overview
7.4.2. Global Delivery Drones Market, By End User, 2021 vs 2028 (in%)
7.4.3. Global Delivery Drones Market, By Healthcare, 2016-2028 (US$ Bn)
7.4.4. Global Delivery Drones Market, By Retailers & E-commerce, 2016-2028 (US$ Bn)
7.4.5. Global Delivery Drones Market, By Food & Beverages, 2016-2028 (US$ Bn)
7.4.6. Global Delivery Drones Market, By Logistics, 2016-2028 (US$ Bn)
7.4.7. Global Delivery Drones Market, By Other End Users, 2016-2028 (US$ Bn)
8. North America Delivery Drones Market Analysis
8.1. North America Delivery Drones Market, by Type, 2016-2028(US$ Bn)
8.1.1. Overview
8.1.2. SRC Analysis
8.2. North America Delivery Drones Market, by Payload, 2016-2028(US$ Bn)
8.2.1. Overview
8.2.2. SRC Analysis
8.3. North America Delivery Drones Market, by Range, 2016-2028(US$ Bn)
8.3.1. Overview
8.3.2. SRC Analysis
8.4. North America Delivery Drones Market, by End User, 2016-2028(US$ Bn)
8.4.1. Overview
8.4.2. SRC Analysis
8.5. North America Delivery Drones Market, by Country, 2016-2028 (US$ Bn)
8.5.1. U.S.
8.5.1.1. U.S. Delivery Drones Market Estimates and Forecast, 2016-2028 (US$ Bn)
8.5.1.2. U.S. Delivery Drones Market, By Type, 2016-2028 (US$ Bn)
8.5.1.3. U.S. Delivery Drones Market, By Payload, 2016-2028 (US$ Bn)
8.5.1.4. U.S. Delivery Drones Market, By Range, 2016-2028 (US$ Bn)
8.5.1.5. U.S. Delivery Drones Market, By End User, 2016-2028 (US$ Bn)
8.5.2. Canada
8.5.2.1. Canada Delivery Drones Market Estimates and Forecast, 2016-2028 (US$ Bn)
8.5.2.2. Canada Delivery Drones Markets, By Type, 2016-2028 (US$ Bn)
8.5.2.3. Canada Delivery Drones Market, By Payload, 2016-2028 (US$ Bn)
8.5.2.4. Canada Delivery Drones Market, By Range, 2016-2028 (US$ Bn)
8.5.2.5. Canada Delivery Drones Market, By End User, 2016-2028 (US$ Bn)

9. Europe Delivery Drones Market Analysis
9.1. Europe Delivery Drones Market, by Type, 2016-2028(US$ Bn)
9.1.1. Overview
9.1.2. SRC Analysis
9.2. Europe Delivery Drones Market, by Payload, 2016-2028(US$ Bn)
9.2.1. Overview
9.2.2. SRC Analysis
9.3. Europe Delivery Drones Market, by Range, 2016-2028(US$ Bn)
9.3.1. Overview
9.3.2. SRC Analysis
9.4. Europe Delivery Drones Market, by End User, 2016-2028(US$ Bn)
9.4.1. Overview
9.4.2. SRC Analysis
9.5. Europe Delivery Drones Market, by Country, 2016-2028 (US$ Bn)
9.5.1. Germany
9.5.1.1. Germany Delivery Drones Market Estimates and Forecast, 2016-2028 (US$ Bn)
9.5.1.2. Germany Delivery Drones Market, By Type, 2016-2028 (US$ Bn)
9.5.1.3. Germany Delivery Drones Market, By Payload, 2016-2028 (US$ Bn)
9.5.1.4. Germany Delivery Drones Market, By Range, 2016-2028 (US$ Bn)
9.5.1.5. Germany Delivery Drones Market, By End User, 2016-2028 (US$ Bn)
9.5.2. France
9.5.2.1. France Delivery Drones Market Estimates and Forecast, 2016-2028 (US$ Bn)
9.5.2.2. France Delivery Drones Market, By Type, 2016-2028 (US$ Bn)
9.5.2.3. France Delivery Drones Market, By Payload, 2016-2028 (US$ Bn)
9.5.2.4. France Delivery Drones Market, By Range, 2016-2028 (US$ Bn)
9.5.2.5. France Delivery Drones Market, By End User, 2016-2028 (US$ Bn)
9.5.3. UK
9.5.3.1. UK Delivery Drones Market Estimates and Forecast, 2016-2028 (US$ Bn)
9.5.3.2. UK Delivery Drones Market, By Type, 2016-2028 (US$ Bn)
9.5.3.3. UK Delivery Drones Market, By Payload, 2016-2028 (US$ Bn)
9.5.3.4. UK Delivery Drones Market, By Range, 2016-2028 (US$ Bn)
9.5.3.5. UK Delivery Drones Market, By End User, 2016-2028 (US$ Bn)
9.5.4. Italy
9.5.4.1. Italy Delivery Drones Market Estimates and Forecast, 2016-2028 (US$ Bn)
9.5.4.2. Italy Delivery Drones Market, By Type, 2016-2028 (US$ Bn)
9.5.4.3. Italy Delivery Drones Market, By Payload, 2016-2028 (US$ Bn)
9.5.4.4. Italy Delivery Drones Market, By Range, 2016-2028 (US$ Bn)
9.5.4.5. Italy Delivery Drones Market, By End User, 2016-2028 (US$ Bn)
9.5.5. Spain
9.5.5.1. Spain Delivery Drones Market Estimates and Forecast, 2016-2028 (US$ Bn)
9.5.5.2. Spain Delivery Drones Market, By Type, 2016-2028 (US$ Bn)
9.5.5.3. Spain Delivery Drones Market, By Payload, 2016-2028 (US$ Bn)
9.5.5.4. Spain Delivery Drones Market, By Range, 2016-2028 (US$ Bn)
9.5.5.5. Spain Delivery Drones Market, By End User, 2016-2028 (US$ Bn)
9.5.6. Rest of Europe
9.5.6.1. Rest of Europe Delivery Drones Market Estimates and Forecast, 2016-2028 (US$ Bn)
9.5.6.2. Rest of Europe Delivery Drones Market, By Type, 2016-2028 (US$ Bn)
9.5.6.3. Rest of Europe Delivery Drones Market, By Payload, 2016-2028 (US$ Bn)
9.5.6.4. Rest of Europe Delivery Drones Market, By Range, 2016-2028 (US$ Bn)
9.5.6.5. Rest of Europe Delivery Drones Market, By End User, 2016-2028 (US$ Bn)

10. Asia Pacific Delivery Drones Market Analysis
10.1. Asia Pacific Delivery Drones Market, by Type, 2016-2028(US$ Bn)
10.1.1. Overview
10.1.2. SRC Analysis
10.2. Asia Pacific Delivery Drones Market, by Payload, 2016-2028(US$ Bn)
10.2.1. Overview
10.2.2. SRC Analysis
10.3. Asia Pacific Delivery Drones Market, by Range, 2016-2028(US$ Bn)
10.3.1. Overview
10.3.2. SRC Analysis
10.4. Asia Pacific Delivery Drones Market, by End User, 2016-2028(US$ Bn)
10.4.1. Overview
10.4.2. SRC Analysis
10.5. Asia Pacific Delivery Drones Market, by Country, 2016-2028 (US$ Bn)
10.5.1. China
10.5.1.1. China Delivery Drones Market Estimates and Forecast, 2016-2028 (US$ Bn)
10.5.1.2. China Delivery Drones Market, By Type, 2016-2028 (US$ Bn)
10.5.1.3. China Delivery Drones Market, By Payload, 2016-2028 (US$ Bn)
10.5.1.4. China Delivery Drones Market, By Range, 2016-2028 (US$ Bn)
10.5.1.5. China Delivery Drones Market, By End User, 2016-2028 (US$ Bn)
10.5.2. Japan
10.5.2.1. Japan Delivery Drones Market Estimates and Forecast, 2016-2028 (US$ Bn)
10.5.2.2. Japan Delivery Drones Market, By Type, 2016-2028 (US$ Bn)
10.5.2.3. Japan Delivery Drones Market, By Payload, 2016-2028 (US$ Bn)
10.5.2.4. Japan Delivery Drones Market, By Range, 2016-2028 (US$ Bn)
10.5.2.5. Japan Delivery Drones Market, By End User, 2016-2028 (US$ Bn)
10.5.3. India
10.5.3.1. India Delivery Drones Market Estimates and Forecast, 2016-2028 (US$ Bn)
10.5.3.2. India Delivery Drones Market, By Type, 2016-2028 (US$ Bn)
10.5.3.3. India Delivery Drones Market, By Payload, 2016-2028 (US$ Bn)
10.5.3.4. India Delivery Drones Market, By Range, 2016-2028 (US$ Bn)
10.5.3.5. India Delivery Drones Market, By End User, 2016-2028 (US$ Bn)
10.5.4. South Korea
10.5.4.1. South Korea Delivery Drones Market Estimates and Forecast, 2016-2028 (US$ Bn)
10.5.4.2. South Korea Delivery Drones Market, By Type, 2016-2028 (US$ Bn)
10.5.4.3. South Korea Delivery Drones Market, By Payload, 2016-2028 (US$ Bn)
10.5.4.4. South Korea Delivery Drones Market, By Range, 2016-2028 (US$ Bn)
10.5.4.5. South Korea Delivery Drones Market, By End User, 2016-2028 (US$ Bn)
10.5.5. South-East Asia
10.5.5.1. South-East Asia Delivery Drones Market Estimates and Forecast, 2016-2028 (US$ Bn)
10.5.5.2. South-East Asia Delivery Drones Market, By Type, 2016-2028 (US$ Bn)
10.5.5.3. South-East Asia Delivery Drones Market, By Payload, 2016-2028 (US$ Bn)
10.5.5.4. South-East Asia Delivery Drones Market, By Range, 2016-2028 (US$ Bn)
10.5.5.5. South-East Asia Delivery Drones Market, By End User, 2016-2028 (US$ Bn)
10.5.6. Rest of Asia Pacific
10.5.6.1. Rest of Asia Pacific Delivery Drones Market Estimates and Forecast, 2016-2028 (US$ Bn)
10.5.6.2. Rest of Asia Pacific Delivery Drones Market, By Type, 2016-2028 (US$ Bn)
10.5.6.3. Rest of Asia Pacific Delivery Drones Market, By Payload, 2016-2028 (US$ Bn)
10.5.6.4. Rest of Asia Pacific Delivery Drones Market, By Range, 2016-2028 (US$ Bn)
10.5.6.5. Rest of Asia Pacific Delivery Drones Market, By End User, 2016-2028 (US$ Bn)

11. Latin America Delivery Drones Market Analysis
11.1. Latin America Delivery Drones Market, by Type, 2016-2028(US$ Bn)
11.1.1. Overview
11.1.2. SRC Analysis
11.2. Latin America Delivery Drones Market, by Payload, 2016-2028(US$ Bn)
11.2.1. Overview
11.2.2. SRC Analysis
11.3. Latin America Delivery Drones Market, by Range, 2016-2028(US$ Bn)
11.3.1. Overview
11.3.2. SRC Analysis
11.4. Latin America Delivery Drones Market, by End User, 2016-2028(US$ Bn)
11.4.1. Overview
11.4.2. SRC Analysis
11.5. Latin America Delivery Drones Market, by Country, 2016-2028 (US$ Bn)
11.5.1. Brazil
11.5.1.1. Brazil Delivery Drones Market Estimates and Forecast, 2016-2028 (US$ Bn)
11.5.1.2. Brazil Delivery Drones Market, By Type, 2016-2028 (US$ Bn)
11.5.1.3. Brazil Delivery Drones Market, By Payload, 2016-2028 (US$ Bn)
11.5.1.4. Brazil Delivery Drones Market, By Range, 2016-2028 (US$ Bn)
11.5.1.5. Brazil Delivery Drones Market, By End User, 2016-2028 (US$ Bn)
11.5.2. Mexico
11.5.2.1. Mexico Delivery Drones Market Estimates and Forecast, 2016-2028 (US$ Bn)
11.5.2.2. Mexico Delivery Drones Market, By Type, 2016-2028 (US$ Bn)
11.5.2.3. Mexico Delivery Drones Market, By Payload, 2016-2028 (US$ Bn)
11.5.2.4. Mexico Delivery Drones Market, By Range, 2016-2028 (US$ Bn)
11.5.2.5. Mexico Delivery Drones Market, By End User, 2016-2028 (US$ Bn)
11.5.3. Rest of Latin America
11.5.3.1. Rest of Latin America Delivery Drones Market Estimates and Forecast, 2016-2028 (US$ Bn)
11.5.3.2. Rest of Latin America Delivery Drones Market, By Type, 2016-2028 (US$ Bn)
11.5.3.3. Rest of Latin America Delivery Drones Market, By Payload, 2016-2028 (US$ Bn)
11.5.3.4. Rest of Latin America Delivery Drones Market, By Range, 2016-2028 (US$ Bn)
11.5.3.5. Rest of Latin America Delivery Drones Market, By End User, 2016-2028 (US$ Bn)

12. Middle East and Africa Delivery Drones Market Analysis
12.1. Middle East and Africa Delivery Drones Market, by Type, 2016-2028(US$ Bn)
12.1.1. Overview
12.1.2. SRC Analysis
12.2. Middle East and Africa Delivery Drones Market, by Payload, 2016-2028(US$ Bn)
12.2.1. Overview
12.2.2. SRC Analysis
12.3. Middle East and Africa Delivery Drones Market, by Range, 2016-2028(US$ Bn)
12.3.1. Overview
12.3.2. SRC Analysis
12.4. Middle East and Africa Delivery Drones Market, by End User, 2016-2028(US$ Bn)
12.4.1. Overview
12.4.2. SRC Analysis
12.5. Middle East and Africa Delivery Drones Market, by Country, 2016-2028 (US$ Bn)
12.5.1. GCC Countries
12.5.1.1. GCC Countries Delivery Drones Market Estimates and Forecast, 2016-2028 (US$ Bn)
12.5.1.2. GCC Countries Delivery Drones Market, By Type, 2016-2028 (US$ Bn)
12.5.1.3. GCC Countries Delivery Drones Market, By Payload, 2016-2028 (US$ Bn)
12.5.1.4. GCC Countries Delivery Drones Market, By Range, 2016-2028 (US$ Bn)
12.5.1.5. GCC Countries Delivery Drones Market, By End User, 2016-2028 (US$ Bn)
12.5.2. South Africa
12.5.2.1. South Africa Delivery Drones Market Estimates and Forecast, 2016-2028 (US$ Bn)
12.5.2.2. South Africa Delivery Drones Market, By Type, 2016-2028 (US$ Bn)
12.5.2.3. South Africa Delivery Drones Market, By Payload, 2016-2028 (US$ Bn)
12.5.2.4. South Africa Delivery Drones Market, By Range, 2016-2028 (US$ Bn)
12.5.2.5. South Africa Delivery Drones Market, By End User, 2016-2028 (US$ Bn)
12.5.3. Rest of Middle East and Africa
12.5.3.1. Rest of Middle East and Africa Delivery Drones Market Estimates and Forecast, 2016-2028 (US$ Bn)
12.5.3.2. Rest of Middle East and Africa Delivery Drones Market, By Type, 2016-2028 (US$ Bn)
12.5.3.3. Rest of Middle East and Africa Delivery Drones Market, By Payload, 2016-2028 (US$ Bn)
12.5.3.4. Rest of Middle East and Africa Delivery Drones Market, By Range, 2016-2028 (US$ Bn)
12.5.3.5. Rest of Middle East and Africa Delivery Drones Market, By End User, 2016-2028 (US$ Bn)

13. Company Profiles
13.1. Airbus SE (Netherlands)
13.1.1. Company Overview
13.1.2. Products/Services Portfolio
13.1.3. Geographical Presence
13.1.4. Financial Summary
13.1.4.1. Market Revenue and Net Profit (2019-2021)
13.1.4.2. Business Segment Revenue Analysis
13.1.4.3. Geographical Revenue Analysis
13.2. Boeing Co (US)
13.3. Amazon.com Inc (US)
13.4. Wing Aviation LLC (US)
13.5. Flirtey (US)
13.6. Zipline (US)
13.7. Wingcopter GmbH (Germany)
13.8. FLI Drone (US)
13.9. Flytrex Inc (US)
13.10. Matternet Inc (US)
13.11. Deutsche Post DHL Group (Germany)
13.12. United Parcel Services (US)
13.13. Rakuten Group Inc (Japan)
13.14. SF Express Co. Ltd. (China)
13.15. Drone Delivery Canada Corp (Canada)


List of Figures

FIG. 1 Global Delivery Drones Market: Research Methodology
FIG. 2 Market Size Estimation – Top Down & Bottom up Approach
FIG. 3 Global Delivery Drones Market Segmentation
FIG. 4 Global Delivery Drones Market, by Type, 2021 (US$ Bn)
FIG. 5 Global Delivery Drones Market, by Payload, 2021 (US$ Bn)
FIG. 6 Global Delivery Drones Market, by Range, 2021 (US$ Bn)
FIG. 7 Global Delivery Drones Market, by End User, 2021 (US$ Bn)
FIG. 8 Global Delivery Drones Market, by Geography, 2021 (US$ Bn)
FIG. 9 Attractive Investment Proposition, by Type, 2021
FIG. 10 Attractive Investment Proposition, by Payload, 2021
FIG. 11 Attractive Investment Proposition, by Range, 2021
FIG. 12 Attractive Investment Proposition, by End User, 2021
FIG. 13 Attractive Investment Proposition, by Geography, 2021
FIG. 14 Global Market Share Analysis of Key Delivery Drones Market Manufacturers, 2021
FIG. 15 Global Market Positioning of Key Delivery Drones Market Manufacturers, 2021
FIG. 16 Global Delivery Drones Market Value Contribution, By Type, 2021 & 2028 (Value %)
FIG. 17 Global Delivery Drones Market, by Multi-rotor, Value, 2016-2028 (US$ Bn)
FIG. 18 Global Delivery Drones Market, by Fixed-wing, Value, 2016-2028 (US$ Bn)
FIG. 19 Global Delivery Drones Market, by Single-rotor, Value, 2016-2028 (US$ Bn)
FIG. 20 Global Delivery Drones Market, by Hybrid VTOL, Value, 2016-2028 (US$ Bn)
FIG. 21 Global Delivery Drones Market Value Contribution, By Payload, 2021 & 2028 (Value %)
FIG. 22 Global Delivery Drones Market, by Less than 2 kg, Value, 2016-2028 (US$ Bn)
FIG. 23 Global Delivery Drones Market, by 2-5 kg, Value, 2016-2028 (US$ Bn)
FIG. 24 Global Delivery Drones Market, by More than 5 kg, Value, 2016-2028 (US$ Bn)
FIG. 25 Global Delivery Drones Market Value Contribution, By Range, 2021 & 2028 (Value %)
FIG. 26 Global Delivery Drones Market, by Less than 25 km, Value, 2016-2028 (US$ Bn)
FIG. 27 Global Delivery Drones Market, by More than 25 km, Value, 2016-2028 (US$ Bn)
FIG. 28 Global Delivery Drones Market Value Contribution, By End User, 2021 & 2028 (Value %)
FIG. 29 Global Delivery Drones Market, by Healthcare, Value, 2016-2028 (US$ Bn)
FIG. 30 Global Delivery Drones Market, by Retailers & E-commerce, Value, 2016-2028 (US$ Bn)
FIG. 31 Global Delivery Drones Market, by Food & Beveragess, Value, 2016-2028 (US$ Bn)
FIG. 32 Global Delivery Drones Market, by Logistics, Value, 2016-2028 (US$ Bn)
FIG. 33 Global Delivery Drones Market, by Other End Users, Value, 2016-2028 (US$ Bn)
FIG. 34 U.S. Delivery Drones Market, 2016-2028 (US$ Bn)
FIG. 35 Canada Delivery Drones Market, 2016-2028 (US$ Bn)
FIG. 36 Germany Delivery Drones Market, 2016-2028 (US$ Bn)
FIG. 37 France Delivery Drones Market, 2016-2028 (US$ Bn)
FIG. 38 U.K. Delivery Drones Market, 2016-2028 (US$ Bn)
FIG. 39 Italy Delivery Drones Market, 2016-2028 (US$ Bn)
FIG. 40 Spain Delivery Drones Market, 2016-2028 (US$ Bn)
FIG. 41 Rest of Europe Delivery Drones Market, 2016-2028 (US$ Bn)
FIG. 42 China Delivery Drones Market, 2016-2028 (US$ Bn)
FIG. 43 Japan Delivery Drones Market, 2016-2028 (US$ Bn)
FIG. 44 India Delivery Drones Market, 2016-2028 (US$ Bn)
FIG. 45 South Korea Delivery Drones Market, 2016-2028 (US$ Bn)
FIG. 46 Southeast Asia Delivery Drones Market, 2016-2028 (US$ Bn)
FIG. 47 Rest of Asia Pacific Delivery Drones Market, 2016-2028 (US$ Bn)
FIG. 48 Latin America Delivery Drones Market, 2016-2028 (US$ Bn)
FIG. 49 Brazil Delivery Drones Market, 2016-2028 (US$ Bn)
FIG. 50 Mexico Delivery Drones Market, 2016-2028 (US$ Bn)
FIG. 51 Rest of Latin America Delivery Drones Market, 2016-2028 (US$ Bn)
FIG. 52 Middle East & Africa Delivery Drones Market, 2016-2028 (US$ Bn)
FIG. 53 GCC Countries Delivery Drones Market, 2016-2028 (US$ Bn)
FIG. 54 South Africa Delivery Drones Market, 2016-2028 (US$ Bn)
FIG. 55 Rest of Middle East and Africa Delivery Drones Market, 2016-2028 (US$ Bn)

List of Tables

TABLE 1 Market Snapshot: Global Delivery Drones Market
TABLE 2 Global Delivery Drones Market, by Competitive Benchmarking, 2021
TABLE 3 Global Delivery Drones Market, by Geographical Presence Analysis, 2021
TABLE 4 Global Delivery Drones Market, by Key Strategies Analysis, 2021
TABLE 5 Global Delivery Drones Market, by Type, 2016-2028 (US$ Bn)
TABLE 6 Global Delivery Drones Market, by Payload, 2016-2028 (US$ Bn)
TABLE 7 Global Delivery Drones Market, by Range, 2016-2028 (US$ Bn)
TABLE 8 Global Delivery Drones Market, by End User, 2016-2028 (US$ Bn)
TABLE 9 Global Delivery Drones Market, by Geography, 2016-2028 (US$ Bn)
TABLE 10 North America Delivery Drones Market, by Type, 2016-2028 (US$ Bn)
TABLE 11 North America Delivery Drones Market, by Payload, 2016-2028 (US$ Bn)
TABLE 12 North America Delivery Drones Market, by Range, 2016-2028 (US$ Bn)
TABLE 13 North America Delivery Drones Market, by End User, 2016-2028 (US$ Bn)
TABLE 14 North America Delivery Drones Market, by Country, 2016-2028 (US$ Bn)
TABLE 15 US Delivery Drones Market, by Type, 2016-2028 (US$ Bn)
TABLE 16 US Delivery Drones Market, by Payload, 2016-2028 (US$ Bn)
TABLE 17 US Delivery Drones Market, by Range, 2016-2028 (US$ Bn)
TABLE 18 US Delivery Drones Market, by End User, 2016-2028 (US$ Bn)
TABLE 19 Canada Delivery Drones Market, by Type, 2016-2028 (US$ Bn)
TABLE 20 Canada Delivery Drones Market, by Payload, 2016-2028 (US$ Bn)
TABLE 21 Canada Delivery Drones Market, by Range, 2016-2028 (US$ Bn)
TABLE 22 Canada Delivery Drones Market, by End User, 2016-2028 (US$ Bn)
TABLE 23 Europe Delivery Drones Market, by Type, 2016-2028 (US$ Bn)
TABLE 24 Europe Delivery Drones Market, by Payload, 2016-2028 (US$ Bn)
TABLE 25 Europe Delivery Drones Market, by Range, 2016-2028 (US$ Bn)
TABLE 26 Europe Delivery Drones Market, by End User, 2016-2028 (US$ Bn)
TABLE 27 Europe Delivery Drones Market, by Country, 2016-2028 (US$ Bn)
TABLE 28 Germany Delivery Drones Market, by Type, 2016-2028 (US$ Bn)
TABLE 29 Germany Delivery Drones Market, by Payload, 2016-2028 (US$ Bn)
TABLE 30 Germany Delivery Drones Market, by Range, 2016-2028 (US$ Bn)
TABLE 31 Germany Delivery Drones Market, by End User, 2016-2028 (US$ Bn)
TABLE 32 France Delivery Drones Market, by Type, 2016-2028 (US$ Bn)
TABLE 33 France Delivery Drones Market, by Payload, 2016-2028 (US$ Bn)
TABLE 34 France Delivery Drones Market, by Range, 2016-2028 (US$ Bn)
TABLE 35 France Delivery Drones Market, by End User, 2016-2028 (US$ Bn)
TABLE 36 UK Delivery Drones Market, by Type, 2016-2028 (US$ Bn)
TABLE 37 UK Delivery Drones Market, by Payload, 2016-2028 (US$ Bn)
TABLE 38 UK Delivery Drones Market, by Range, 2016-2028 (US$ Bn)
TABLE 39 UK Delivery Drones Market, by End User, 2016-2028 (US$ Bn)
TABLE 40 Italy Delivery Drones Market, by Type, 2016-2028 (US$ Bn)
TABLE 41 Italy Delivery Drones Market, by Payload, 2016-2028 (US$ Bn)
TABLE 42 Italy Delivery Drones Market, by Range, 2016-2028 (US$ Bn)
TABLE 43 Italy Delivery Drones Market, by End User, 2016-2028 (US$ Bn)
TABLE 44 Spain Delivery Drones Market, by Type, 2016-2028 (US$ Bn)
TABLE 45 Spain Delivery Drones Market, by Payload, 2016-2028 (US$ Bn)
TABLE 46 Spain Delivery Drones Market, by Range, 2016-2028 (US$ Bn)
TABLE 47 Spain Delivery Drones Market, by End User, 2016-2028 (US$ Bn)
TABLE 48 Rest of Europe Delivery Drones Market, by Type, 2016-2028 (US$ Bn)
TABLE 49 Rest of Europe Delivery Drones Market, by Payload, 2016-2028 (US$ Bn)
TABLE 50 Rest of Europe Delivery Drones Market, by Range, 2016-2028 (US$ Bn)
TABLE 51 Rest of Europe Delivery Drones Market, by End User, 2016-2028 (US$ Bn)
TABLE 52 Asia Pacific Delivery Drones Market, by Type, 2016-2028 (US$ Bn)
TABLE 53 Asia Pacific Delivery Drones Market, by Payload, 2016-2028 (US$ Bn)
TABLE 54 Asia Pacific Delivery Drones Market, by Range, 2016-2028 (US$ Bn)
TABLE 55 Asia Pacific Delivery Drones Market, by End User, 2016-2028 (US$ Bn)
TABLE 56 Asia Pacific Delivery Drones Market, by Country, 2016-2028 (US$ Bn)
TABLE 57 China Delivery Drones Market, by Type, 2016-2028 (US$ Bn)
TABLE 58 China Delivery Drones Market, by Payload, 2016-2028 (US$ Bn)
TABLE 59 China Delivery Drones Market, by Range, 2016-2028 (US$ Bn)
TABLE 60 China Delivery Drones Market, by End User, 2016-2028 (US$ Bn)
TABLE 61 Japan Delivery Drones Market, by Type, 2016-2028 (US$ Bn)
TABLE 62 Japan Delivery Drones Market, by Payload, 2016-2028 (US$ Bn)
TABLE 63 Japan Delivery Drones Market, by Range, 2016-2028 (US$ Bn)
TABLE 64 Japan Delivery Drones Market, by End User, 2016-2028 (US$ Bn)
TABLE 65 India Delivery Drones Market, by Type, 2016-2028 (US$ Bn)
TABLE 66 India Delivery Drones Market, by Payload, 2016-2028 (US$ Bn)
TABLE 67 India Delivery Drones Market, by Range, 2016-2028 (US$ Bn)
TABLE 68 India Delivery Drones Market, by End User, 2016-2028 (US$ Bn)
TABLE 69 South Korea Delivery Drones Market, by Type, 2016-2028 (US$ Bn)
TABLE 70 South Korea Delivery Drones Market, by Payload, 2016-2028 (US$ Bn)
TABLE 71 South Korea Delivery Drones Market, by Range, 2016-2028 (US$ Bn)
TABLE 72 South Korea Delivery Drones Market, by End User, 2016-2028 (US$ Bn)
TABLE 73 South East Asia Delivery Drones Market, by Type, 2016-2028 (US$ Bn)
TABLE 74 South East Asia Delivery Drones Market, by Payload, 2016-2028 (US$ Bn)
TABLE 75 South East Asia Delivery Drones Market, by Range, 2016-2028 (US$ Bn)
TABLE 76 South East Asia Delivery Drones Market, by End User, 2016-2028 (US$ Bn)
TABLE 77 Rest of Asia Pacific Delivery Drones Market, by Type, 2016-2028 (US$ Bn)
TABLE 78 Rest of Asia Pacific Delivery Drones Market, by Payload, 2016-2028 (US$ Bn)
TABLE 79 Rest of Asia Pacific Delivery Drones Market, by Range, 2016-2028 (US$ Bn)
TABLE 80 Rest of Asia Pacific Delivery Drones Market, by End User, 2016-2028 (US$ Bn)
TABLE 81 Latin America Delivery Drones Market, by Type, 2016-2028 (US$ Bn)
TABLE 82 Latin America Delivery Drones Market, by Payload, 2016-2028 (US$ Bn)
TABLE 83 Latin America Delivery Drones Market, by Range, 2016-2028 (US$ Bn)
TABLE 84 Latin America Delivery Drones Market, by End User, 2016-2028 (US$ Bn)
TABLE 85 Latin America Delivery Drones Market, by Country, 2016-2028 (US$ Bn)
TABLE 86 Brazil Delivery Drones Market, by Type, 2016-2028 (US$ Bn)
TABLE 87 Brazil Delivery Drones Market, by Payload, 2016-2028 (US$ Bn)
TABLE 88 Brazil Delivery Drones Market, by Range, 2016-2028 (US$ Bn)
TABLE 89 Brazil Delivery Drones Market, by End User, 2016-2028 (US$ Bn)
TABLE 90 Mexico Delivery Drones Market, by Type, 2016-2028 (US$ Bn)
TABLE 91 Mexico Delivery Drones Market, by Payload, 2016-2028 (US$ Bn)
TABLE 92 Mexico Delivery Drones Market, by Range, 2016-2028 (US$ Bn)
TABLE 93 Mexico Delivery Drones Market, by End User, 2016-2028 (US$ Bn)
TABLE 94 Rest of Latin America Delivery Drones Market, by Type, 2016-2028 (US$ Bn)
TABLE 95 Rest of Latin America Delivery Drones Market, by Payload, 2016-2028 (US$ Bn)
TABLE 96 Rest of Latin America Delivery Drones Market, by Range, 2016-2028 (US$ Bn)
TABLE 97 Rest of Latin America Delivery Drones Market, by End User, 2016-2028 (US$ Bn)
TABLE 98 Middle East and Africa Delivery Drones Market, by Type, 2016-2028 (US$ Bn)
TABLE 99 Middle East and Africa Delivery Drones Market, by Payload, 2016-2028 (US$ Bn)
TABLE 100 Middle East and Africa Delivery Drones Market, by Range, 2016-2028 (US$ Bn)
TABLE 101 Middle East and Africa Delivery Drones Market, by End User, 2016-2028 (US$ Bn)
TABLE 102 Middle East and Africa Delivery Drones Market, by Country, 2016-2028 (US$ Bn)
TABLE 103 GCC Countries Delivery Drones Market, by Type, 2016-2028 (US$ Bn)
TABLE 104 GCC Countries Delivery Drones Market, by Payload, 2016-2028 (US$ Bn)
TABLE 105 GCC Countries Delivery Drones Market, by Range, 2016-2028 (US$ Bn)
TABLE 106 GCC Countries Delivery Drones Market, by End User, 2016-2028 (US$ Bn)
TABLE 107 South Africa Delivery Drones Market, by Type, 2016-2028 (US$ Bn)
TABLE 108 South Africa Delivery Drones Market, by Payload, 2016-2028 (US$ Bn)
TABLE 109 South Africa Delivery Drones Market, by Range, 2016-2028 (US$ Bn)
TABLE 110 South Africa Delivery Drones Market, by End User, 2016-2028 (US$ Bn)
TABLE 111 Rest of Middle East and Africa Delivery Drones Market, by Type, 2016-2028 (US$ Bn)
TABLE 112 Rest of Middle East and Africa Delivery Drones Market, by Payload, 2016-2028 (US$ Bn)
TABLE 113 Rest of Middle East and Africa Delivery Drones Market, by Range, 2016-2028 (US$ Bn)
TABLE 114 Rest of Middle East and Africa Delivery Drones Market, by End User, 2016-2028 (US$ Bn)

Ready to Transform Data into Decisions?

Request Your Sample Report and Start Your Journey of Informed Choices


Providing the strategic compass for industry titans.

cr-clients-logos
Request Free Sample

Frequently Asked Questions:

How has COVID-19 impacted the global delivery drone market?

The delivery drones market moderately suffered from the COVID-19 pandemic, which resulted in a decline of over 2.2% in revenue generated in 2020.

Which is the leading market for delivery drones?

North America accounted for the highest share in the global delivery drones market regarding value and volume.

What are the key drivers for the growth of the delivery drone market?

Increasing private investment in drones, increased e-commerce sales, and post-pandemic demand for contactless delivery are some factors driving the market’s expansion.

Which is the major segment in the delivery drone market by type?

Hybrid VTOL had a major share in 2021, with more than 55% of the market revenue share. Besides, the multi-rotor type is projected to witness the fastest growth.

Which is the major market segment by the end user in the delivery drones market?

The logistics industry had a major share in the global market in 2021 and is projected to continue its dominance over the forecast period.

About Author

Sushant Phapale

Sushant Phapale

ICT & Automation Expert

Sushant is an expert in ICT, automation, and electronics with a passion for innovation and market trends.

View Profile

Express Delivery Market

The express delivery market size was valued at USD 367958.8 million in 2024 and is anticipated to reach USD 649924.4 million by 2032, at a CAGR of  7.37 % during the forecast period (2024-2032).

Automated Insulin Delivery System Market

The Automated Insulin Delivery System Market size was valued at USD 2,685.93 million in 2018 to USD 4,403.17 million in 2024 and is anticipated to reach USD 8,728.27 million by 2032, at a CAGR of 8.32 % during the forecast period.

Ocular Drug Delivery Technologies Market

The Ocular Drug Delivery Technologies market size was valued at USD 10,506.93 million in 2018, increased to USD 15,121.67 million in 2024, and is anticipated to reach USD 25,989.57 million by 2032, growing at a CAGR of 7.07% during the forecast period.

Automated Parcel Delivery Terminals Market

The Automated Parcel Delivery Terminals market size was valued at USD 624.50 million in 2018, increased to USD 925.46 million in 2024, and is anticipated to reach USD 2,204.76 million by 2032, at a CAGR of 11.51% during the forecast period.

Pulmonary Drug Delivery Devices Market

The Pulmonary Drug Delivery Devices Market size was valued at USD 43,091.3 million in 2018 to USD 54,865.9 million in 2024 and is anticipated to reach USD 77,432.5 million by 2032, at a CAGR of 4.43% during the forecast period.

Vaccine Delivery Devices Market

The Global Vaccine Delivery Devices Market is projected to grow from USD7,384.9 million in 2024 to an estimated USD 13,470.4 million by 2032, with a compound annual growth rate (CAGR) of 7.83% from 2025 to 2032.

Dental Delivery System Market

Dental Delivery System Market size was valued at USD 11950 million in 2024 and is anticipated to reach USD 19248.6 million by 2032, at a CAGR of 6.14% during the forecast period (2024-2032).

Online Food Delivery Services Market

The Online Food Delivery Services market size was valued at USD 294,500.00 million in 2018, reached USD 383,671.74 million in 2024, and is anticipated to reach USD 756,208.31 million by 2032, growing at a CAGR of 8.89% during the forecast period.

Online Flower Delivery Service Market

The Online Flower Delivery Service Market is projected to grow from USD 6,550 million in 2024 to USD 11,339 million by 2032, registering a compound annual growth rate (CAGR) of 7.1%.

Corporate Performance Management Market

The Corporate Performance Management Market size was valued at USD 9529.7 million in 2024 and is anticipated to reach USD 25514.1 million by 2032, at a CAGR of 13.1% during the forecast period (2024-2032).

End User Experience Monitoring Market

The End User Experience Monitoring (EUEM) Market size was valued at USD 3890.5 million in 2024 and is anticipated to reach USD 12321.4 million by 2032, growing at a CAGR of 15.5% during the forecast period.

Composite AI Market

The Global Composite AI Market size was valued at USD 1,847.20 million in 2018 to USD 11,791.70 million in 2024 and is anticipated to reach USD 1,39,634.72 million by 2032, at a CAGR of 36.20% during the forecast period.

Cloud Social Media Management Market

The Global Cloud Social Media Management Market size was valued at USD 4,335.18 million in 2018 to USD 8,453.98 million in 2024 and is anticipated to reach USD 23,463.33 million by 2032, at a CAGR of 12.68% during the forecast period.

Canada Telecommunication Services Market

The Canada Telecommunication Services Market size was valued at USD 42,325.05 million in 2018 to USD 52,251.2 million in 2024 and is anticipated to reach USD 73,791.98 million by 2032, at a CAGR of 4.41% during the forecast period.

Connected Baby Monitor Market

The Global Connected Baby Monitor Market size was valued at USD 800.28 million in 2018 to USD 1,370.37 million in 2024 and is anticipated to reach USD 2,910.31 million by 2032, at a CAGR of 9.20% during the forecast period.

Enterprise Wireless Local Area Network (WLAN) Market

The Enterprise Wireless Local Area Network (WLAN) market was valued at USD 8,060.4 million in 2024. It is projected to grow to USD 21,428.1 million by 2032, reflecting a compound annual growth rate (CAGR) of 13% over the forecast period.

Travel Technology Solutions Market

The Travel Technology Solutions Market size was valued at USD 9308 million in 2024 and is anticipated to reach USD 19664.1 million by 2032, at a CAGR of 9.8% during the forecast period (2024-2032).

Explosive Detectors Market

The Explosive Detectors Market size was valued at USD 11214.2 million in 2024 and is anticipated to reach USD 27765.9 million by 2032, at a CAGR of 12% during the forecast period (2024-2032).

Live Streaming Market

The live streaming market size was valued at USD 79554.6 million in 2024 and is anticipated to reach USD 214504.7 million by 2032, at a CAGR of 13.2 % during the forecast period (2024-2032).

Distributed Antenna Systems Market

Distributed Antenna Systems (DAS) Market size was valued at USD 2809 million in 2024 and is anticipated to reach USD 5597.1 million by 2032, at a CAGR of 9% during the forecast period.

Image Processing Systems Market

The Image Processing Systems Market size was valued at USD 13646 million in 2024 and is anticipated to reach USD 26208.6 million by 2032, at a CAGR of 8.5% during the forecast period (2024-2032).

Purchase Options

The report comes as a view-only PDF document, optimized for individual clients. This version is recommended for personal digital use and does not allow printing.
$4699

To meet the needs of modern corporate teams, our report comes in two formats: a printable PDF and a data-rich Excel sheet. This package is optimized for internal analysis and multi-location access, making it an excellent choice for organizations with distributed workforce.
$5699

The report will be delivered in printable PDF format along with the report’s data Excel sheet. This license offers 100 Free Analyst hours where the client can utilize Credence Research Inc.’s research team. It is highly recommended for organizations seeking to execute short, customized research projects related to the scope of the purchased report.
$12699

Credence Staff 3

WILLIAM, North America

Support Staff at Credence Research

KEITH PHILLIPS, Europe

Lee - CR Sales Staff

LEE VALLANCE, Asia Pacific

Kieran Jameson

KIERAN JAMESON, Australia

Report delivery within 24 to 48 hours

User Review

Thank you for the data! The numbers are exactly what we asked for and what we need to build our business case.

Materials Scientist
(privacy requested)

User Review

The report was an excellent overview of the Industrial Burners market. This report does a great job of breaking everything down into manageable chunks.

Imre Hof
Management Assistant, Bekaert

cr-clients-logos