
| REPORT ATTRIBUTE | DETAILS |
|---|---|
| Historical Period | 2020-2023 |
| Base Year | 2024 |
| Forecast Period | 2025-2032 |
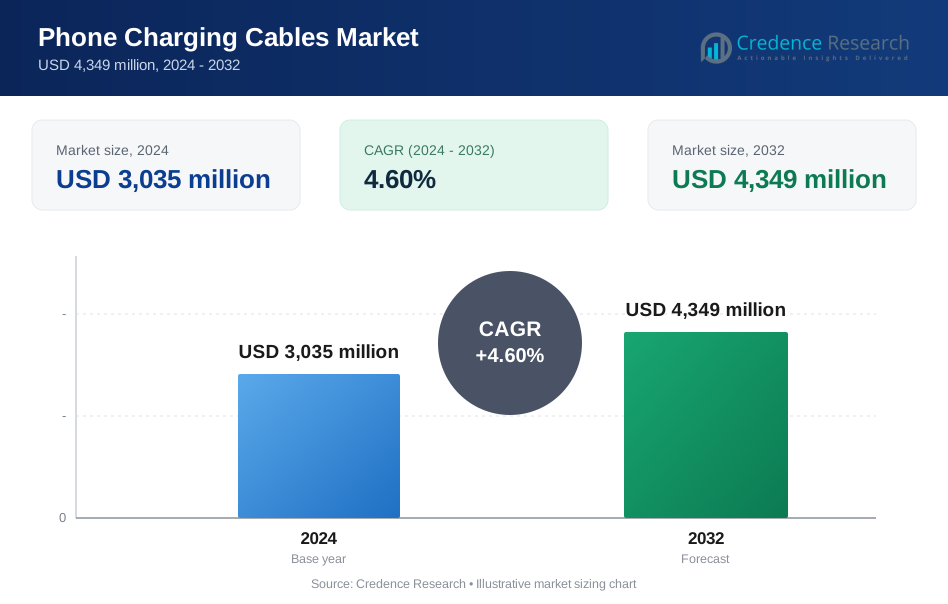
| Phone Charging Cables Market Size 2024 | USD 3035 Million |
| Phone Charging Cables Market, CAGR | 4.6% |
| Phone Charging Cables Market Size 2032 | USD 4349 Million |
Market Overview:
Phone Charging Cables Market size was valued at USD 3035 million in 2024 and is anticipated to reach USD 4349 million by 2032, at a CAGR of 4.6% during the forecast period (2024-2032).
Several factors are driving the expansion of the phone charging cables market. The transition to USB Type-C connectors, known for faster charging and data transfer speeds, is accelerating cable replacements across user segments. Consumers increasingly seek tangle-free, braided, and longer-length cables for convenience and durability. Additionally, the rise of gaming smartphones and high-powered devices has heightened demand for cables with improved thermal resistance and stable current delivery. E-commerce platforms and retail chains are witnessing a surge in cable sales, especially due to bundled accessories and value-added offerings from manufacturers. Moreover, the ongoing innovation in fast-charging technologies by major smartphone brands compels third-party manufacturers to continually upgrade cable specifications to ensure compatibility and safety. The growing trend of wireless charging has not significantly diminished cable demand, as consumers still rely on fast and reliable wired charging for rapid power top-ups. Furthermore, corporate and institutional bulk procurement for employee devices is contributing to steady market growth.
Regionally, Asia-Pacific dominates the global phone charging cables market due to its vast smartphone user base, growing urbanization, and cost-effective manufacturing capabilities in countries such as China, India, and Vietnam. The availability of affordable charging solutions and increasing penetration of mobile accessories brands further boost regional sales. Governments in emerging economies are also promoting local electronics manufacturing, which supports the domestic production of charging cables. North America follows, fueled by the presence of leading electronic accessory brands and high consumer spending on mobile technology. Meanwhile, Europe demonstrates steady growth, supported by rising environmental awareness and regulatory standards promoting sustainable and recyclable cable materials. The push for a universal charging standard across European countries is also driving innovation and encouraging the adoption of eco-friendly designs.
Market Insights:
- The Phone Charging Cables Market is projected to grow from USD 3,035 million to USD 4,349 million by 2032, registering a CAGR of 4.6% during the forecast period due to rising global smartphone usage and evolving charging standards.
- The growing adoption of USB Type-C and fast-charging technologies is prompting consumers to upgrade their cables, driving demand for enhanced performance, speed, and cross-device compatibility.
- The rapid expansion of e-commerce platforms is enabling broader market access, allowing consumers to compare, review, and purchase charging cables with ease from remote and urban locations alike.
- Increasing consumer awareness around quality and safety is shaping purchase behavior, with preferences shifting toward certified cables that offer durability, insulation, and overcharge protection.
- The market is challenged by intense price competition and widespread counterfeit products, which undermine brand credibility and force manufacturers to justify premium pricing through innovation and quality assurance.
- Asia-Pacific holds the largest share of the global market, supported by a vast and growing smartphone population, cost-effective manufacturing, and strong online retail networks across key countries like China and India.
- Europe maintains stable growth, driven by device replacement cycles and stringent environmental regulations that encourage the development and adoption of sustainable, high-quality charging cables.
Market Drivers:
Growing Smartphone Penetration Fuels Demand for Phone Charging Cables
The rapid increase in global smartphone adoption significantly drives the Phone Charging CablesMarket. Consumers rely on their devices for communication, entertainment, and business, which elevates the need for reliable charging solutions. It responds to this demand by offering a wide range of cable types compatible with various devices. The market benefits from frequent device upgrades, prompting users to purchase new or replacement cables. It also experiences growth from the proliferation of secondary devices such as tablets and wireless earbuds, which require specialized charging cables. This trend ensures a consistent demand base for manufacturers and retailers.
Advancements in Charging Technology Stimulate Market Growth
Technological innovation in charging standards, such as fast charging and USB Type-C, propels the Phone Charging CablesMarket forward. It adapts quickly to evolving consumer expectations for faster and more efficient charging. Manufacturers invest in research and development to produce cables that support higher power delivery and data transfer rates. The shift toward universal connectors, including USB-C, encourages consumers to upgrade their cables for compatibility. It maintains market momentum by aligning product offerings with the latest device specifications. This focus on innovation ensures that the market remains dynamic and competitive.
- For instance, StarTech.com offers a USB-C fast charging cable (model USB2C5C1M) that is USB-IF certified and delivers up to 100W (5A) of power output, enabling rapid charging for laptops and mobile devices.
Expansion of E-Commerce Channels Broadens Market Accessibility
The rise of online retail platforms has transformed the distribution landscape for the Phone Charging CablesMarket. It leverages e-commerce to reach a broader audience, including remote and underserved regions. Consumers benefit from the convenience of comparing products, prices, and reviews before making a purchase. The market capitalizes on digital marketing strategies to drive awareness and sales. E-commerce platforms facilitate direct-to-consumer sales, reducing reliance on traditional retail channels. This shift enhances market penetration and supports sustained growth.
- For instance, U.S. retail e-commerce sales for the third quarter of 2023 totaled $271.7 billion, reflecting the substantial role of digital platforms in product distribution.
Increasing Consumer Awareness of Quality and Safety Standards
Growing awareness of product quality and safety standards influences purchasing decisions in the Phone Charging CablesMarket. It addresses consumer concerns by offering certified and durable cables that comply with international regulations. Manufacturers highlight features such as reinforced insulation, overcharge protection, and warranty coverage to build trust. The market responds to incidents of device damage caused by substandard cables by promoting reliable alternatives. It benefits from partnerships with device manufacturers to offer bundled, certified accessories. This focus on quality assurance strengthens brand reputation and drives repeat purchases.
Market Trends:
Shift Toward Universal and Multi-Functional Charging Solutions
The Phone Charging CablesMarket witnesses a clear trend toward universal and multi-functional charging solutions. It responds to consumer demand for convenience by offering cables compatible with multiple device types and brands. The adoption of USB Type-C and other universal connectors accelerates this trend, reducing the need for multiple cables. Consumers seek products that can charge smartphones, tablets, and other devices, driving manufacturers to innovate in cable design and functionality. It supports the integration of features such as fast charging, data transfer, and durability within a single product. This movement toward versatility shapes product development strategies and strengthens the market’s appeal to a broad customer base.
- For instance, The Verbatim Sync & Charge USB-C to USB-C Cable delivers 100W charging, 480 Mbps data transfer, and withstands 50,000 bends.
Emphasis on Sustainability and Eco-Friendly Materials in Product Development
Growing environmental awareness shapes purchasing decisions in the Phone Charging CablesMarket. It prioritizes the use of recyclable materials and eco-friendly packaging to meet evolving consumer preferences. Manufacturers introduce cables made from biodegradable or recycled components, aligning with global sustainability goals. The market also sees increased transparency regarding material sourcing and production processes. It leverages these sustainable practices to differentiate products and build brand loyalty. This focus on environmental responsibility not only addresses regulatory requirements but also enhances the overall value proposition for environmentally conscious consumers.
- For instance, The Anker 543 USB-C to USB-C cable is made with 40% plant-based materials and withstands 20,000 bends.
Market Challenges Analysis:
Intense Price Competition and Proliferation of Counterfeit Products
The Phone Charging CablesMarket faces significant challenges from intense price competition and the widespread availability of counterfeit products. It must contend with low-cost, unbranded cables that flood both online and offline channels, making market differentiation difficult. Consumers often prioritize price over quality, which undermines the value of certified and premium products. The presence of counterfeit cables raises concerns about device safety and performance, eroding consumer trust. It places pressure on established brands to justify higher prices through innovation and quality assurance. This environment complicates efforts to maintain profitability and brand reputation.
- For example, Anker’s PowerLine III Flow cable uses a proprietary silica gel finish and is laboratory-tested to withstand over 25,000 bends, significantly outlasting typical unbranded alternatives, according to Anker’s official product specifications.
Rapid Technological Changes and Compatibility Issues
Frequent advancements in device technology create ongoing compatibility challenges for the Phone Charging CablesMarket. It must continuously adapt to new charging standards and connector types introduced by device manufacturers. The transition to wireless charging and proprietary connectors further complicates product development and inventory management. Manufacturers risk inventory obsolescence when older cable types lose relevance. It requires significant investment in research and agile supply chains to stay aligned with evolving industry standards. These factors collectively increase operational complexity and market uncertainty.
Market Opportunities:
Expansion into Emerging Markets and Untapped Consumer Segments
The Phone Charging CablesMarket holds significant growth potential in emerging markets and untapped consumer segments. It can leverage rising smartphone adoption in regions such as Asia-Pacific, Africa, and Latin America to expand its customer base. Urbanization and increasing disposable incomes in these areas drive higher demand for mobile accessories. The market benefits from targeting younger demographics and first-time smartphone users who require reliable charging solutions. It can establish partnerships with local distributors and e-commerce platforms to strengthen market presence. Tailoring products to regional preferences and price points enhances competitiveness and market penetration.
Innovation in Smart and Sustainable Charging Solutions
Technological innovation presents new opportunities for the Phone Charging CablesMarket to differentiate its offerings. It can introduce smart cables with features such as integrated charging indicators, data protection, and enhanced durability. The market can capitalize on consumer interest in environmentally friendly products by developing cables made from recycled or biodegradable materials. It benefits from aligning with global sustainability initiatives and regulatory trends. Collaborations with device manufacturers for co-branded or bundled solutions increase product visibility and consumer trust. These strategies position the market to capture evolving consumer preferences and drive long-term growth.
Market Segmentation Analysis:
By Type
The Phone Charging Cables Market is segmented into USB Type-A, USB Type-B, and USB Type-C. USB Type-C leads this category due to its reversible design, faster charging capabilities, and broad compatibility with newer devices. It supports high-speed data transfer and efficient power delivery, making it the preferred choice for consumers. USB Type-A and USB Type-B continue to serve older devices but are gradually being phased out as demand for advanced connectors grows.
- For instance, in September 2023, Infineon Technologies launched an Electronically-Marked Cable Assembly (EMCA) controller supporting Extended Power Range (EPR) up to 54V for passive USB-C cables, ensuring seamless compatibility and enhanced safety for a wide range of devices.
By Technology
This market segment includes standard charging cables and fast charging cables. Fast charging cables dominate due to increasing demand for shorter charging times and better energy efficiency. Manufacturers prioritize delivering cables that can handle higher power levels and ensure voltage stability. Standard charging cables maintain relevance in cost-sensitive markets and are commonly included with low-end or legacy devices.
- For example, Anker Innovations introduced Bio-based USB-C Charging Cables in 2022, which not only support fast charging but also utilize sustainable, plant-based materials, offering up to 100W power delivery and compatibility with the latest USB-C devices.
By Functionality
The market categorizes functionality into charging-only cables and charging plus data transfer cables. Charging plus data transfer cables command a larger market share due to their dual-purpose utility in both personal and business settings. Users prefer cables that enable charging and seamless data transfer across devices. It continues to benefit from this preference for versatile and efficient accessories. Charging-only cables fulfill niche roles such as powering car devices and standalone chargers but offer limited long-term growth.
Segmentations:
By Type
- USB Type-A
- USB Type-B
- USB Type-C
- Lightning Cable
- Micro-USB
By Technology
- Standard Charging
- Fast Charging
- Wireless Charging Support
By Functionality
- Charging Only
- Charging and Data Transfer
- OTG (On-The-Go) Support
By Material
- Plastic
- Nylon Braided
- TPE (Thermoplastic Elastomer)
- PVC
- Kevlar Reinforced
By Application
- Smartphones
- Tablets
- Wearables
- Power Banks
- Gaming Consoles
- Automotive Devices
By End-User
- Personal
- Commercial
- Industrial
- Institutional
By Region
- North America
- U.S.
- Canada
- Mexico
- Europe
- Germany
- France
- U.K.
- Italy
- Spain
- Rest of Europe
- Asia Pacific
- China
- Japan
- India
- South Korea
- South-east Asia
- Rest of Asia Pacific
- Latin America
- Brazil
- Argentina
- Rest of Latin America
- Middle East & Africa
- GCC Countries
- South Africa
- Rest of the Middle East and Africa
Regional Analysis:
Strong Demand and Technological Adoption in North America
North America accounts for 27% of the global Phone Charging CablesMarket. The region benefits from high smartphone penetration, frequent device upgrades, and a strong culture of technology adoption. The market responds to consumer expectations for fast charging and advanced connectivity by offering premium, certified cables. Retail and e-commerce channels remain robust, supporting widespread product availability. It faces competition from both established brands and low-cost imports, prompting a focus on quality and innovation. Regulatory standards for electronic accessories in the region encourage manufacturers to prioritize safety and compliance. These factors sustain steady growth and reinforce North America’s position as a key market.
Rapid Growth and Expanding Consumer Base in Asia-Pacific
Asia-Pacific holds 41% of the global Phone Charging CablesMarket. It leverages a large and growing population, rapid urbanization, and increasing smartphone adoption. Local manufacturers play a pivotal role by offering affordable and diverse product options tailored to regional preferences. The market benefits from the proliferation of e-commerce platforms, which facilitate access to both urban and rural consumers. It must address challenges related to price sensitivity and counterfeit products, which are prevalent in the region. Strategic partnerships with mobile device manufacturers and retailers enhance distribution networks. These dynamics position Asia-Pacific as a primary engine of market growth.
Steady Replacement Demand and Regulatory Focus in Europe
Europe represents 19% of the global Phone Charging CablesMarket. The region experiences consistent demand driven by device replacement cycles and a strong emphasis on product quality. Consumers in the region value certified and eco-friendly cables, encouraging manufacturers to adopt sustainable practices. The market aligns with evolving regulatory requirements, including directives on electronic waste and product safety. It benefits from high levels of digital literacy and a well-developed retail infrastructure. Competitive differentiation centers on innovation, durability, and compliance with European standards. This environment supports long-term stability and incremental growth across the region.
Key Player Analysis:
- Huawei Technologies Co., Ltd.
- Nomad Goods, Inc.
- Native Union
- Chicken Ecommerce Software
- Pisen
- America Ugreen Limited
- Anker Innovations
- Apple Inc.
- Griffin Technology Group
Competitive Analysis:
The Phone Charging Cables Market features strong competition among global and regional players offering a wide range of cable types and functionalities. Key companies focus on product durability, fast charging capability, and multi-device compatibility to capture consumer attention. It remains dynamic, with frequent product updates and innovation driven by evolving smartphone technologies. Leading brands invest in quality certifications and strategic retail partnerships to strengthen market presence. Low-cost manufacturers compete on pricing, creating challenges for premium brands to maintain differentiation. E-commerce platforms play a crucial role in expanding reach and enhancing visibility for both established and emerging players. Companies are also developing eco-friendly and recyclable cable solutions to align with environmental standards. The market encourages continuous improvement in material quality, safety features, and design innovation. It supports both mass-market and niche demand segments, making brand positioning and after-sales service key elements in sustaining long-term competitiveness.
Recent Developments:
- In June 2025, Anker launched the Anker Prime TB5 Docking Station (14-in-1, 8K, Thunderbolt 5) and a Thunderbolt 5 Cable, expanding its portfolio of high-speed connectivity solutions.
- In February 2025, Anker SOLIX (Anker’s solar/storage division) announced new strategic cooperation agreements with multiple industry-leading companies at the RE+ 2024 Renewable Energy Conference in California, aimed at advancing solar storage innovation in the U.S.
- In February 2025, Apple announced a commitment to spend over $500 billion in the U.S. over the next four years, including new manufacturing facilities, expansion of its Advanced Manufacturing Fund, and collaborations such as with UCLA's Center for Education of Microchip Designers.
Market Concentration & Characteristics:
The Phone Charging Cables Market displays moderate market concentration, with a mix of global brands and regional manufacturers competing across pricing tiers. It features a broad product range that caters to diverse consumer needs, from basic charging to high-speed data transfer. The market favors brands that offer certified, durable, and multi-functional cables compatible with evolving devices. It is characterized by high product turnover, short replacement cycles, and continuous innovation driven by advancements in mobile technology. Brand loyalty depends on product quality, safety, and customer service. The market supports both bulk distribution for commercial use and retail sales for individual consumers. Rapid technological shifts and price-sensitive buyers create a highly competitive and fast-moving environment.
Report Coverage:
The research report offers an in-depth analysis based on Type, Technology, Functionality, Material, Application, End-User and Region. It details leading market players, providing an overview of their business, product offerings, investments, revenue streams, and key applications. Additionally, the report includes insights into the competitive environment, SWOT analysis, current market trends, as well as the primary drivers and constraints. Furthermore, it discusses various factors that have driven market expansion in recent years. The report also explores market dynamics, regulatory scenarios, and technological advancements that are shaping the industry. It assesses the impact of external factors and global economic changes on market growth. Lastly, it provides strategic recommendations for new entrants and established companies to navigate the complexities of the market.
Future Outlook:
- USB-C cables will gain further traction as devices standardize around the connector and demand for power and data speeds continues.
- Manufacturers will push boundaries with enhanced materials, offering extra strength, tangle-resistance, and heat management to appeal to quality-conscious consumers.
- Integration of smart features like LED indicators, power negotiation chips, and digital diagnostics in cables will become more common to improve user experience.
- Eco-conscious designs using recycled materials and modular parts will grow in popularity due to increasing environmental regulation and consumer preference.
- Bundling cables with smartphones, power banks, and accessories will remain a key distribution strategy across both online and brick-and-mortar retail.
- OEMs and third-party brands will invest in cross-platform compatibility to simplify charging across ecosystems and reduce consumer friction.
- Wireless charging adoption will complement—but not replace—wired solutions, keeping cable demand strong for fast-charge use cases.
- Regional manufacturers in Asia-Pacific will expand export capabilities while global brands will reinforce presence via certified supply chains.
- Quality assurance and certification standards will tighten, prompting manufacturers to elevate testing and labeling practices.
- E-commerce platforms will continue dominating distribution channels, supporting dynamic pricing models, real-time customer feedback, and faster product updates.
Request a Free Sample
Fill in your details and we'll send you a free sample report.
- Sample data tables & charts
- Research methodology
Need a Custom Version of This Report?
Tailor the scope, geography, or segments to your exact requirements.
- Custom geography or segment scope
- Direct access to our analyst team
Frequently Asked Questions
What is the current size of the Phone Charging Cables Market?
What factors are driving the growth of the Phone Charging Cables Market?
What are the key segments within the Phone Charging Cables Market?
What are some challenges faced by the Phone Charging Cables Market?
Which segment is leading the market share?
Table of Content
Chapter 1. Report Introduction
- 1.1 Report Description & Purpose
- 1.1.1 Report Title & Market Definition
- 1.1.2 Unique Selling Propositions (USP) & Key Differentiators
- 1.1.3 Value Proposition for Stakeholders
- 1.2 Research Objectives
- 1.2.1 Market Sizing Objectives (Volume & Revenue)
- 1.2.2 Segmentation Objectives
- 1.2.3 Competitive Intelligence Objectives
- 1.2.4 Forecast & Scenario Objectives
- 1.3 Report Scope
- 1.3.1 Phone Charging Cables Scope – Types & Subtypes Covered
- 1.3.2 Geographic Scope – Regions & Countries Covered
- 1.3.3 Historical Period, Base Year & Forecast Period (2024; forecast to 2032)
- 1.3.4 Inclusions & Exclusions
- 1.4 HS Code & Classification Framework
- 1.5 Currency, Units & Pricing Basis
- 1.6 Target Stakeholders
- 1.7 Limitations & Assumptions
Chapter 2. Executive Summary
- 2.1 Global Phone Charging Cables Market Snapshot
- 2.1.1 Market Size – Historical (2024) & Forecast (2024-2032) (2024: USD 3,035 million → 2032: USD 4,349 million)
- 2.1.2 Volume & Revenue – Global Totals
- 2.1.3 Key Market Highlights – Top Five Facts
- 2.2 Phone Charging Cables Market Segmentation Snapshot
- 2.2.1 Market Split by Region – 2024 vs. 2032
- 2.3 Competitive Snapshot
- 2.3.1 Top 10 Players by Revenue Share – 2024
- 2.3.2 Top 10 Players by Volume Share – 2024
- 2.3.3 Recent Strategic Developments (18-Month Summary)
- 2.4 Key Investment Highlights & Strategic Conclusions
Chapter 3. Phone Charging Cables Market Dynamics & Industry Analysis
- 3.1 Market Overview & Context
- 3.1.1 Phone Charging Cables Market Position in the Broader Automotive Value Chain
- 3.1.2 OEM vs. Replacement Market Dynamics
- 3.1.3 Market Maturity & Development Stage by Region
- 3.2 Phone Charging Cables Market Drivers
- 3.3 Phone Charging Cables Market Restraints & Challenges
- 3.4 Phone Charging Cables Market Opportunities
- 3.5 Porter's Five Forces Analysis
- 3.5.1 Threat of New Entrants
- 3.5.2 Bargaining Power of Suppliers
- 3.5.3 Bargaining Power of Buyers
- 3.5.4 Threat of Substitutes
- 3.5.5 Competitive Rivalry – Intensity Assessment
- 3.6 Phone Charging Cables Value Chain Analysis
- 3.6.1 Upstream – Raw Material/Input Suppliers
- 3.6.1.1 Raw Material/Input 1
- 3.6.1.2 Raw Material/Input 2
- 3.6.1.3 Raw Material/Input 3
- 3.6.2 Midstream – Production/Manufacturing/Service Delivery
- 3.6.2.1 Production/Process Overview
- 3.6.2.2 Key Facility Locations & Capacity by Manufacturer
- 3.6.3 Downstream – Distribution & End Consumer
- 3.6.3.1 Primary Channel – B2B/OEM
- 3.6.3.2 Secondary Channels – Dealer, Retail, Online, Direct
- 3.6.4 Value Chain Profitability Analysis
- 3.6.1 Upstream – Raw Material/Input Suppliers
- 3.7 PESTEL Analysis
- 3.7.1 Political Factors
- 3.7.2 Economic Factors
- 3.7.3 Social Factors
- 3.7.4 Technological Factors
- 3.7.5 Environmental Factors
- 3.7.6 Legal Factors
- 3.8 Phone Charging Cables Supply Chain Analysis
- 3.8.1 Raw Material/Input Supply Risk Assessment
- 3.8.2 Manufacturing Concentration Risk (Geographic Exposure)
- 3.8.3 Trade Disruption Impact Analysis
- 3.9 Regulatory & Policy Landscape
Note: The regulatory and policy landscape section covers regulations based on their applicability to the market, Phone Charging Cables category, geography, and scope of the study. Only regulatory frameworks with a material impact on operations, compliance, trade, sustainability, or market access are analyzed in detail.
Chapter 4. Key Investment Pockets & Opportunity Analysis
- 4.1 Phone Charging Cables Market Attractiveness Analysis
- 4.1.1 By Region – Investment Attractiveness Matrix (Volume × CAGR)
- 4.2 Absolute Revenue Growth Opportunity
- 4.2.1 By Region – Absolute USD Growth Through 2032
- 4.3 Incremental Volume Opportunity
- 4.3.1 By Region – Incremental Volume Through 2032
- 4.3.2 Segment – Incremental Volume
- 4.4 Emerging Submarket Opportunity Deep Dive (Subject to Applicability)
- 4.5 Emerging Market Opportunity Scorecards
- 4.5.1 United States
- 4.5.2 Europe
- 4.5.3 Asia
- 4.5.4 Middle East & Africa
Note: Emerging Market Opportunity Scorecards will be included based on relevance and strategic importance. Regions listed are indicative and may vary depending on data availability and market dynamics.
Chapter 5. Phone Charging Cables Import-Export Analysis & Trade Flows
- 5.1 Global Trade Overview
- 5.1.1 Global Export Value by Country (2024)
- 5.1.2 Global Export Volume by Country (2024)
- 5.1.3 Global Import Value by Country (2024)
- 5.1.4 Global Import Volume by Country (2024)
- 5.1.5 Net Trade Balance by Country (2024)
- 5.2 Export Analysis – Segment
- 5.2.1 Type 1 (HS Code)
- 5.2.2 Type 2 (HS Code)
- 5.2.3 Type 3 (HS Code)
- 5.2.4 Type 4 (HS Code)
- 5.2.5 Type 5 (HS Code)
- 5.3 Import Analysis – Segment
- 5.3.1 Type 1 (HS Code)
- 5.3.2 Type 2 (HS Code)
- 5.3.3 Type 3 (HS Code)
- 5.3.4 Type 4 (HS Code)
- 5.3.5 Type 5 (HS Code)
- 5.4 Average Unit Trade Prices
- 5.4.1 Average Export Price – Segment & Country
- 5.4.2 Average Import Price – Segment & Source Country
- 5.4.3 Price Trends (2024)
- 5.5 Key Trade Route Analysis
- 5.5.1 Trade Route 1
- 5.5.2 Trade Route 2
- 5.5.3 Trade Route 3
- 5.5.4 Trade Route 4
- 5.5.5 Trade Route 5
- 5.6 Trade Policy Impact Assessment
- 5.6.1 US Anti-Dumping & Section 301 Tariffs
- 5.6.2 EU Customs Union Impact
- 5.6.3 Major Free Trade Agreements
- 5.6.4 USMCA Rules of Origin
Note: Trade policy analysis will be included only where relevant to the Phone Charging Cables market.
Chapter 6. Competitive Landscape & Company Benchmarking
- 6.1 Phone Charging Cables Market Concentration & Structure
- 6.1.1 Herfindahl-Hirschman Index (HHI) – vs. 2024
- 6.1.2 Tier 1, Tier 2 & Tier 3 Market Structure
- 6.1.3 Global, Regional & Local Player Dynamics
- 6.2 Phone Charging Cables Market Share Analysis – 2024
- 6.2.1 Global Revenue Share by Company
- 6.2.2 Global Volume Share by Company
- 6.2.3 Regional Revenue Share
- 6.2.4 Market Share Evolution ( vs. 2024)
- 6.2.5 OEM Segment Share by Company
- 6.2.6 Replacement Segment Share by Company
- 6.3 Production/Delivery Capacity & Facility Analysis
- 6.3.1 Global Installed Capacity
- 6.3.2 Capacity Utilization Rates
- 6.3.3 Production/Output Volume
- 6.3.4 Facility Locations & Capacity Map
- 6.3.5 Planned Capacity Additions
- 6.4 Phone Charging Cables Competitive Benchmarking Matrix
- 6.4.1 Revenue, Volume, CAGR & Profitability Comparison
- 6.4.2 Channel Revenue Mix
- 6.4.3 Geographic Revenue Exposure
- 6.4.4 R&D Intensity
- 6.4.5 Sustainability Maturity
- 6.5 Strategic Developments in Phone Charging Cables (Last 24 Months)
- 6.5.1 Mergers, Acquisitions & Divestments
- 6.5.2 New Phone Charging Cables Launches
- 6.5.3 Facility Expansions
- 6.5.4 Strategic Alliances, Joint Ventures & Partnerships
- 6.5.5 Distribution Expansion & Market Entry
- 6.5.6 Sustainability & ESG Initiatives
- 6.6 Competitive Strategy Mapping
- 6.6.1 Leader, Challenger, Follower & Niche Classification
- 6.6.2 Pricing Strategy Comparison
- 6.6.3 Channel Strategy Matrix
Note: Strategic developments are included based on their materiality and the availability of reliable information.
Chapter 7. Global Phone Charging Cables Market – By Distribution Channel
- 7.1 Segment Overview
- 7.1.1 Volume & Revenue Split by Channel (2024 & 2032)
- 7.1.2 Channel Mix Evolution (2024-2032)
Chapter 8. Regional Market Analysis – Global Overview
- 8.1 Global Regional Overview
- 8.1.1 Regional Volume Share
- 8.1.2 Regional Revenue Share
- 8.1.3 Regional Volume by Region
- 8.1.4 Regional Revenue by Region
- 8.1.5 Regional Forecast Through 2032
- 8.2 Cross-Regional Segment Analysis
- 8.2.1 By Distribution Channel
- 8.2.2 By Brand/Price Tier
Chapter 9. North America Phone Charging Cables Market
- 9.1 United States
- 9.2 Canada
- 9.3 Mexico
Chapter 10. Europe Phone Charging Cables Market
- 10.1 Germany
- 10.2 France
- 10.3 Italy
- 10.4 United Kingdom
- 10.5 Spain
- 10.6 Poland
- 10.7 Russia
- 10.8 Netherlands
- 10.9 Belgium
- 10.10 Sweden
- 10.11 Denmark
- 10.12 Norway
- 10.13 Rest of Europe
Chapter 11. Asia Pacific Phone Charging Cables Market
- 11.1 China
- 11.2 India
- 11.3 Japan
- 11.4 South Korea
- 11.5 Thailand
- 11.6 Indonesia
- 11.7 Vietnam
- 11.8 Malaysia
- 11.9 Australia
- 11.10 Rest of Asia Pacific
Chapter 12. Latin America Phone Charging Cables Market
- 12.1 Brazil
- 12.2 Argentina
- 12.3 Colombia
- 12.4 Chile
- 12.5 Rest of Latin America
Chapter 13. Middle East Phone Charging Cables Market
- 13.1 Saudi Arabia
- 13.2 United Arab Emirates
- 13.3 Turkey
- 13.4 Israel
- 13.5 Iran
- 13.6 Rest of the Middle East
Chapter 14. Africa Phone Charging Cables Market
- 14.1 South Africa
- 14.2 Egypt
- 14.3 Nigeria
- 14.4 Morocco
- 14.5 Rest of Africa
Chapter 15. Phone Charging Cables Company Profiles
- 15.1 [Company 01]
- 15.1.1 Company Overview
- 15.1.2 Key Management Personnel
- 15.1.3 Products & Services Portfolio
- 15.1.4 Financial Performance
- 15.1.5 Key Market Focus & Geographic Presence
- 15.1.6 Recent Developments & Strategic Initiatives
Note: The company profile list is preliminary and may change based on research findings, market developments, data availability, and client requirements.
Chapter 16. Appendices
- Appendix A – List of Abbreviations & Acronyms
- Appendix B – Industry Classification Code Reference – Full Series
- Appendix C – Production & Capacity Data Tables
- Appendix D – End-Use & Demand Base Tables
- Appendix E – Consumption & Replacement Rate Assumptions
- Appendix F – ASP Reference Tables
- Appendix G – Manufacturing & Facility Database
- Appendix H – Import-Export Data Tables
- Appendix I – Regulatory Summary Tables
- Appendix J – Primary Research Participant List (Anonymized)
- Appendix K – Primary Research Questionnaire Framework
- Appendix L – Data Sources & Bibliography
- Appendix M – Market Size Divergence & Source Comparison
Chapter 17. Research Methodology
- 17.1 Research Framework & Philosophy
- 17.2 Secondary Research – Sources, Hierarchy & Data Extraction
- 17.3 Data Modeling – Bottom-Up & Top-Down Market Sizing
- 17.4 Primary Research – Stakeholder Framework, LOI & Sample Sizes
- 17.5 Forecast Methodology – Regression, Scenario & Sensitivity Analysis
- 17.6 Quality Control – Four-Layer Validation Framework
- 17.7 Limitations & Standard Assumptions
- 17.8 Disclaimer
