
Market Overview
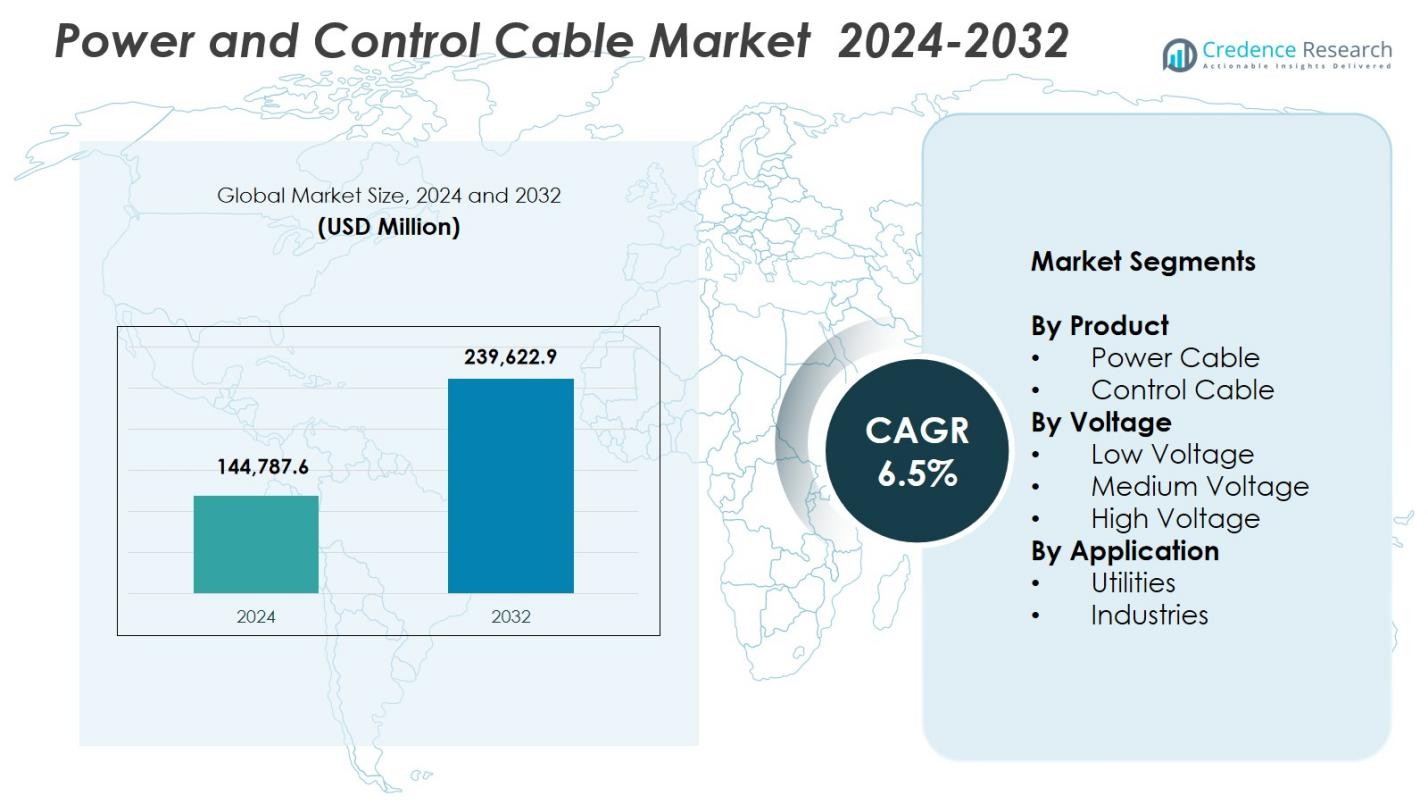
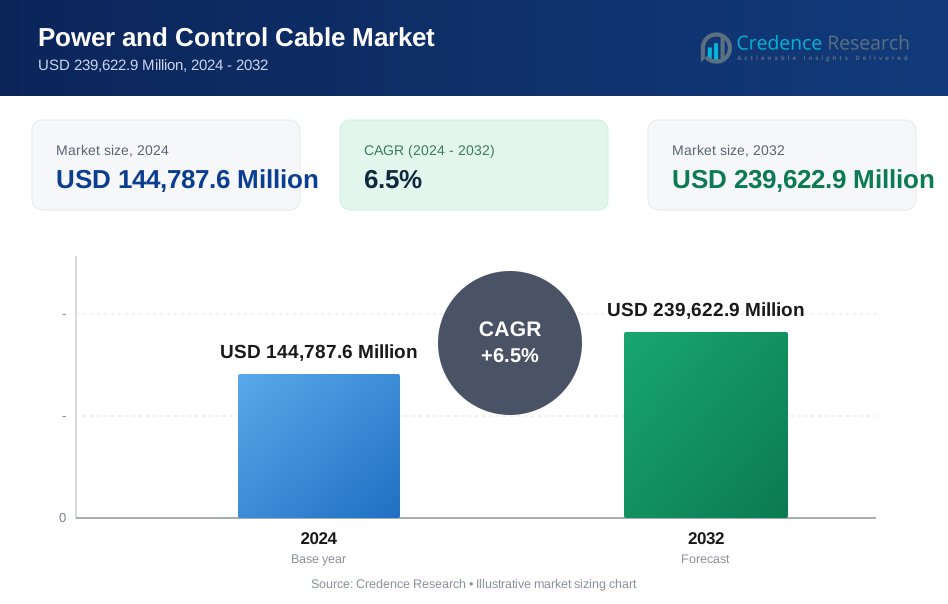
Power and Control Cable Market size was valued at USD 144,787.6 Million in 2024 and is anticipated to reach USD 239,622.9 Million by 2032, at a CAGR of 6.5% during the forecast period.
| REPORT ATTRIBUTE | DETAILS |
|---|---|
| Historical Period | 2020-2023 |
| Base Year | 2024 |
| Forecast Period | 2025-2032 |
| Power and Control Cable Market Size 2024 | USD 144,787.6 Million |
| Power and Control Cable Market, CAGR | 6.5% |
| Power and Control Cable Market Size 2032 | USD 239,622.9 Million |
Power and Control Cable Market features prominent players such as KEI Industries Limited, NKT A/S, Leoni Cables, Havells India Ltd, Polycab, LS Cables, Belden Inc., Bergen Cable Technology, Klaus Faber AG, and Furukawa Electric Co., Ltd., all focusing on expanding product portfolios and supporting large-scale utility and industrial applications. Asia Pacific emerged as the leading region with a 43.6% market share, driven by rapid urbanization, infrastructure growth, and strong investments in grid modernization across China and India. Europe accounted for 26.8%, supported by offshore wind projects and stringent safety regulations, while North America held 21.4% due to continuous upgrades in transmission networks and rising adoption of smart cable technologies.
Market Insights
- Power and Control Cable Market reached USD 144,787.6 Million in 2024 and will grow at a CAGR of 6.5% through 2032.
- Market growth is driven by grid modernization, renewable energy integration, and rising industrial electrification, supporting strong adoption of power cables holding a 68.4% share.
- Key trends include the shift toward smart, fire-resistant, and low-smoke halogen-free cables, along with rising demand from data centers, EV charging networks, and automation-driven industries.
- Major players such as KEI Industries, NKT A/S, Polycab, Havells India, and LS Cables expand portfolios through R&D, capacity upgrades, and long-term utility partnerships to strengthen market positioning.
- Asia Pacific leads with a 43.6% regional share, followed by Europe at 26.8% and North America at 21.4%, supported by strong construction activity, renewable deployment, and rapid expansion of low-voltage applications holding a 54.7% segment share.
Market Segmentation Analysis:
By Product
In the Power and Control Cable Market, power cables held the dominant position in 2024 with a market share of 68.4%, driven by large-scale grid expansion, industrial electrification, and rising renewable energy installations. Their extensive use in transmission and distribution networks strengthens demand across utilities and infrastructure projects. Control cables accounted for the remaining 31.6%, supported by automation growth, smart manufacturing, and machinery upgrades. The increasing requirement for reliable energy transmission, enhanced load-bearing capacity, and system safety primarily fuels the strong adoption of power cables, reinforcing their leadership in global installations.
- For instance, Sumitomo Electric acquired Südkabel in June 2024 to produce 525 kV HVDC cables in Germany for Amprion's A-Nord, Korridor B49, and Rhein-Main-Link grid projects.
By Voltage
The low-voltage segment led the market with a market share of 54.7% in 2024, supported by widespread use in commercial buildings, residential electrification, urban infrastructure, and distributed power systems. Its dominance stems from high consumption in internal wiring, small-scale power distribution, and rapid construction activities. The medium-voltage segment contributed 28.9%, driven by industrial networks and sub-transmission lines, while high-voltage cables held 16.4%, supported by large-scale utility projects. Growing smart-city development, sustained industrial expansion, and increasing electricity access initiatives continue to reinforce the global preference for low-voltage systems.
- For instance, Sumitomo Electric Industries, Ltd. launched Thunderbolt 5 low-voltage cables at Integrated Systems Europe (ISE) 2025, enhancing performance for AV and IT applications in smart buildings.
By Application
The utilities segment dominated the market with a market share of 61.2% in 2024, driven by extensive grid modernization programs, transmission line expansion, and rising renewable energy integration. Utilities rely heavily on high-performance power and control cables for stable load management and long-distance electricity distribution. The industrial segment accounted for 38.8%, supported by manufacturing automation, oil and gas facilities, mining operations, and process-industry electrification. Increasing global investments in strengthening power infrastructure, reducing technical losses, and enhancing operational reliability ensure utilities remain the largest consumers of advanced cable solutions.
Key Growth Drivers
Expansion of Grid Modernization and Renewable Energy Integration
Grid modernization initiatives and the rapid integration of renewable power systems strongly accelerate demand for power and control cables. Utilities worldwide continue upgrading legacy networks to support higher load capacity, improved reliability, and enhanced transmission efficiency. Solar and wind projects require extensive cabling for power evacuation, grid tie-ins, and control system connectivity. Governments are increasingly investing in distributed energy infrastructure and smart grids, which strengthens consumption across low-, medium-, and high-voltage categories. These developments collectively reinforce sustained market growth as energy transition goals intensify.
- For instance, Palo Alto Utilities is replacing 296,300 circuit feet of open wire secondary conductors with aluminum aerial cable as part of its Grid Modernization Project, which also upgrades 1,413 transformers to 50kVA or larger for full electrification support.
Rising Industrial Electrification and Automation Adoption
Industries are significantly increasing their consumption of power and control cables due to expanding automation, advanced machinery deployment, and the need for efficient energy distribution within complex facilities. Sectors such as manufacturing, oil and gas, mining, and chemicals are investing in high-performance cables that support uninterrupted operations, remote monitoring, and precise control functions. Electrification initiatives within heavy industries further boost medium-voltage and control cable demand. As industries embrace smart factories, predictive maintenance, and IoT-enabled equipment, the requirement for robust, long-life cabling systems continues to accelerate globally.
- For instance, HELUKABEL provides specialized instrumentation cables, control cables, and Ethernet solutions for oil rigs, refineries, and petrochemical plants, designed to endure extreme temperatures and harsh conditions while enabling precise measurement, control, and data transmission.
Urban Infrastructure Growth and Construction Activities
Urbanization and construction activities substantially contribute to market expansion, with large-scale projects requiring extensive cable networks for residential, commercial, and public infrastructure. Low-voltage cables remain essential for internal wiring, HVAC systems, and backup power circuits in buildings, while power distribution cables support metro rails, airports, data centers, and transport corridors. Increased government spending on housing, utilities, and smart-city initiatives strengthens the demand profile. The need for safe, energy-efficient, and fire-resistant cable systems across expanding urban landscapes drives consistent growth across product categories.
Key Trends & Opportunities
Shift Toward Smart, Energy-Efficient, and Fire-Resistant Cable Technologies
A major industry trend involves the adoption of intelligent cable systems engineered for enhanced safety, energy efficiency, and operational monitoring. Fire-resistant, low-smoke, and halogen-free cables are gaining traction as regulatory authorities enforce stringent building safety norms. Smart cables equipped with embedded sensors offer real-time performance tracking, fault detection, and predictive maintenance capabilities. These technologies significantly reduce downtime and enhance reliability in industrial and utility environments. Growing investments in digital infrastructure and modern construction create strong opportunities for technologically advanced cable solutions.
- For instance, GBS offers SMART Cables with Fiber Bragg Grating (FBG) point sensors for precise measurements along cable systems in monitoring applications. These provide real-time data on physical properties, reducing risks in environments like subsea connections and pipelines.
Rising Demand from Data Centers, EV Infrastructure, and Industrial Automation
Emerging high-growth sectors such as data centers, electric vehicle charging networks, and automated industrial facilities present strong opportunities for cable manufacturers. Data centers require high-voltage and control cables for uninterrupted power supply and thermal efficiency, while EV infrastructure development drives the need for durable outdoor cabling and fast-charging support systems. Industrial automation continues to expand cable consumption across robotics, process machinery, and monitoring systems. As global economies accelerate digitalization and clean mobility adoption, demand for specialized, high-performance cables is set to rise sharply.
- For instance, Tesla’s Supercharger network utilizes specialized cables designed for high current and rapid thermal dissipation to enable fast charging.
Key Challenges
Volatility in Raw Material Prices and Supply Chain Disruptions
Fluctuating prices of copper, aluminum, PVC, rubber, and polymers significantly impact manufacturing costs for power and control cables. Supply chain inefficiencies—driven by geopolitical instability, freight delays, and material shortages—increase production lead times and reduce profit margins. Manufacturers face added pressure to stabilize sourcing strategies while maintaining quality standards. These uncertainties often force companies to adjust pricing structures, affecting buyer decisions and project timelines. Managing cost volatility while ensuring consistent supply remains one of the most persistent challenges for industry participants.
Stringent Compliance Requirements and Installation Complexities
Power and control cable manufacturers operate under strict international and regional standards related to fire safety, electromagnetic compatibility, insulation quality, and environmental compliance. Meeting these requirements requires continuous product testing, certification, and process upgrades, increasing operational costs. Installation complexities—especially in underground networks, high-voltage systems, and hazardous industrial environments—add further challenges. The need for skilled labor, precise engineering, and adherence to structural norms often slows project execution. These regulatory and technical constraints pose significant barriers to rapid market deployment.
Regional Analysis
North America
North America held a 21.4% market share in the Power and Control Cable Market in 2024, supported by strong investments in grid modernization, renewable energy expansion, and the refurbishment of aging transmission infrastructure. The United States leads regional growth with sustained upgrades to utility networks, data center expansion, and EV charging infrastructure development. Canada’s rising hydropower integration and industrial electrification further strengthen cable consumption. The region also benefits from stringent safety regulations and the adoption of fire-resistant and smart cable technologies, reinforcing consistent long-term demand across industrial, commercial, and utility applications.
Europe
Europe accounted for a 26.8% market share in 2024, driven by large-scale renewable energy integration, offshore wind expansion, and cross-border interconnection projects across the EU. Countries such as Germany, France, the U.K., and the Nordics are investing heavily in high-voltage and medium-voltage cable infrastructure to enhance transmission efficiency and support green energy goals. Rapid urban development and the modernization of railways and industrial clusters contribute to rising demand. Strong regulatory mandates for energy efficiency, low-smoke halogen-free cables, and advanced fire-safety standards further accelerate the region’s adoption of high-performance cable systems.
Asia Pacific
Asia Pacific dominated the global landscape with a 43.6% market share in 2024, making it the largest regional contributor due to rapid urbanization, extensive industrialization, and continuous expansion of power distribution networks. China and India lead grid upgrades, renewable installations, and large construction projects, significantly boosting low- and medium-voltage cable demand. Southeast Asia’s accelerating manufacturing growth and improving electrification rates add to market momentum. Government-led infrastructure spending, rising data center development, and EV charging rollout reinforce strong regional consumption. The region remains the fastest-growing market due to sustained economic expansion and large population-driven electricity needs.
Latin America
Latin America captured a 4.9% market share in 2024, supported by increasing investments in utility strengthening, renewable energy deployment, and industrial development across Brazil, Mexico, Chile, and Argentina. Growing emphasis on grid reliability and rural electrification drives demand for low-voltage and medium-voltage cables. Industrial sectors such as mining, oil and gas, and manufacturing contribute significantly to consumption due to their high energy requirements. Government-backed infrastructure modernization and clean-energy initiatives further enhance market opportunities. However, economic fluctuations and supply chain inefficiencies remain challenges, influencing the pace of cable infrastructure implementation across the region.
Middle East & Africa
The Middle East & Africa region held a 3.3% market share in 2024, driven by significant power infrastructure expansion, industrial diversification, and large-scale construction projects. The Middle East benefits from strong investments in utility upgrades, oil and gas facilities, and mega infrastructure developments in the UAE, Saudi Arabia, and Qatar. Africa’s grid expansion programs and rising electrification efforts stimulate demand for low-voltage and medium-voltage cables. Renewable energy initiatives, particularly solar, further strengthen market prospects. Although growth potential remains high, the region faces challenges related to regulatory variations and project financing constraints.
Market Segmentations:
By Product
- Power Cable
- Control Cable
By Voltage
- Low Voltage
- Medium Voltage
- High Voltage
By Application
- Utilities
- Industries
By Geography
- North America
- U.S.
- Canada
- Mexico
- Europe
- Germany
- France
- U.K.
- Italy
- Spain
- Rest of Europe
- Asia Pacific
- China
- Japan
- India
- South Korea
- South-east Asia
- Rest of Asia Pacific
- Latin America
- Brazil
- Argentina
- Rest of Latin America
- Middle East & Africa
- GCC Countries
- South Africa
- Rest of the Middle East and Africa
Competitive Landscape
The competitive landscape of the Power and Control Cable Market features major players such as KEI Industries Limited, NKT A/S, Leoni Cables, Havells India Ltd, Bergen Cable Technology, Klaus Faber AG, LS Cables, Polycab, Belden Inc., and Furukawa Electric Co., Ltd. These companies focus on expanding manufacturing capacity, strengthening global distribution networks, and advancing product innovation to meet rising demand across utilities, industrial facilities, and large infrastructure projects. Market leaders prioritize high-performance, fire-resistant, and energy-efficient cable technologies while investing heavily in R&D to support grid modernization, EV infrastructure, and renewable energy integration. Strategic initiatives such as partnerships with utility providers, long-term supply contracts, and investments in smart cable systems enhance competitive positioning. Additionally, companies with strong vertical integration and diversified voltage portfolios maintain cost advantages and operational efficiency. Emerging players increasingly target automation-driven industries, renewable projects, and construction growth to establish a broader market presence.
Key Player Analysis
- KEI Industries Limited
- NKT A/S
- Leoni Cables
- Havells India Ltd
- Bergen Cable Technology
- Klaus Faber AG
- LS Cables
- Polycab
- Belden Inc.
- FURUKAWA ELECTRIC CO., LTD
Recent Developments
- In December2025, KEI Industries Limited started trial production of LT/HT cables at its new greenfield facility in Sanand, Gujarat.
- In November 2025, Polycab announced the launch of a new solar-cable product line and underscored its commitment to renewable-energy markets.
- In November 2024, Gaon Cable Co. acquired a 100% stake in the U.S. arm of LS Cable & System, marking a strategic move to strengthen its overseas power-infrastructure footprint.
Report Coverage
The research report offers an in-depth analysis based on Product, Voltage, Application and Geography. It details leading market players, providing an overview of their business, product offerings, investments, revenue streams, and key applications. Additionally, the report includes insights into the competitive environment, SWOT analysis, current market trends, as well as the primary drivers and constraints. Furthermore, it discusses various factors that have driven market expansion in recent years. The report also explores market dynamics, regulatory scenarios, and technological advancements that are shaping the industry. It assesses the impact of external factors and global economic changes on market growth. Lastly, it provides strategic recommendations for new entrants and established companies to navigate the complexities of the market.
Future Outlook
- The market will experience steady growth as utilities continue upgrading grids and expanding transmission networks.
- Renewable energy expansion will increase demand for high-performance power and control cables across solar and wind projects.
- Smart cities and digital infrastructure development will drive higher consumption of low-voltage and fire-resistant cable solutions.
- Industrial automation will strengthen adoption of control cables for machinery, robotics, and process optimization.
- Data center expansion will require advanced cabling systems to support high-load distribution and backup power reliability.
- EV charging infrastructure rollout will boost demand for durable outdoor and medium-voltage cable systems.
- Technological advancements will accelerate adoption of smart cables with embedded sensors and real-time monitoring capabilities.
- Manufacturers will increase investments in sustainable, halogen-free, and energy-efficient cable technologies.
- Regulatory tightening on safety and environmental compliance will shape product innovation and certification requirements.
- Global supply chain optimization and material diversification will become strategic priorities to ensure stable production and pricing.
Request a Free Sample
Fill in your details and we'll send you a free sample report.
- Sample data tables & charts
- Research methodology
Need a Custom Version of This Report?
Tailor the scope, geography, or segments to your exact requirements.
- Custom geography or segment scope
- Direct access to our analyst team
Frequently Asked Questions
What is the current market size for the Power and Control Cable Market, and what is its projected size in 2032?
At what Compound Annual Growth Rate is the Power and Control Cable Market projected to grow between 2025 and 2032?
Which Power and Control Cable Market segment held the largest share in 2024?
What are the primary factors fueling the growth of the Power and Control Cable Market?
Who are the leading companies in the Power and Control Cable Market?
Which region commanded the largest share of the Power and Control Cable Market in 2024?
Table of Content
Chapter 1. Report Introduction
- 1.1 Report Description & Purpose
- 1.1.1 Report Title & Market Definition
- 1.1.2 Unique Selling Propositions (USP) & Key Differentiators
- 1.1.3 Value Proposition for Stakeholders
- 1.2 Research Objectives
- 1.2.1 Market Sizing Objectives (Volume & Revenue)
- 1.2.2 Segmentation Objectives
- 1.2.3 Competitive Intelligence Objectives
- 1.2.4 Forecast & Scenario Objectives
- 1.3 Report Scope
- 1.3.1 Power and Control Cable Scope – Types & Subtypes Covered
- 1.3.2 Geographic Scope – Regions & Countries Covered
- 1.3.3 Historical Period, Base Year & Forecast Period (2024; forecast to 2032)
- 1.3.4 Inclusions & Exclusions
- 1.4 HS Code & Classification Framework
- 1.5 Currency, Units & Pricing Basis
- 1.6 Target Stakeholders
- 1.7 Limitations & Assumptions
Chapter 2. Executive Summary
- 2.1 Global Power and Control Cable Market Snapshot
- 2.1.1 Market Size – Historical (2024) & Forecast (2024-2032) (2024: USD 144,787.6 Million → 2032: USD 239,622.9 Million)
- 2.1.2 Volume & Revenue – Global Totals
- 2.1.3 Key Market Highlights – Top Five Facts
- 2.2 Power and Control Cable Market Segmentation Snapshot
- 2.2.1 Market Split by Region – 2024 vs. 2032
- 2.3 Competitive Snapshot
- 2.3.1 Top 10 Players by Revenue Share – 2024
- 2.3.2 Top 10 Players by Volume Share – 2024
- 2.3.3 Recent Strategic Developments (18-Month Summary)
- 2.4 Key Investment Highlights & Strategic Conclusions
Chapter 3. Power and Control Cable Market Dynamics & Industry Analysis
- 3.1 Market Overview & Context
- 3.1.1 Power and Control Cable Market Position in the Broader Automotive Value Chain
- 3.1.2 OEM vs. Replacement Market Dynamics
- 3.1.3 Market Maturity & Development Stage by Region
- 3.2 Power and Control Cable Market Drivers
- 3.3 Power and Control Cable Market Restraints & Challenges
- 3.4 Power and Control Cable Market Opportunities
- 3.5 Porter's Five Forces Analysis
- 3.5.1 Threat of New Entrants
- 3.5.2 Bargaining Power of Suppliers
- 3.5.3 Bargaining Power of Buyers
- 3.5.4 Threat of Substitutes
- 3.5.5 Competitive Rivalry – Intensity Assessment
- 3.6 Power and Control Cable Value Chain Analysis
- 3.6.1 Upstream – Raw Material/Input Suppliers
- 3.6.1.1 Raw Material/Input 1
- 3.6.1.2 Raw Material/Input 2
- 3.6.1.3 Raw Material/Input 3
- 3.6.2 Midstream – Production/Manufacturing/Service Delivery
- 3.6.2.1 Production/Process Overview
- 3.6.2.2 Key Facility Locations & Capacity by Manufacturer
- 3.6.3 Downstream – Distribution & End Consumer
- 3.6.3.1 Primary Channel – B2B/OEM
- 3.6.3.2 Secondary Channels – Dealer, Retail, Online, Direct
- 3.6.4 Value Chain Profitability Analysis
- 3.6.1 Upstream – Raw Material/Input Suppliers
- 3.7 PESTEL Analysis
- 3.7.1 Political Factors
- 3.7.2 Economic Factors
- 3.7.3 Social Factors
- 3.7.4 Technological Factors
- 3.7.5 Environmental Factors
- 3.7.6 Legal Factors
- 3.8 Power and Control Cable Supply Chain Analysis
- 3.8.1 Raw Material/Input Supply Risk Assessment
- 3.8.2 Manufacturing Concentration Risk (Geographic Exposure)
- 3.8.3 Trade Disruption Impact Analysis
- 3.9 Regulatory & Policy Landscape
Note: The regulatory and policy landscape section covers regulations based on their applicability to the market, Power and Control Cable category, geography, and scope of the study. Only regulatory frameworks with a material impact on operations, compliance, trade, sustainability, or market access are analyzed in detail.
Chapter 4. Key Investment Pockets & Opportunity Analysis
- 4.1 Power and Control Cable Market Attractiveness Analysis
- 4.1.1 By Region – Investment Attractiveness Matrix (Volume × CAGR)
- 4.2 Absolute Revenue Growth Opportunity
- 4.2.1 By Region – Absolute USD Growth Through 2032
- 4.3 Incremental Volume Opportunity
- 4.3.1 By Region – Incremental Volume Through 2032
- 4.3.2 Segment – Incremental Volume
- 4.4 Emerging Submarket Opportunity Deep Dive (Subject to Applicability)
- 4.5 Emerging Market Opportunity Scorecards
- 4.5.1 United States
- 4.5.2 Europe
- 4.5.3 Asia
- 4.5.4 Middle East & Africa
Note: Emerging Market Opportunity Scorecards will be included based on relevance and strategic importance. Regions listed are indicative and may vary depending on data availability and market dynamics.
Chapter 5. Power and Control Cable Import-Export Analysis & Trade Flows
- 5.1 Global Trade Overview
- 5.1.1 Global Export Value by Country (2024)
- 5.1.2 Global Export Volume by Country (2024)
- 5.1.3 Global Import Value by Country (2024)
- 5.1.4 Global Import Volume by Country (2024)
- 5.1.5 Net Trade Balance by Country (2024)
- 5.2 Export Analysis – Segment
- 5.2.1 Type 1 (HS Code)
- 5.2.2 Type 2 (HS Code)
- 5.2.3 Type 3 (HS Code)
- 5.2.4 Type 4 (HS Code)
- 5.2.5 Type 5 (HS Code)
- 5.3 Import Analysis – Segment
- 5.3.1 Type 1 (HS Code)
- 5.3.2 Type 2 (HS Code)
- 5.3.3 Type 3 (HS Code)
- 5.3.4 Type 4 (HS Code)
- 5.3.5 Type 5 (HS Code)
- 5.4 Average Unit Trade Prices
- 5.4.1 Average Export Price – Segment & Country
- 5.4.2 Average Import Price – Segment & Source Country
- 5.4.3 Price Trends (2024)
- 5.5 Key Trade Route Analysis
- 5.5.1 Trade Route 1
- 5.5.2 Trade Route 2
- 5.5.3 Trade Route 3
- 5.5.4 Trade Route 4
- 5.5.5 Trade Route 5
- 5.6 Trade Policy Impact Assessment
- 5.6.1 US Anti-Dumping & Section 301 Tariffs
- 5.6.2 EU Customs Union Impact
- 5.6.3 Major Free Trade Agreements
- 5.6.4 USMCA Rules of Origin
Note: Trade policy analysis will be included only where relevant to the Power and Control Cable market.
Chapter 6. Competitive Landscape & Company Benchmarking
- 6.1 Power and Control Cable Market Concentration & Structure
- 6.1.1 Herfindahl-Hirschman Index (HHI) – vs. 2024
- 6.1.2 Tier 1, Tier 2 & Tier 3 Market Structure
- 6.1.3 Global, Regional & Local Player Dynamics
- 6.2 Power and Control Cable Market Share Analysis – 2024
- 6.2.1 Global Revenue Share by Company
- 6.2.2 Global Volume Share by Company
- 6.2.3 Regional Revenue Share
- 6.2.4 Market Share Evolution ( vs. 2024)
- 6.2.5 OEM Segment Share by Company
- 6.2.6 Replacement Segment Share by Company
- 6.3 Production/Delivery Capacity & Facility Analysis
- 6.3.1 Global Installed Capacity
- 6.3.2 Capacity Utilization Rates
- 6.3.3 Production/Output Volume
- 6.3.4 Facility Locations & Capacity Map
- 6.3.5 Planned Capacity Additions
- 6.4 Power and Control Cable Competitive Benchmarking Matrix
- 6.4.1 Revenue, Volume, CAGR & Profitability Comparison
- 6.4.2 Channel Revenue Mix
- 6.4.3 Geographic Revenue Exposure
- 6.4.4 R&D Intensity
- 6.4.5 Sustainability Maturity
- 6.5 Strategic Developments in Power and Control Cable (Last 24 Months)
- 6.5.1 Mergers, Acquisitions & Divestments
- 6.5.2 New Power and Control Cable Launches
- 6.5.3 Facility Expansions
- 6.5.4 Strategic Alliances, Joint Ventures & Partnerships
- 6.5.5 Distribution Expansion & Market Entry
- 6.5.6 Sustainability & ESG Initiatives
- 6.6 Competitive Strategy Mapping
- 6.6.1 Leader, Challenger, Follower & Niche Classification
- 6.6.2 Pricing Strategy Comparison
- 6.6.3 Channel Strategy Matrix
Note: Strategic developments are included based on their materiality and the availability of reliable information.
Chapter 7. Global Power and Control Cable Market – By Distribution Channel
- 7.1 Segment Overview
- 7.1.1 Volume & Revenue Split by Channel (2024 & 2032)
- 7.1.2 Channel Mix Evolution (2024-2032)
Chapter 8. Regional Market Analysis – Global Overview
- 8.1 Global Regional Overview
- 8.1.1 Regional Volume Share
- 8.1.2 Regional Revenue Share
- 8.1.3 Regional Volume by Region
- 8.1.4 Regional Revenue by Region
- 8.1.5 Regional Forecast Through 2032
- 8.2 Cross-Regional Segment Analysis
- 8.2.1 By Distribution Channel
- 8.2.2 By Brand/Price Tier
Chapter 9. North America Power and Control Cable Market
- 9.1 United States
- 9.2 Canada
- 9.3 Mexico
Chapter 10. Europe Power and Control Cable Market
- 10.1 Germany
- 10.2 France
- 10.3 Italy
- 10.4 United Kingdom
- 10.5 Spain
- 10.6 Poland
- 10.7 Russia
- 10.8 Netherlands
- 10.9 Belgium
- 10.10 Sweden
- 10.11 Denmark
- 10.12 Norway
- 10.13 Rest of Europe
Chapter 11. Asia Pacific Power and Control Cable Market
- 11.1 China
- 11.2 India
- 11.3 Japan
- 11.4 South Korea
- 11.5 Thailand
- 11.6 Indonesia
- 11.7 Vietnam
- 11.8 Malaysia
- 11.9 Australia
- 11.10 Rest of Asia Pacific
Chapter 12. Latin America Power and Control Cable Market
- 12.1 Brazil
- 12.2 Argentina
- 12.3 Colombia
- 12.4 Chile
- 12.5 Rest of Latin America
Chapter 13. Middle East Power and Control Cable Market
- 13.1 Saudi Arabia
- 13.2 United Arab Emirates
- 13.3 Turkey
- 13.4 Israel
- 13.5 Iran
- 13.6 Rest of the Middle East
Chapter 14. Africa Power and Control Cable Market
- 14.1 South Africa
- 14.2 Egypt
- 14.3 Nigeria
- 14.4 Morocco
- 14.5 Rest of Africa
Chapter 15. Power and Control Cable Company Profiles
- 15.1 [Company 01]
- 15.1.1 Company Overview
- 15.1.2 Key Management Personnel
- 15.1.3 Products & Services Portfolio
- 15.1.4 Financial Performance
- 15.1.5 Key Market Focus & Geographic Presence
- 15.1.6 Recent Developments & Strategic Initiatives
Note: The company profile list is preliminary and may change based on research findings, market developments, data availability, and client requirements.
Chapter 16. Appendices
- Appendix A – List of Abbreviations & Acronyms
- Appendix B – Industry Classification Code Reference – Full Series
- Appendix C – Production & Capacity Data Tables
- Appendix D – End-Use & Demand Base Tables
- Appendix E – Consumption & Replacement Rate Assumptions
- Appendix F – ASP Reference Tables
- Appendix G – Manufacturing & Facility Database
- Appendix H – Import-Export Data Tables
- Appendix I – Regulatory Summary Tables
- Appendix J – Primary Research Participant List (Anonymized)
- Appendix K – Primary Research Questionnaire Framework
- Appendix L – Data Sources & Bibliography
- Appendix M – Market Size Divergence & Source Comparison
Chapter 17. Research Methodology
- 17.1 Research Framework & Philosophy
- 17.2 Secondary Research – Sources, Hierarchy & Data Extraction
- 17.3 Data Modeling – Bottom-Up & Top-Down Market Sizing
- 17.4 Primary Research – Stakeholder Framework, LOI & Sample Sizes
- 17.5 Forecast Methodology – Regression, Scenario & Sensitivity Analysis
- 17.6 Quality Control – Four-Layer Validation Framework
- 17.7 Limitations & Standard Assumptions
- 17.8 Disclaimer
