Market Overview
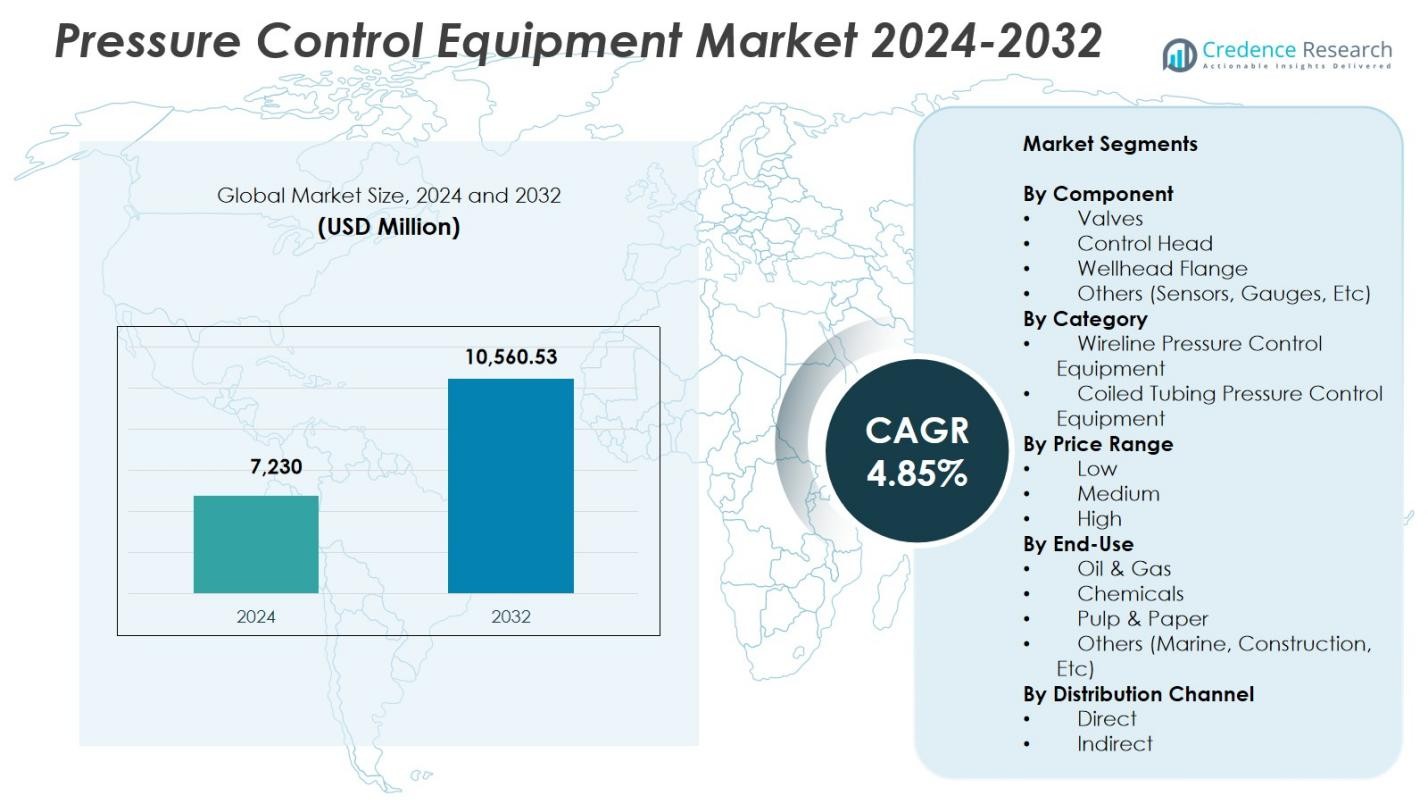
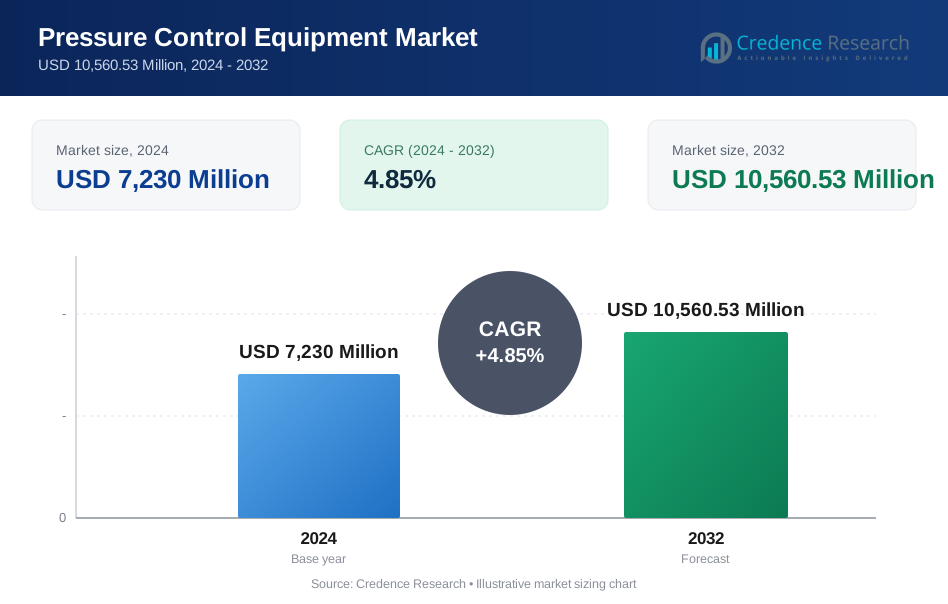
Pressure Control Equipment Market size was valued at USD 7,230 Million in 2024 and is anticipated to reach USD 10,560.53 Million by 2032, at a CAGR of 4.85% during the forecast period.
| REPORT ATTRIBUTE | DETAILS |
|---|---|
| Historical Period | 2020-2023 |
| Base Year | 2024 |
| Forecast Period | 2025-2032 |
| Pressure Control Equipment Market Size 2024 | USD 7,230 Million |
| Pressure Control Equipment Market, CAGR | 4.85% |
| Pressure Control Equipment Market Size 2032 | USD 10,560.53 Million |
Pressure Control Equipment Market is shaped by the presence of leading players such as Curtiss-Wright Corporation, Halliburton Company, Dril-Quip, Inc., General Electric Company (GE Oil & Gas), Emerson Electric Co., Honeywell International Inc., Baker Hughes Company, Aker Solutions ASA, Cameron International Corporation, and FMC Technologies, Inc., all of which focus on advanced HPHT systems, digital monitoring tools, and durable well-control components. North America led the market with a 38.6% share in 2024, driven by strong shale activity and high well intervention rates, followed by Asia-Pacific with a 26.9% share, supported by expanding offshore and onshore drilling programs.
Market Insights
- Pressure Control Equipment Market reached USD 7,230 Million in 2024 and will grow at a CAGR of 4.85% through 2032.
- Market growth is driven by rising unconventional drilling, deepwater projects, and increasing demand for HPHT-capable valves, which held a 41.8% segment share in 2024.
- Key trends include rapid adoption of IoT-enabled monitoring systems, automation of well-control operations, and integration of digital twins to enhance operational efficiency and safety.
- Major players such as Halliburton, Baker Hughes, GE Oil & Gas, Cameron, and Aker Solutions expand portfolios through product innovation and strategic partnerships to strengthen market positioning.
- North America led with a 38.6% share, followed by Asia-Pacific at 26.9% and Europe at 22.4%, reflecting strong shale activity, rising offshore development, and investment in mature field redevelopment.
 Market Segmentation Analysis:
By Component
In the Pressure Control Equipment Market, valves dominated the component segment with a 41.8% share in 2024, driven by their extensive use in maintaining well integrity, regulating flow, and ensuring safe high-pressure operations across drilling and completion activities. Their adoption is strengthened by rising unconventional exploration, deeper wells, and increasing demand for advanced high-pressure, high-temperature (HPHT) systems. Control heads and wellhead flanges continue to gain traction as operators prioritize enhanced operational safety and real-time control, while sensors and gauges benefit from the growing integration of digital monitoring and automated pressure-management solutions.
- For instance, Baker Hughes' REALM series HPHT tubing-retrievable subsurface safety valves withstand extreme pressures exceeding 28,000 psi and temperatures up to 450°F, providing 100% metal-to-metal sealing for wellbore fluids in critical HP/HT wells.
By Category
The wireline pressure control equipment segment accounted for 56.4% of the category share in 2024, making it the dominant sub-segment due to its essential role in interventions, logging, perforation, and completion support in both onshore and offshore wells. Its leadership is reinforced by the increasing frequency of well intervention activities and the need for safer deployment of tools under high-pressure conditions. Coiled tubing pressure control equipment also shows strong growth as demand rises for cleanouts, milling, and stimulation operations aligned with higher shale well development and expanding enhanced oil recovery programs.
- For instance, NXL Technologies provides a lightweight lubricator that reduces weight by up to 57% using high-strength stainless steel, with a maximum working pressure of 15,000 PSI for easier rigging in onshore and offshore wireline interventions.
By Price Range
The medium price range segment held a 47.2% share in 2024, dominating the Pressure Control Equipment Market due to its balanced mix of performance, durability, and cost-efficiency suited for both mid-scale and large operators. This segment benefits from growing adoption in mature fields where cost optimization is critical yet reliability cannot be compromised. The high-price range continues to expand with rising deployment of premium HPHT systems in deepwater and complex reservoirs, while the low-price segment retains relevance among smaller operators and low-intensity well operations seeking basic yet functional pressure control solutions.
Key Growth Drivers
Expanding Unconventional Oil & Gas Development
Rising investment in unconventional resources such as shale, tight oil, and coalbed methane significantly accelerates demand for pressure control equipment. Operators increasingly rely on high-performance valves, control heads, and pressure-containing systems to manage complex drilling environments and higher well pressures. Multi-stage hydraulic fracturing, frequent well interventions, and extended lateral drilling further strengthen equipment adoption. As exploration companies push into deeper, hotter, and geologically challenging formations, the need for advanced, reliable, and HPHT-ready pressure control solutions continues to drive sustained market expansion.
- For instance, SLB's Cameron systems provide complete wellbore pressure containment with large-bore blowout preventers rated over 20,000 psi, designed for deepwater shale drilling safety.
Growth in Offshore and Deepwater Exploration
Offshore and deepwater projects play a crucial role in boosting demand for pressure control equipment as these environments require robust systems capable of withstanding extreme pressures and harsh operating conditions. Increasing exploration activities in regions such as Latin America, the North Sea, and West Africa fuel the adoption of premium wellhead components and control systems. Rising investments in subsea infrastructure, coupled with heightened safety compliance requirements, reinforce the demand for technologically advanced equipment that ensures operational integrity during drilling, completion, and intervention phases.
- For instance, SLB's subsea safety systems enabled rapid disconnection from a gas well during deepwater testing off West Africa, unlatching without environmental incident or damage to landing string equipment via integrated pressure management.
Strengthening Regulatory and Safety Standards
Stricter global safety regulations and heightened industry emphasis on preventing blowouts and pressure-related failures directly promote the adoption of advanced pressure control technologies. Regulatory bodies mandate the use of certified high-strength components, regular equipment upgrades, and stringent operational monitoring. This drives operators to invest in modern pressure control systems with enhanced reliability and real-time diagnostic capabilities. As producers focus on minimizing downtime, improving workforce safety, and ensuring environmental protection, demand for standardized and compliant pressure control equipment continues to rise across diverse field operations.
Key Trends & Opportunities
Integration of Digital Monitoring and Automation
The market is experiencing a strong shift toward digitalization, with operators increasingly adopting IoT-enabled sensors, automated control heads, and data-driven pressure monitoring systems. These technologies provide real-time analytics, predictive maintenance, and remote operational control, improving wellsite efficiency and reducing manual intervention risks. Manufacturers offering integrated software–hardware systems gain significant advantages as operators pursue optimized asset performance. The rise of cloud-based monitoring and digital twin applications further creates opportunities for smarter, safer, and more cost-effective pressure management solutions across complex well environments.
- For instance, Saudi Aramco employs smart IoT corrosion sensors on pipelines that continuously monitor pressure and temperature to prevent failures and extend asset life.
Rising Demand for High-Pressure, High-Temperature (HPHT) Equipment
As drilling targets shift toward deeper and more challenging reservoirs, opportunities expand for HPHT-certified pressure control equipment. Operators increasingly require components capable of sustaining extreme pressure cycles, corrosion, and thermal stress, accelerating innovation in metallurgy, sealing technologies, and component design. Demand for premium-grade valves, wellhead flanges, and control systems strengthens as offshore and deepwater activity increases. Manufacturers focusing on material advancements and modular equipment designs are well-positioned to capture growth opportunities in emerging HPHT exploration and production zones worldwide.
- For instance, the Dril-Quip BigBore™ IIe Subsea Wellhead, designed for severe HPHT conditions, has been fatigue tested to over 90 million bending cycles with 2 million lbs hanger lockdown capacity, combining multiple tool functions to reduce operational trips.
Key Challenges
High Capital and Maintenance Costs
Pressure control equipment requires significant upfront investment and ongoing maintenance, posing a challenge for small and mid-sized operators. High-performance HPHT systems, advanced monitoring technologies, and premium-grade materials increase procurement expenses. Additionally, frequent servicing, certification requirements, and replacement of wear-prone components elevate lifecycle costs. These financial burdens can delay equipment upgrades and restrict adoption of advanced solutions. Cost sensitivity in low-margin fields further compounds the issue, pressuring manufacturers to develop cost-efficient yet reliable systems to support broader market penetration.
Operational Risks and Harsh Field Conditions
Pressure control systems operate in extremely demanding environments where high pressures, corrosive fluids, thermal fluctuations, and mechanical stress can compromise equipment durability and performance. Failures may lead to costly downtime, safety incidents, and environmental hazards. Maintaining operational reliability is particularly challenging in deepwater, HPHT, and aging wells where equipment fatigue increases. Operators must balance performance expectations with operational risk mitigation, creating ongoing challenges for manufacturers to engineer components that deliver high resilience, extended service life, and consistent performance under adverse field conditions.
Regional Analysis
North America
North America dominated the Pressure Control Equipment Market with a 38.6% share in 2024, supported by strong shale development, high well intervention frequency, and widespread adoption of advanced pressure control systems across the U.S. and Canada. Extensive investments in unconventional drilling, enhanced oil recovery programs, and deepwater projects in the Gulf of Mexico further strengthen regional demand. Strict safety regulations, rapid integration of digital monitoring tools, and strong presence of leading service providers reinforce market growth. Continuous upgrades to maintain well integrity and operational efficiency ensure sustained consumption of high-performance pressure control equipment.
Europe
Europe captured a 22.4% share in 2024, driven by sustained offshore exploration in the North Sea, Norway, and the U.K., along with ongoing investments in mature field redevelopment. The region emphasizes high safety compliance, pushing operators to adopt certified and technologically advanced pressure control systems. Increasing focus on extending the operational life of offshore assets and rising exploration in frontier basins support steady demand. Digitalization initiatives, including sensor-based pressure monitoring and predictive maintenance programs, further strengthen growth as energy companies seek to enhance operational reliability and reduce intervention-related downtime.
Asia-Pacific
Asia-Pacific accounted for a 26.9% share in 2024, driven by expanding drilling activities across China, India, Indonesia, and Australia. Rising energy demand, increasing domestic exploration, and growing offshore developments in Southeast Asia create strong market momentum. National oil companies continue to invest in deeper wells and complex reservoirs, driving demand for HPHT-capable pressure control equipment. Technological modernization, including automated monitoring tools and advanced wellhead systems, further accelerates adoption. Regional initiatives to boost local manufacturing and reduce reliance on imports contribute to long-term market growth across both onshore and offshore operations.
Latin America
Latin America held an 8.7% share in 2024, supported by expanding offshore projects in Brazil and Mexico and growing interest in unconventional resources across Argentina’s shale basins. Investment in deepwater and pre-salt fields drives the need for high-strength pressure control equipment capable of enduring extreme operational conditions. Regional energy reforms, improved foreign investment inflows, and modernization of drilling fleets contribute to higher adoption of advanced systems. As governments prioritize production increases and infrastructure upgrades, demand for reliable valves, control heads, and monitoring solutions continues to rise across major oil-producing nations.
Middle East & Africa
The Middle East & Africa region captured a 13.4% share in 2024, driven by large-scale production activities, continuous drilling programs, and significant investment in onshore and offshore fields across Saudi Arabia, UAE, Qatar, and Nigeria. High-pressure reservoirs and extensive well intervention requirements fuel demand for robust, durable pressure control equipment. National oil companies increasingly adopt technologically advanced systems to enhance safety and operational efficiency. Expansion of sour gas projects, deepwater exploration in Africa, and strategic modernization initiatives further support sustained market growth, reinforcing the region’s position as a major energy-producing hub.
Market Segmentations:
By Component
- Valves
- Control Head
- Wellhead Flange
- Others (Sensors, Gauges, Etc)
By Category
- Wireline Pressure Control Equipment
- Coiled Tubing Pressure Control Equipment
By Price Range
- Low
- Medium
- High
By End-Use
- Oil & Gas
- Chemicals
- Pulp & Paper
- Others (Marine, Construction, Etc)
By Distribution Channel
- Direct
- Indirect
By Geography
- North America
- U.S.
- Canada
- Mexico
- Europe
- Germany
- France
- U.K.
- Italy
- Spain
- Rest of Europe
- Asia Pacific
- China
- Japan
- India
- South Korea
- South-east Asia
- Rest of Asia Pacific
- Latin America
- Brazil
- Argentina
- Rest of Latin America
- Middle East & Africa
- GCC Countries
- South Africa
- Rest of the Middle East and Africa
Competitive Landscape
Competitive landscape in the Pressure Control Equipment Market is defined by the presence of major players such as Aker Solutions ASA, Baker Hughes Company, Cameron International Corporation, Curtiss-Wright Corporation, Dril-Quip, Inc., Emerson Electric Co., FMC Technologies, Inc., General Electric Company (GE Oil & Gas), Halliburton Company, and Honeywell International Inc. These companies focus on developing advanced HPHT-capable systems, automated pressure monitoring technologies, and durable components designed for complex offshore and unconventional drilling environments. Strategic initiatives include geographic expansion, product innovation, and long-term service agreements to strengthen customer loyalty and operational efficiency. Manufacturers also invest in digitalization, integrating IoT sensors, remote monitoring platforms, and predictive maintenance tools to offer greater safety and reliability. Partnerships with national oil companies, technology providers, and drilling contractors further enhance portfolio competitiveness. With rising regulatory pressure and a shift toward deeper exploration activities, leading companies continue to emphasize innovation, certification compliance, and performance-driven product upgrades.
Key Player Analysis
- Curtiss-Wright Corporation
- Halliburton Company
- Dril-Quip, Inc.
- General Electric Company (GE Oil & Gas)
- Emerson Electric Co.
- Honeywell International Inc.
- Baker Hughes Company
- Aker Solutions ASA
- Cameron International Corporation
- FMC Technologies, Inc.
Recent Developments
- In February 2025, Baker Hughes introduced a trio of electrification technologies aimed at improving reliability of onshore and offshore pressure control operations.
- In May 2025, Scout Surface Solutions acquired Kinetic Pressure Control Ltd, a Houston-based specialist in flow and pressure control, from SCF Ventures to expand its portfolio in oil & gas completions across North America and the Middle East.
- In August 2025, Force Pressure Control deployed its next-generation 11” 10K valve designed for extreme environments such as geothermal and CO₂-enhanced operations.
Report Coverage
The research report offers an in-depth analysis based on Component, Category, Price Range, End Use, Distribution Channel and Geography. It details leading market players, providing an overview of their business, product offerings, investments, revenue streams, and key applications. Additionally, the report includes insights into the competitive environment, SWOT analysis, current market trends, as well as the primary drivers and constraints. Furthermore, it discusses various factors that have driven market expansion in recent years. The report also explores market dynamics, regulatory scenarios, and technological advancements that are shaping the industry. It assesses the impact of external factors and global economic changes on market growth. Lastly, it provides strategic recommendations for new entrants and established companies to navigate the complexities of the market.
Future Outlook
- The market will experience steady growth as drilling activities expand across unconventional and deepwater fields.
- Adoption of HPHT-capable equipment will rise with increasing exploration in high-pressure reservoirs.
- Digital monitoring tools and IoT-enabled systems will become standard in pressure management operations.
- Automation and remote-control technologies will reduce manual intervention and enhance operational safety.
- Manufacturers will prioritize advanced materials and improved sealing technologies to boost equipment durability.
- Service-based models and long-term maintenance contracts will gain stronger adoption among operators.
- Offshore investments, particularly in Latin America, Africa, and Asia-Pacific, will support sustained equipment demand.
- Regulatory pressure will drive wider use of certified and safety-compliant pressure control systems.
- Integration of predictive maintenance platforms will help operators reduce downtime and lifecycle costs.
- Market consolidation may accelerate as leading companies pursue acquisitions to expand portfolios and technological capabilities.
Request a Free Sample
Fill in your details and we'll send you a free sample report.
- Sample data tables & charts
- Research methodology
Need a Custom Version of This Report?
Tailor the scope, geography, or segments to your exact requirements.
- Custom geography or segment scope
- Direct access to our analyst team
Frequently Asked Questions
What is the current market size for Pressure Control Equipment Market, and what is its projected size in 2032?
At what Compound Annual Growth Rate is the Pressure Control Equipment Market projected to grow between 2024 and 2032?
Which Pressure Control Equipment Market segment held the largest share in 2024?
What are the primary factors fueling the growth of the Pressure Control Equipment Market?
Who are the leading companies in the Pressure Control Equipment Market?
Which region commanded the largest share of the Pressure Control Equipment Market in 2024?
Table of Content
Chapter 1. Report Introduction
- 1.1 Report Description & Purpose
- 1.1.1 Report Title & Market Definition
- 1.1.2 Unique Selling Propositions (USP) & Key Differentiators
- 1.1.3 Value Proposition for Stakeholders
- 1.2 Research Objectives
- 1.2.1 Market Sizing Objectives (Volume & Revenue) (Volume Where Applicable)
- 1.2.2 Segmentation Objectives
- 1.2.3 Competitive Intelligence Objectives
- 1.2.4 Forecast & Scenario Objectives
- 1.3 Report Scope
- 1.3.1 Pressure Control Equipment Scope – Segments & Subsegments Covered
- 1.3.2 Geographic Scope – Regions & Countries Covered
- 1.3.3 Historical Period, Base Year & Forecast Period (2024; forecast to 2032)
- 1.3.4 Inclusions & Exclusions
- 1.4 Industry Classification & Applicable Codes
- 1.5 Currency, Measurement Units & Valuation Basis
- 1.6 Target Stakeholders
- 1.7 Limitations & Assumptions
Chapter 2. Executive Summary
- 2.1 Global Pressure Control Equipment Market Snapshot
- 2.1.1 Market Size – Historical (2024) & Forecast (2024-2032) (2024: USD 7,230 Million → 2032: USD 10,560.53 Million)
- 2.1.2 Volume & Revenue – Global Totals (Volume Where Applicable)
- 2.1.3 Key Market Highlights – Top Five Facts
- 2.2 Pressure Control Equipment Market Segmentation Snapshot
- 2.2.1 Market Split by Region – 2024 vs. 2032
- 2.3 Competitive Snapshot
- 2.3.1 Top 10 Players by Revenue Share – 2024
- 2.3.2 Top 10 Players by Volume Share – 2024 (Volume Where Applicable)
- 2.3.3 Recent Strategic Developments (18-Month Summary)
- 2.4 Key Investment Highlights & Strategic Conclusions
Chapter 3. Pressure Control Equipment Market Dynamics & Industry Analysis
- 3.1 Market Overview & Context
- 3.1.1 Pressure Control Equipment Market Position in the Broader Industry Value Chain
- 3.1.2 Demand Structure & Purchasing Dynamics
- 3.1.3 Market Maturity & Development Stage by Region
- 3.2 Pressure Control Equipment Market Drivers
- 3.3 Pressure Control Equipment Market Restraints & Challenges
- 3.4 Pressure Control Equipment Market Opportunities
- 3.5 Porter's Five Forces Analysis
- 3.5.1 Threat of New Entrants
- 3.5.2 Bargaining Power of Suppliers
- 3.5.3 Bargaining Power of Buyers
- 3.5.4 Threat of Substitutes
- 3.5.5 Competitive Rivalry – Intensity Assessment
- 3.6 Pressure Control Equipment Value Chain Analysis
- 3.6.1 Upstream – Key Inputs, Resources & Suppliers
- 3.6.1.1 Key Input/Resource 1
- 3.6.1.2 Key Input/Resource 2
- 3.6.1.3 Key Input/Resource 3
- 3.6.2 Midstream – Core Operations & Value Creation
- 3.6.2.1 Operating Model & Process Overview
- 3.6.2.2 Key Operating Locations & Capabilities by Company
- 3.6.3 Downstream – Market Channels & End Users
- 3.6.3.1 Direct Sales & Customer Engagement Channels
- 3.6.3.2 Indirect Sales, Intermediaries & Partner Channels
- 3.6.4 Value Chain Profitability Analysis
- 3.6.1 Upstream – Key Inputs, Resources & Suppliers
- 3.7 PESTEL Analysis
- 3.7.1 Political Factors
- 3.7.2 Economic Factors
- 3.7.3 Social Factors
- 3.7.4 Technological Factors
- 3.7.5 Environmental Factors
- 3.7.6 Legal Factors
- 3.8 Pressure Control Equipment Supply Chain Analysis
- 3.8.1 Critical Input & Resource Availability Risk Assessment
- 3.8.2 Supplier & Operational Concentration Risk (Geographic Exposure)
- 3.8.3 Supply & Service Disruption Impact Analysis
- 3.9 Regulatory & Policy Landscape
Note: The regulatory and policy landscape section covers regulations based on their applicability to the market, Pressure Control Equipment category, geography, and scope of the study. Only regulatory frameworks with a material impact on operations, compliance, trade, sustainability, or market access are analyzed in detail.
Chapter 4. Key Investment Pockets & Opportunity Analysis
- 4.1 Pressure Control Equipment Market Attractiveness Analysis
- 4.1.1 By Region – Investment Attractiveness Matrix (Market Size × CAGR)
- 4.2 Absolute Revenue Growth Opportunity
- 4.2.1 By Region – Absolute Revenue Growth Through 2032
- 4.3 Incremental Demand Opportunity
- 4.3.1 By Region – Incremental Demand Through 2032
- 4.3.2 Segment – Incremental Demand
- 4.4 Emerging Submarket Opportunity Deep Dive (Subject to Applicability)
- 4.5 Priority Market Opportunity Scorecards
- 4.5.1 United States
- 4.5.2 Europe
- 4.5.3 Asia
- 4.5.4 Middle East & Africa
Note: Priority market opportunity scorecards reflect the geographic scope and strategic relevance of the study. Listed markets are indicative and may be adapted to the industry.
Chapter 5. Pressure Control Equipment Cross-Border Trade & Market Access Analysis
- 5.1 International Trade & Cross-Border Activity Overview
- 5.1.1 Global Export Value by Country (2024)
- 5.1.2 Global Export Volume by Country (2024) (Volume Where Applicable)
- 5.1.3 Global Import Value by Country (2024)
- 5.1.4 Global Import Volume by Country (2024) (Volume Where Applicable)
- 5.1.5 Net Trade Balance by Country (2024)
- 5.2 Export Analysis – Segment
- 5.2.1 Category 1 (Applicable Classification Code)
- 5.2.2 Category 2 (Applicable Classification Code)
- 5.2.3 Category 3 (Applicable Classification Code)
- 5.2.4 Category 4 (Applicable Classification Code)
- 5.2.5 Category 5 (Applicable Classification Code)
- 5.3 Import Analysis – Segment
- 5.3.1 Category 1 (Applicable Classification Code)
- 5.3.2 Category 2 (Applicable Classification Code)
- 5.3.3 Category 3 (Applicable Classification Code)
- 5.3.4 Category 4 (Applicable Classification Code)
- 5.3.5 Category 5 (Applicable Classification Code)
- 5.4 Cross-Border Pricing & Transaction Benchmarks
- 5.4.1 Export Pricing – Segment & Country
- 5.4.2 Import Pricing – Segment & Source Country
- 5.4.3 Price Trends (2024)
- 5.5 Key Cross-Border Trade & Delivery Routes
- 5.5.1 Cross-Border Trade/Delivery Route 1
- 5.5.2 Cross-Border Trade/Delivery Route 2
- 5.5.3 Cross-Border Trade/Delivery Route 3
- 5.5.4 Cross-Border Trade/Delivery Route 4
- 5.5.5 Cross-Border Trade/Delivery Route 5
- 5.6 Trade Policy & Market Access Impact Assessment
- 5.6.1 Tariff & Non-Tariff Barriers
- 5.6.2 Regional Trade & Economic Integration Frameworks
- 5.6.3 Bilateral & Multilateral Trade Agreements
- 5.6.4 Cross-Border Operating, Licensing & Localization Requirements
Note: This chapter applies where cross-border trade or delivery is relevant to Pressure Control Equipment. Goods, services, and digital offerings are assessed using applicable classifications and transaction measures. Import-export volumes, trade balances, and route analyses are included only where meaningful to the market.
Chapter 6. Competitive Landscape & Company Benchmarking
- 6.1 Pressure Control Equipment Market Concentration & Structure
- 6.1.1 Herfindahl-Hirschman Index (HHI) – vs. 2024
- 6.1.2 Leading, Mid-Sized & Emerging Player Structure
- 6.1.3 Global, Regional & Local Player Dynamics
- 6.2 Pressure Control Equipment Market Share Analysis – 2024
- 6.2.1 Global Revenue Share by Company
- 6.2.2 Global Volume Share by Company (Volume Where Applicable)
- 6.2.3 Regional Revenue Share
- 6.2.4 Market Share Evolution ( vs. 2024)
- 6.2.5 Company Market Share by Key Segment
- 6.2.6 Company Market Share by Customer Group
- 6.3 Operating Scale, Capacity & Infrastructure Analysis
- 6.3.1 Global Operating Scale & Supply Capacity
- 6.3.2 Resource Utilization & Operating Efficiency
- 6.3.3 Output, Service Delivery & Activity Metrics
- 6.3.4 Operating Footprint & Infrastructure Map
- 6.3.5 Planned Operational & Capacity Expansion
- 6.4 Pressure Control Equipment Competitive Benchmarking Matrix
- 6.4.1 Revenue, Growth, Profitability & Operating Metric Comparison
- 6.4.2 Channel Revenue Mix
- 6.4.3 Geographic Revenue Exposure
- 6.4.4 R&D Intensity
- 6.4.5 Sustainability Maturity
- 6.5 Strategic Developments in Pressure Control Equipment (Last 24 Months)
- 6.5.1 Mergers, Acquisitions & Divestments
- 6.5.2 New Products, Services & Solutions in Pressure Control Equipment
- 6.5.3 Operational & Infrastructure Expansions
- 6.5.4 Strategic Alliances, Joint Ventures & Partnerships
- 6.5.5 Distribution Expansion & Market Entry
- 6.5.6 Sustainability & ESG Initiatives
- 6.6 Competitive Strategy Mapping
- 6.6.1 Leader, Challenger, Follower & Niche Classification
- 6.6.2 Pricing Strategy Comparison
- 6.6.3 Channel Strategy Matrix
Note: Strategic developments are included based on their materiality and the availability of reliable information.
Chapter 7. Global Pressure Control Equipment Market – By Sales & Delivery Channel
- 7.1 Segment Overview
- 7.1.1 Volume & Revenue Split by Channel (2024 & 2032) (Volume Where Applicable)
- 7.1.2 Channel Mix Evolution (2024-2032)
Chapter 8. Regional Market Analysis – Global Overview
- 8.1 Global Regional Overview
- 8.1.1 Regional Volume Share (Volume Where Applicable)
- 8.1.2 Regional Revenue Share
- 8.1.3 Regional Volume by Region (Volume Where Applicable)
- 8.1.4 Regional Revenue by Region
- 8.1.5 Regional Forecast Through 2032
- 8.2 Cross-Regional Segment Analysis
- 8.2.1 By Sales & Delivery Channel
- 8.2.2 By Competitive Positioning & Price Tier
Chapter 9. North America Pressure Control Equipment Market
- 9.1 United States
- 9.2 Canada
- 9.3 Mexico
Chapter 10. Europe Pressure Control Equipment Market
- 10.1 Germany
- 10.2 France
- 10.3 Italy
- 10.4 United Kingdom
- 10.5 Spain
- 10.6 Poland
- 10.7 Russia
- 10.8 Netherlands
- 10.9 Belgium
- 10.10 Sweden
- 10.11 Denmark
- 10.12 Norway
- 10.13 Rest of Europe
Chapter 11. Asia Pacific Pressure Control Equipment Market
- 11.1 China
- 11.2 India
- 11.3 Japan
- 11.4 South Korea
- 11.5 Thailand
- 11.6 Indonesia
- 11.7 Vietnam
- 11.8 Malaysia
- 11.9 Australia
- 11.10 Rest of Asia Pacific
Chapter 12. Latin America Pressure Control Equipment Market
- 12.1 Brazil
- 12.2 Argentina
- 12.3 Colombia
- 12.4 Chile
- 12.5 Rest of Latin America
Chapter 13. Middle East Pressure Control Equipment Market
- 13.1 Saudi Arabia
- 13.2 United Arab Emirates
- 13.3 Turkey
- 13.4 Israel
- 13.5 Iran
- 13.6 Rest of the Middle East
Chapter 14. Africa Pressure Control Equipment Market
- 14.1 South Africa
- 14.2 Egypt
- 14.3 Nigeria
- 14.4 Morocco
- 14.5 Rest of Africa
Chapter 15. Pressure Control Equipment Company Profiles
- 15.1 [Company 01]
- 15.1.1 Company Overview
- 15.1.2 Key Management Personnel
- 15.1.3 Products & Services Portfolio
- 15.1.4 Financial Performance
- 15.1.5 Key Market Focus & Geographic Presence
- 15.1.6 Recent Developments & Strategic Initiatives
Note: The company profile list is preliminary and may change based on research findings, market developments, data availability, and client requirements.
Chapter 16. Appendices
- Appendix A – List of Abbreviations & Acronyms
- Appendix B – Industry Classification Code Reference – Full Series
- Appendix C – Supply, Output & Operating Capacity Data Tables
- Appendix D – End-Use & Demand Base Tables
- Appendix E – Demand, Adoption & Usage Assumptions
- Appendix F – Pricing & Revenue Metric Reference Tables
- Appendix G – Company Operations & Infrastructure Database
- Appendix H – Cross-Border Trade & Activity Data Tables (Where Applicable)
- Appendix I – Regulatory Summary Tables
- Appendix J – Primary Research Participant List (Anonymized)
- Appendix K – Primary Research Questionnaire Framework
- Appendix L – Data Sources & Bibliography
- Appendix M – Market Size Divergence & Source Comparison
Chapter 17. Research Methodology
- 17.1 Research Framework & Philosophy
- 17.2 Secondary Research – Sources, Hierarchy & Data Extraction
- 17.3 Data Modeling – Bottom-Up & Top-Down Market Sizing
- 17.4 Primary Research – Stakeholder Framework, LOI & Sample Sizes
- 17.5 Forecast Methodology – Regression, Scenario & Sensitivity Analysis
- 17.6 Quality Control – Four-Layer Validation Framework
- 17.7 Limitations & Standard Assumptions
- 17.8 Disclaimer