
Market Overview:
The process spectroscopy market is projected to grow from USD 21.7 billion in 2024 to an estimated USD 49.0 billion by 2032, with a compound annual growth rate (CAGR) of 10.7% during 2024–2032.
| REPORT ATTRIBUTE | DETAILS |
|---|---|
| Historical Period | 2020-2023 |
| Base Year | 2024 |
| Forecast Period | 2025-2032 |
| Process Spectroscopy Market Size 2024 | USD 21.7 billion |
| Process Spectroscopy Market, CAGR | 10.7% |
| Process Spectroscopy Market Size 2032 | USD 49.0 billion |
The market is driven by rising demand for real-time analysis in manufacturing processes. Industries such as pharmaceuticals, food and beverages, chemicals, and oil and gas are using spectroscopy technologies to maintain product quality and reduce waste. Stricter regulatory requirements push companies to adopt advanced process monitoring systems, while innovations in spectroscopy techniques enhance accuracy and speed. Adoption is also growing in environmental monitoring and semiconductor manufacturing, where precision and compliance play vital roles in sustaining competitiveness.
North America leads the process spectroscopy market due to strong regulatory frameworks, advanced manufacturing practices, and high adoption in pharmaceuticals and biotechnology. Europe follows, supported by stringent quality standards in food safety and chemical industries. Asia Pacific is emerging as the fastest-growing region, with China, India, and Japan investing heavily in industrial automation, pharmaceutical manufacturing, and food processing. Latin America and the Middle East & Africa are also seeing steady adoption, driven by expanding industrial bases and increasing regulatory enforcement in key industries.
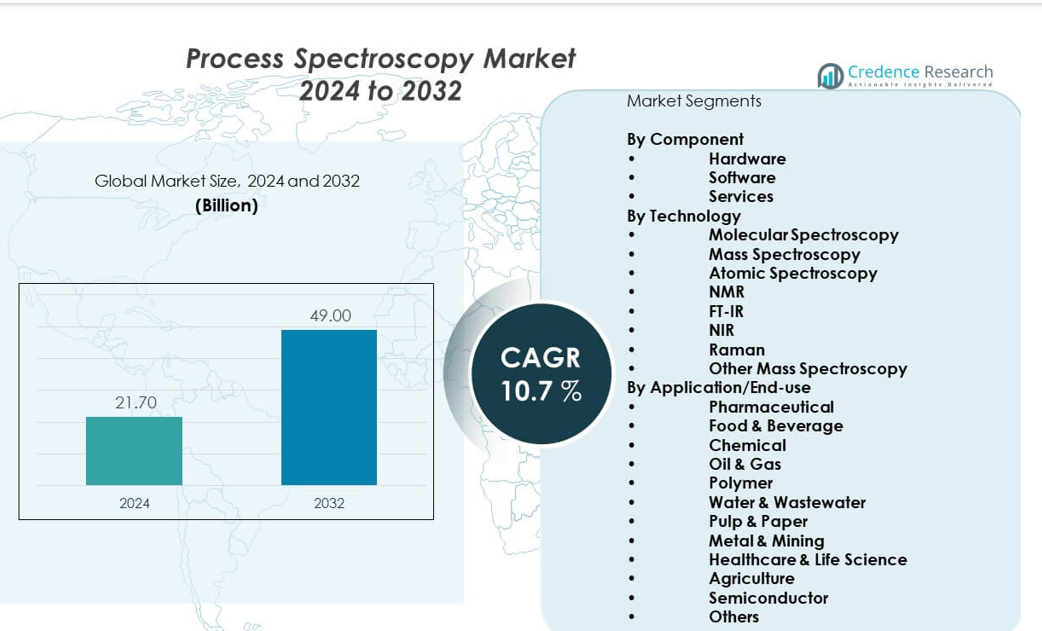
Market Insights:
- The process spectroscopy market is projected to grow from USD 21.7 billion in 2024 to USD 49.0 billion by 2032, registering a CAGR of 10.7% during the forecast period.
- Rising demand for real-time process monitoring in pharmaceuticals, chemicals, and food industries is driving adoption.
- Stringent regulatory requirements across global markets are pushing manufacturers to invest in accurate quality assurance systems.
- High implementation costs and integration complexities continue to restrain adoption, especially among small and mid-sized enterprises.
- Limited technical expertise and awareness in emerging regions also slow down deployment of advanced spectroscopy systems.
- North America leads the market, supported by strong regulatory frameworks and adoption in healthcare and biotechnology sectors.
- Asia Pacific is witnessing the fastest growth, driven by rapid industrialization, expanding pharmaceutical production, and growing investments in automation.
Market Drivers:
Growing Emphasis on Quality Assurance and Regulatory Compliance:
The process spectroscopy market is growing as industries tighten their focus on quality and compliance. Food, chemical, and pharmaceutical manufacturers adopt spectroscopy systems to meet strict international standards. Regulatory bodies worldwide enforce detailed product safety measures, pushing companies to invest in real-time monitoring. Spectroscopy enables early detection of impurities, which minimizes costly recalls. Businesses integrate it into production workflows to maintain consistency and improve brand reliability. Predictive monitoring tools also cut waste and support operational efficiency. It strengthens the ability of companies to meet evolving consumer expectations. The demand for accurate, transparent processes drives strong adoption of spectroscopy technologies.
- For instance, AGC Biologics implemented mid-infrared spectroscopy in their downstream processing to track protein and excipient levels with an accuracy margin within 5%, significantly enhancing real-time quality assurances.
Expansion of Healthcare, Biotechnology, and Pharmaceutical Applications:
Pharmaceutical and biotechnology industries continue to accelerate demand for advanced analytical tools. The process spectroscopy market benefits as drug makers require precise validation of active ingredients. Regulatory agencies mandate monitoring systems to ensure compliance with drug safety rules. Spectroscopy enables inline process verification, which supports continuous production in pharmaceuticals. Companies depend on it for faster drug approvals by improving testing accuracy. Biotechnology firms apply spectroscopy to cell analysis, protein validation, and lab-scale innovations. It provides real-time results that shorten discovery cycles and strengthen reliability. Rising global investments in healthcare manufacturing reinforce the technology’s critical role in these sectors.
- For instance, Sartorius AG expanded its cell technology offerings by acquiring MatTek Corp, adding precise 3D human cell-based models that facilitate safer drug testing and accelerate pharmaceutical innovation.
Rising Adoption in Environmental and Energy Monitoring:
Environmental and energy sectors increasingly apply spectroscopy systems for compliance and safety. The process spectroscopy market benefits from monitoring of pollutants, emissions, and natural resources. Governments enforce stricter environmental laws, encouraging companies to adopt advanced testing solutions. Spectroscopy provides non-destructive methods to analyze water, air, and soil quality. Power, oil, and gas industries integrate these tools for process safety and emissions control. Adoption is growing as organizations face penalties for failing to meet sustainability standards. Real-time results reduce delays in addressing environmental risks. Expanding green initiatives worldwide make spectroscopy an essential part of industrial monitoring.
Technological Advancements Enhancing Accuracy and Efficiency:
Technological progress is reshaping how spectroscopy supports industries. The process spectroscopy market gains momentum from AI, IoT, and machine learning integration. These technologies deliver faster and more accurate real-time monitoring. Portable and miniaturized devices expand accessibility for mid-sized and small enterprises. Automation improves workflow efficiency and reduces reliance on manual testing. Predictive maintenance reduces downtime and improves equipment utilization. Manufacturers use advanced spectroscopy to align with digital transformation goals. Innovation ensures spectroscopy remains a core technology in industrial ecosystems.
Market Trends:
Integration of Artificial Intelligence and Predictive Analytics:
Artificial intelligence is redefining spectroscopy applications. The process spectroscopy market benefits as AI enhances data interpretation speed and accuracy. Predictive analytics allows companies to forecast performance issues before they escalate. Machine learning models improve anomaly detection in complex processes. Manufacturers rely on AI to increase productivity and reduce system failures. Real-time data analysis supports faster decision-making in critical production settings. Companies using AI-enabled spectroscopy gain a competitive edge in efficiency. This trend positions spectroscopy as a vital part of smart manufacturing ecosystems.
- For instance, Danaher Corporation's partnership with AstraZeneca leverages AI-powered diagnostics to enhance predictive analytics in precision medicine, improving diagnostics turnaround times and accuracy.
Growing Demand for Portable and Handheld Spectroscopy Devices:
Portable systems are transforming accessibility of spectroscopy solutions. The process spectroscopy market sees rising demand for handheld devices across agriculture, mining, and food safety. Operators perform field tests instantly without sending samples to central labs. Compact systems reduce testing costs and increase operational speed. Smaller firms adopt these tools to perform on-site checks efficiently. Remote industries rely on portable spectroscopy for quick decision-making. Researchers benefit from the flexibility offered by compact designs. This shift supports broader use and decentralization of spectroscopy applications.
- For instance, the National Physical Laboratory demonstrated successful in-line measurements of graphene nanoplatelets using a portable Raman spectrometer, showing adaptability of compact devices for industrial production settings with instant quality control feedback.
Expanding Role in Semiconductor and Electronics Manufacturing:
Electronics and semiconductor industries are adopting spectroscopy for production monitoring. The process spectroscopy market benefits from strict tolerance requirements in advanced components. Fabricators rely on it to detect impurities and improve yield rates. Spectroscopy supports faster defect identification, reducing costly production delays. It ensures compliance with rigorous material standards during chip development. Real-time monitoring helps maintain reliability in complex assembly processes. Growth in consumer electronics fuels adoption across the value chain. The industry’s focus on precision strengthens spectroscopy’s importance in manufacturing.
Collaboration Between Industry and Research Institutions Driving Innovation:
Partnerships between companies and research institutions are advancing spectroscopy applications. The process spectroscopy market benefits from co-developed solutions for specialized industries. Universities contribute to method development, enhancing accuracy and precision. Collaborative programs expand spectroscopy use in food safety and biopharma sectors. Funding from government initiatives accelerates pilot projects and commercialization. Companies test solutions in real-world environments before scaling production. These collaborations foster innovation and knowledge sharing globally. The trend creates pathways for more industry-specific spectroscopy solutions.
Market Challenges:
High Costs and Complex Integration Limiting Adoption:
Cost remains a significant barrier to adoption. The process spectroscopy market faces challenges as smaller firms struggle with high investment requirements. Advanced systems demand large upfront spending, limiting access for mid-scale companies. Integration with existing production systems increases complexity and cost. Staff training and maintenance add to ongoing expenses. Smaller markets often delay adoption due to budget constraints. Companies face reduced return on investment when implementation is slow. These factors limit adoption pace, especially in cost-sensitive industries.
Limited Technical Expertise and Awareness in Emerging Markets:
Technical expertise gaps hinder widespread adoption. The process spectroscopy market requires skilled professionals for accurate operation. Many firms lack training programs to handle advanced data interpretation. Misinterpretation of results can reduce reliability and raise compliance risks. Awareness in emerging regions remains limited, slowing adoption rates. Smaller enterprises often avoid investment due to workforce limitations. Companies face challenges aligning spectroscopy systems to specific production needs. Addressing these knowledge barriers is vital for expanding global use.
Market Opportunities:
Integration with Industrial Automation and Smart Manufacturing Systems:
Automation is creating strong growth opportunities for spectroscopy. The process spectroscopy market aligns with Industry 4.0 adoption. Integration with smart factories enables real-time monitoring and predictive maintenance. Automated platforms improve efficiency and consistency across production cycles. Robotics and AI expand the role of spectroscopy in connected ecosystems. It also supports companies in reducing downtime and operating costs. Manufacturers increasingly view spectroscopy as vital for digital transformation. Growth in automation secures long-term opportunities for the market.
Emerging Applications in Food Safety, Agriculture, and Environmental Monitoring:
New opportunities are arising in non-traditional industries. The process spectroscopy market benefits from adoption in agriculture, food safety, and environmental monitoring. Food companies rely on it to detect adulteration and ensure authenticity. Farmers use spectroscopy for soil testing, crop analysis, and nutrient optimization. Environmental agencies deploy it for air, water, and soil safety assessment. Demand is expanding as sustainability becomes a global priority. Adoption in these sectors opens additional revenue streams for companies. Widening applications continue to diversify and strengthen market potential.
Market Segmentation Analysis:
By Component
The process spectroscopy market is segmented into hardware, software, and services. Hardware holds the largest share, driven by demand for advanced instruments and sensors in quality monitoring. Software is expanding as industries adopt AI, data analytics, and predictive modeling for faster and more accurate insights. Services are growing steadily, supported by calibration, maintenance, and customization needs. Together, these segments highlight the balance between physical systems, digital tools, and technical support in driving adoption.
- For instance, ACHB enhanced atomic absorption spectroscopy by improving production efficiency by 20%, reducing lead times from 6 months to 3-4 months through sustained service support and quality control systems.
By Technology
Molecular spectroscopy dominates the market due to its broad application in pharmaceutical and chemical industries. Mass spectroscopy and atomic spectroscopy are essential in material testing, environmental monitoring, and advanced research. NMR, FT-IR, NIR, and Raman spectroscopy are witnessing rapid growth with applications in real-time detection and non-destructive testing. Other mass spectroscopy techniques continue to expand in specialized industrial and scientific uses. The wide range of technologies demonstrates the versatility of spectroscopy across industries.
- For instance, Shimadzu Corporation launched advanced triple quadrupole mass spectrometers in early 2025, enhancing analytical precision for pharmaceutical research and environmental applications.
By Application/End-use
The process spectroscopy market finds its largest application in pharmaceuticals, where it supports drug development, quality assurance, and compliance. Food and beverage industries use spectroscopy for contamination detection and authenticity testing. Chemicals, oil and gas, polymers, and water and wastewater sectors rely on it for process efficiency and regulatory adherence. Pulp and paper, metals and mining, agriculture, and semiconductors represent emerging growth areas with rising emphasis on precision and cost control. Healthcare and life sciences also expand usage in diagnostics and research, strengthening spectroscopy’s presence across critical applications.
Segmentation:
By Component
- Hardware
- Software
- Services
By Technology
- Molecular Spectroscopy
- Mass Spectroscopy
- Atomic Spectroscopy
- NMR
- FT-IR
- NIR
- Raman
- Other Mass Spectroscopy
By Application/End-use
- Pharmaceutical
- Food & Beverage
- Chemical
- Oil & Gas
- Polymer
- Water & Wastewater
- Pulp & Paper
- Metal & Mining
- Healthcare & Life Science
- Agriculture
- Semiconductor
- Others
By Geography
- North America
- U.S.
- Canada
- Mexico
- Europe
- Germany
- France
- U.K.
- Italy
- Spain
- Rest of Europe
- Asia Pacific
- China
- Japan
- India
- South Korea
- South-east Asia
- Rest of Asia Pacific
- Latin America
- Brazil
- Argentina
- Rest of Latin America
- Middle East & Africa
- GCC Countries
- South Africa
- Rest of the Middle East and Africa
Regional Analysis:
North America and Europe Leading the Market
North America dominates the process spectroscopy market with a share of around 35%. Strong regulatory frameworks in pharmaceuticals, biotechnology, and food safety drive widespread adoption. Companies in the United States and Canada invest heavily in advanced analytical technologies to meet strict compliance standards. The presence of major industry players strengthens the region’s leadership. Europe follows closely, holding nearly 28% of the market share. Stringent EU regulations on product quality and environmental monitoring support consistent growth. It benefits from a well-established industrial base in chemicals, healthcare, and food production.
Rapid Expansion in Asia Pacific
Asia Pacific represents the fastest-growing region, accounting for nearly 25% of the process spectroscopy market. Strong industrial growth in China, India, and Japan drives adoption across pharmaceuticals, food processing, and electronics manufacturing. Rapid urbanization and expansion of healthcare infrastructure contribute to higher demand for spectroscopy systems. Governments in the region support technological adoption through favorable initiatives and stricter quality regulations. Local manufacturers increasingly integrate spectroscopy solutions to compete globally. It strengthens the region’s role as a growth hub and creates opportunities for international market participants.
Emerging Growth in Latin America and Middle East & Africa
Latin America captures nearly 7% of the process spectroscopy market, led by Brazil and Mexico. Growing investment in food safety, oil and gas, and pharmaceutical production supports gradual adoption. The Middle East & Africa hold around 5% share, with rising opportunities in petrochemicals and environmental monitoring. Both regions face challenges related to high costs and limited expertise, but adoption is increasing steadily. Global players are targeting these areas with cost-effective and portable spectroscopy solutions. It reflects a shift toward broader accessibility and expanding industrial applications worldwide.
Key Player Analysis:
- Thermo Fisher Scientific Inc.
- Agilent Technologies, Inc.
- Bruker Corporation
- ABB Ltd.
- Shimadzu Corporation
- Sartorius AG
- Danaher Corporation
- HORIBA, Ltd.
- PerkinElmer, Inc.
- Yokogawa Electric Corporation
- BUCHI Labortechnik AG
- Endress+Hauser Group Services AG
- Kett Electric Laboratory
- Jasco International Co., Ltd.
Competitive Analysis:
The process spectroscopy market is highly competitive with global players focusing on innovation, partnerships, and portfolio expansion. Leading companies such as Thermo Fisher Scientific, Agilent Technologies, Bruker Corporation, and ABB invest in R&D to strengthen technological capabilities. It is shaped by continuous product enhancements, integration of AI and IoT, and expansion into new end-use industries. Companies compete on precision, cost efficiency, and compliance with international quality standards. Regional players emphasize niche applications and affordable solutions to gain market presence. Large firms dominate high-value segments, while smaller firms capture growth in specialized areas. Strong distribution networks and strategic acquisitions continue to define market positioning.
Recent Developments:
- In Thermo Fisher Scientific Inc., the company unveiled two new mass spectrometers, the Orbitrap Astral Zoom and Orbitrap Excedion Pro, at ASMS 2025 in June. These instruments aim to advance proteomics, biopharmaceutical development, and complex disease research with enhanced analytical performance and speed.
- In Agilent Technologies, a notable partnership was expanded in August 2023 with Element Biosciences in the United States. This strengthens collaboration on genome sequencing and analysis products, promoting co-marketing and training efforts to enhance user reach and value.
- ABB Ltd. showcased its new OmniCore controller and launched three new robot families in 2025, designed to enhance automation capabilities across industries. The OmniCore platform delivers faster, more precise, and autonomous robotic controls.
- Shimadzu Corporation introduced multiple new analytical products during Pittcon 2025 in March, including compact gas chromatography systems, several UV-Vis spectrophotometers, and a new line of triple quadrupole mass spectrometers, marking its 150th anniversary with these innovations.
- Sartorius AG completed the acquisition of MatTek Corp on July 1, 2025, expanding its cell technology portfolio for drug development. MatTek specializes in human cell-based microtissues and 3D models, promoting safer and cost-effective drug testing.
Market Concentration & Characteristics:
The process spectroscopy market is moderately concentrated, with leading multinational corporations holding significant shares alongside specialized regional firms. It is characterized by high R&D intensity, strong regulatory influence, and widespread demand across industries such as pharmaceuticals, food, and chemicals. Companies leverage product diversification and digital integration to sustain competitiveness. Services such as calibration, maintenance, and software upgrades also play a critical role in long-term growth. Continuous innovation and compliance-driven adoption define the market’s competitive dynamics.
Report Coverage:
The research report offers an in-depth analysis based on component, technology, application, and geography. It details leading market players, providing an overview of their business, product offerings, investments, revenue streams, and key applications. Additionally, the report includes insights into the competitive environment, SWOT analysis, current market trends, as well as the primary drivers and constraints. Furthermore, it discusses various factors that have driven market expansion in recent years. The report also explores market dynamics, regulatory scenarios, and technological advancements that are shaping the industry. It assesses the impact of external factors and global economic changes on market growth. Lastly, it provides strategic recommendations for new entrants and established companies to navigate the complexities of the market.
Future Outlook:
- Integration of AI and predictive analytics into spectroscopy systems will expand adoption.
- Portable and handheld devices will see stronger demand across field-based industries.
- Pharmaceutical applications will continue to dominate due to compliance and drug development needs.
- Environmental monitoring will grow as global sustainability regulations tighten.
- Adoption in semiconductor manufacturing will accelerate with precision-focused demand.
- Digital transformation and smart factory initiatives will expand industrial use.
- Emerging markets will experience stronger uptake driven by healthcare and food sectors.
- Strategic partnerships between companies and research institutions will fuel innovation.
- Services including calibration and customization will play a greater role in growth.
- Continued R&D investment will drive product diversification and advanced features.

Request a Free Sample
Fill in your details and we'll send you a free sample report.
- Sample data tables & charts
- Research methodology
Market Dynamics
Emphasis on Quality Assurance and Regulatory Compliance
Stricter international standards in pharmaceuticals, food, and chemicals are compelling manufacturers to adopt process spectroscopy for real-time quality monitoring and compliance, reducing recalls and ensuring product consistency.
Expansion of Healthcare, Biotechnology, and Pharmaceutical Applications
The need for precise validation of active ingredients and compliance with drug safety regulations is driving adoption of advanced spectroscopy systems in pharmaceutical and biotechnology manufacturing, supporting faster drug approvals and innovation.
Technological Advancements in Spectroscopy
Integration of AI, IoT, and machine learning is enhancing the accuracy, speed, and accessibility of spectroscopy systems, making them more attractive for both large enterprises and smaller firms seeking digital transformation.
Rising Adoption in Environmental and Energy Monitoring
Stricter environmental regulations and the need for non-destructive, real-time analysis of pollutants and emissions are increasing the use of spectroscopy in environmental monitoring and energy sectors, supporting sustainability and compliance.
Integration with Industrial Automation and Smart Manufacturing
The shift toward Industry 4.0 and smart factories is driving demand for spectroscopy systems that can be seamlessly integrated into automated production lines, enabling predictive maintenance and real-time process optimization.
Need a Custom Version of This Report?
Tailor the scope, geography, or segments to your exact requirements.
- Custom geography or segment scope
- Direct access to our analyst team
Frequently Asked Questions
What is the current market size for the Process Spectroscopy Market, and what is its projected size in 2032
At what Compound Annual Growth Rate is the Process Spectroscopy Market projected to grow between 2025 and 2032?
What are the primary factors fueling the growth of the Process Spectroscopy Market?
Who are the leading companies in the Process Spectroscopy Market?
Table of Content
Chapter 1 Market Segmentation
- 1.1 Segmentation Framework
- 1.1.1 Product and Service Classification
- 1.1.2 Application and End-Use Classification
- 1.1.3 Technology and Solution Classification
- 1.1.4 Customer and Distribution Channel Classification
- 1.1.5 Geographic Segmentation
- 1.1.6 Market Segment Definitions and Boundaries
- 1.2 By Component
- 1.2.1 Hardware
- 1.2.2 Software
- 1.2.3 Services
- 1.3 By Technology
- 1.3.1 Molecular Spectroscopy
- 1.3.2 Mass Spectroscopy
- 1.3.3 Atomic Spectroscopy
- 1.3.4 NMR
- 1.3.5 FT-IR
- 1.3.6 NIR
- 1.3.7 Raman
- 1.3.8 Other Mass Spectroscopy
- 1.4 By Application/End-use
- 1.4.1 Pharmaceutical
- 1.4.2 Food & Beverage
- 1.4.3 Chemical
- 1.4.4 Oil & Gas
- 1.4.5 Polymer
- 1.4.6 Water & Wastewater
- 1.4.7 Pulp & Paper
- 1.4.8 Metal & Mining
- 1.4.9 Healthcare & Life Science
- 1.4.10 Agriculture
- 1.4.11 Semiconductor
- 1.4.12 Others
Chapter 2 Introduction
- 2.1 Report Objectives and Scope
- 2.2 Product Definition and Industry Terminology
- 2.3 Market Inclusions and Exclusions
- 2.4 Research Process
- 2.4.1 Primary Research and Expert Interviews
- 2.4.2 Secondary Research and Source Review
- 2.4.3 Top-Down and Bottom-Up Estimation
- 2.4.4 Data Triangulation and Verification
- 2.5 Market Size Measurement Basis
- 2.5.1 2024: USD 21.7 billion → 2032: USD 49.0 billion
- 2.6 Historical and Forecast Reference Periods
- 2.6.1 Base Year: 2024
- 2.6.2 Forecast Period: 2024-2032
- 2.7 Research Assumptions and Limitations
Chapter 3 Executive Summary
- 3.1 Market Snapshot and Key Findings
- 3.2 Base-Year Market Size, 2024
- 3.3 Forecast Market Size, 2032
- 3.4 Revenue and Volume Growth Outlook
- 3.5 Key Demand and Supply Indicators
- 3.6 Leading Market Segments
- 3.7 Fastest-Growing Market Opportunities
- 3.8 Regional Performance Highlights
- 3.9 Technology and Industry Transformation
- 3.10 Competitive Landscape Summary
- 3.11 Analyst View and Strategic Implications
Chapter 4 Global Process Spectroscopy Market Trends and Developments
- 4.1 Historical Industry Development
- 4.2 Recent Market Trends and Developments
- 4.3 Demand and Customer Behavior Trends
- 4.4 Technology and Product Innovation
- 4.5 Artificial Intelligence, Automation and Digitalization
- 4.6 Local Manufacturing and Supply Chain Realignment
- 4.7 Industry Partnerships, Mergers and Acquisitions
- 4.8 Sustainability and Circular Economy Developments
- 4.9 Government and Private Sector Investment Trends
- 4.10 Emerging Business Models and Commercialization
- 4.11 Industry Developments and Announcements
Chapter 5 Global Process Spectroscopy Market Production, Supply and Demand Analysis
- 5.1 Demand Trend and Consumption Analysis
- 5.2 Demand Forecast, 2024-2032
- 5.3 Production and Output Trend
- 5.4 Production and Output Forecast, 2024-2032
- 5.5 Installed Capacity and Capacity Utilization
- 5.6 Company-Wise Production Plants and Statistics
- 5.6.1 Installed Production Capacity
- 5.6.2 Actual Production
- 5.6.3 Planned Capacity and Expansion Targets
- 5.7 Supply Chain Structure and Procurement Trends
- 5.8 Supply-Demand Gap and Bottlenecks
- 5.9 Import Dependence and Sourcing Structure
- 5.10 Contract Manufacturing and Outsourcing
- 5.11 Regional Supply and Demand Concentration
Chapter 6 Global Process Spectroscopy Market Pricing Analysis
- 6.1 Pricing Structure and Measurement
- 6.2 Historical Pricing Trends
- 6.3 Pricing Outlook, 2024-2032
- 6.4 Average Selling Price and Unit Economics
- 6.5 Pricing by Product and Market Segment
- 6.6 Geographic Pricing Differences
- 6.7 Key Input, Energy, Labor and Logistics Costs
- 6.8 Contract Pricing and Purchasing Models
- 6.9 Pricing Sensitivity and Competitive Positioning
- 6.10 Price, Margin and Profitability Implications
Chapter 7 Global Process Spectroscopy Market Dynamics
- 7.1 Market Growth Drivers
- 7.1.1 Demand-Side Drivers
- 7.1.2 Technology and Innovation Drivers
- 7.1.3 Infrastructure and Investment Drivers
- 7.1.4 Regulatory and Policy Drivers
- 7.2 Market Restraints
- 7.2.1 Cost and Affordability Constraints
- 7.2.2 Technology and Adoption Barriers
- 7.2.3 Supply Chain and Operational Constraints
- 7.3 Market Challenges
- 7.3.1 Competitive Pressure and Margin Erosion
- 7.3.2 Skills, Infrastructure and Implementation Gaps
- 7.4 Emerging Market Opportunities
- 7.5 Market Dynamics Impact and Time-Horizon Assessment
Chapter 8 Global Process Spectroscopy Value Chain Analysis
- 8.1 Industry Value Chain Overview
- 8.2 Upstream Suppliers and Critical Inputs
- 8.3 Technology and Component Providers
- 8.4 Manufacturing or Service Delivery
- 8.5 Distribution, Channel Partners and Integrators
- 8.6 Downstream Applications and End Users
- 8.7 Value Addition and Profit Pools
- 8.8 Vertical Integration and Outsourcing
- 8.9 Supplier Concentration and Risk
- 8.10 Supply Chain Localization and Resilience
Chapter 9 Global Process Spectroscopy Market Regulations and Policies
- 9.1 Relevant Laws, Standards and Compliance Frameworks
- 9.2 Product, Service, Safety and Quality Requirements
- 9.3 Government Policies, Incentives and Subsidies
- 9.4 Imports, Exports and Trade Barriers
- 9.5 Public Procurement and Local Content Requirements
- 9.6 Environmental and Sustainability Compliance
- 9.7 Upcoming Policy Changes and Market Implications
Chapter 10 Global Process Spectroscopy Market Hotspots and Opportunities
- 10.1 Market Opportunity Mapping and Growth Hotspots
- 10.2 High-Growth Applications and Customer Groups
- 10.3 Underserved Markets and White-Space Opportunities
- 10.4 Emerging Technology and Product Opportunities
- 10.5 New Capacity and Investment Hotspots
- 10.6 Market Entry and Expansion Opportunities
- 10.7 Distribution and Partnership Opportunities
- 10.8 Near-Term and Long-Term Commercial Potential
- 10.9 Opportunity Attractiveness and Execution Risks
Chapter 11 Global Process Spectroscopy Market Outlook, 2024-2032
- 11.1 Market Size and Analysis
- 11.1.1 Revenue (Market Measurement: 2024: USD 21.7 billion → 2032: USD 49.0 billion)
- 11.1.2 Market Volume and Quantity Sold
- 11.1.3 Historical Market Size
- 11.1.4 Base-Year Market Size, 2024
- 11.2 Market Forecast, 2024-2032
- 11.2.1 Revenue Forecast to 2032
- 11.2.2 Volume Forecast to 2032
- 11.2.3 CAGR and Year-on-Year Growth
- 11.2.4 Incremental Revenue Opportunity
- 11.3 Forecast Assumptions and Scenario Analysis
- 11.3.1 Base-Case Forecast
- 11.3.2 Optimistic and Conservative Scenarios
- 11.3.3 Technology, Pricing and Policy Sensitivities
- 11.4 Market Attractiveness and Growth Outlook
Chapter 12 Global Process Spectroscopy Market Segmentation and Outlook
- 12.1 Segmentation Summary and Market Shares, 2024
- 12.2 Largest and Fastest-Growing Segments
- 12.3 By Component - Market Size and Forecast, 2024-2032
- 12.3.1 Segment Definition and Scope
- 12.3.2 Historical Market Size
- 12.3.3 Revenue Forecast, 2024-2032
- 12.3.4 Volume Forecast, 2024-2032
- 12.3.5 Base-Year Market Share, 2024
- 12.3.6 Segment CAGR and Growth Drivers
- 12.3.7 Subsegment Market Size and Forecast
- 12.3.7.1 Hardware
- 12.3.7.2 Software
- 12.3.7.3 Services
- 12.3.8 Subsegment Pricing and Adoption Trends
- 12.3.9 Leading Suppliers and Competition
- 12.3.10 Regional Demand and Opportunities
- 12.4 By Technology - Market Size and Forecast, 2024-2032
- 12.4.1 Segment Definition and Scope
- 12.4.2 Historical Market Size
- 12.4.3 Revenue Forecast, 2024-2032
- 12.4.4 Volume Forecast, 2024-2032
- 12.4.5 Base-Year Market Share, 2024
- 12.4.6 Segment CAGR and Growth Drivers
- 12.4.7 Subsegment Market Size and Forecast
- 12.4.7.1 Molecular Spectroscopy
- 12.4.7.2 Mass Spectroscopy
- 12.4.7.3 Atomic Spectroscopy
- 12.4.7.4 NMR
- 12.4.7.5 FT-IR
- 12.4.7.6 NIR
- 12.4.7.7 Raman
- 12.4.7.8 Other Mass Spectroscopy
- 12.4.8 Subsegment Pricing and Adoption Trends
- 12.4.9 Leading Suppliers and Competition
- 12.4.10 Regional Demand and Opportunities
- 12.5 By Application/End-use - Market Size and Forecast, 2024-2032
- 12.5.1 Segment Definition and Scope
- 12.5.2 Historical Market Size
- 12.5.3 Revenue Forecast, 2024-2032
- 12.5.4 Volume Forecast, 2024-2032
- 12.5.5 Base-Year Market Share, 2024
- 12.5.6 Segment CAGR and Growth Drivers
- 12.5.7 Subsegment Market Size and Forecast
- 12.5.7.1 Pharmaceutical
- 12.5.7.2 Food & Beverage
- 12.5.7.3 Chemical
- 12.5.7.4 Oil & Gas
- 12.5.7.5 Polymer
- 12.5.7.6 Water & Wastewater
- 12.5.7.7 Pulp & Paper
- 12.5.7.8 Metal & Mining
- 12.5.7.9 Healthcare & Life Science
- 12.5.7.10 Agriculture
- 12.5.7.11 Semiconductor
- 12.5.7.12 Others
- 12.5.8 Subsegment Pricing and Adoption Trends
- 12.5.9 Leading Suppliers and Competition
- 12.5.10 Regional Demand and Opportunities
- 12.6 Segment Growth Comparison
- 12.7 Segment Attractiveness and Priority Matrix
Chapter 13 Global Process Spectroscopy End-Use and Application Market Outlook
- 13.1 End-Use Industry and Customer Demand Structure
- 13.2 Leading Applications and Customer Groups
- 13.3 End-Use Market Size, Share and Forecast
- 13.4 Major End-Use Industry Deep Dives
- 13.4.1 Customer Requirements and Use Cases
- 13.4.2 Demand and Replacement Cycles
- 13.4.3 Technical and Regulatory Considerations
- 13.4.4 Purchasing and Procurement Models
- 13.4.5 Leading Vendors and Distribution Channels
- 13.4.6 Forecast and Commercial Opportunities
- 13.5 Emerging Applications and Cross-Segment Demand
- 13.6 End-Use Industry Investment Priorities
Chapter 14 Global Process Spectroscopy Geographic Market Outlook, 2024-2032
- 14.1 Regional Market Size and Share, 2024
- 14.2 Regional Market Forecast, 2024-2032
- 14.3 Regional Pricing, Production and Demand Differences
- 14.4 North America
- 14.4.1 United States
- 14.4.2 Canada
- 14.4.3 Mexico
- 14.5 Europe
- 14.5.1 Germany
- 14.5.2 France
- 14.5.3 Italy
- 14.5.4 United Kingdom
- 14.5.5 Spain
- 14.5.6 Poland
- 14.5.7 Russia
- 14.5.8 Netherlands
- 14.5.9 Belgium
- 14.5.10 Sweden
- 14.5.11 Denmark
- 14.5.12 Norway
- 14.5.13 Rest of Europe
- 14.6 Asia Pacific
- 14.6.1 China
- 14.6.2 India
- 14.6.3 Japan
- 14.6.4 South Korea
- 14.6.5 Thailand
- 14.6.6 Indonesia
- 14.6.7 Vietnam
- 14.6.8 Malaysia
- 14.6.9 Australia
- 14.6.10 Rest of Asia Pacific
- 14.7 Latin America
- 14.7.1 Brazil
- 14.7.2 Argentina
- 14.7.3 Colombia
- 14.7.4 Chile
- 14.7.5 Rest of Latin America
- 14.8 Middle East
- 14.8.1 Saudi Arabia
- 14.8.2 United Arab Emirates
- 14.8.3 Turkey
- 14.8.4 Israel
- 14.8.5 Iran
- 14.8.6 Rest of the Middle East
- 14.9 Africa
- 14.9.1 South Africa
- 14.9.2 Egypt
- 14.9.3 Nigeria
- 14.9.4 Morocco
- 14.9.5 Rest of Africa
- 14.10 Regional Investment, Policy and Supply Chain Differences
- 14.11 Regional Competitive Landscape
- 14.12 Geographic Growth Hotspots
Chapter 15 Global Process Spectroscopy Technology, Innovation and Sustainability Outlook
- 15.1 Technology Landscape and Maturity
- 15.2 Product, Process and Service Innovation
- 15.3 AI, Automation and Digital Tools in the Industry
- 15.4 Technology Adoption and Performance Benchmarking
- 15.5 Innovation Pipeline and R&D Investment
- 15.6 Patent and Intellectual Property Trends
- 15.7 Energy Efficiency and Resource Management
- 15.8 Sustainability, Recycling and Circularity
- 15.9 Technology Roadmap, 2024-2032
- 15.10 Risks of Obsolescence and Technology Substitution
Chapter 16 Global Process Spectroscopy Market Key Strategic Imperatives
- 16.1 Growth and Market Entry Priorities
- 16.2 High-Return Products and Segments
- 16.3 Pricing, Profitability and Cost Optimization
- 16.4 Technology Investment and Product Differentiation
- 16.5 Supply Chain Localization and Resilience
- 16.6 Distribution and Customer Acquisition
- 16.7 Partnership, Acquisition and Capacity Strategy
- 16.8 Regional Expansion Priorities
- 16.9 Short-, Medium- and Long-Term Actions
Chapter 17 Competition Outlook
- 17.1 Industry Competition Characteristics
- 17.2 Market Structure and Concentration
- 17.3 Market Share and Competitive Positioning, 2024
- 17.4 Company-Wise Revenue and Product Benchmarking
- 17.5 Production and Service Capacity Benchmarking
- 17.6 Technology, Pricing and Differentiation
- 17.7 Regional Footprint and Distribution Strength
- 17.8 Mergers, Acquisitions and Strategic Alliances
- 17.9 New Entrants and Competitive Threats
- 17.10 Porter's Five Forces and Industry Attractiveness
- 17.11 Competitive Outlook, 2024-2032
Chapter 18 Company Profiles
- 18.1 Company Coverage and Selection Criteria
- 18.2 Thermo Fisher Scientific Inc.
- 18.2.1 Business Description
- 18.2.2 Company Ownership and Geographic Presence
- 18.2.3 Product and Service Portfolio
- 18.2.4 Manufacturing and Operating Footprint
- 18.2.5 Production Capacity and Expansion Plans
- 18.2.6 Financial Performance and Investment
- 18.2.7 Market Share and Competitive Position
- 18.2.8 Technology and Innovation Capabilities
- 18.2.9 Strategic Alliances or Partnerships
- 18.2.10 Recent Developments
- 18.2.11 Growth Strategy and Outlook
- 18.3 Agilent Technologies, Inc.
- 18.4 Bruker Corporation
- 18.5 ABB Ltd.
- 18.6 Shimadzu Corporation
- 18.7 Sartorius AG
- 18.8 Danaher Corporation
- 18.9 HORIBA, Ltd.
- 18.10 PerkinElmer, Inc.
- 18.11 Yokogawa Electric Corporation
- 18.12 Other Relevant Market Participants
Note: Every listed company is profiled on the structure shown under the first company. The company list is preliminary and may change based on research findings, market developments, data availability and client requirements.
Chapter 19 Disclaimer
- 19.1 Research and Forecast Disclaimer
- 19.2 Data Source and Estimation Limitations
Note: The depth of individual sections depends on data availability for this market. Volume, capacity, trade and other unit-based metrics are included where applicable.

