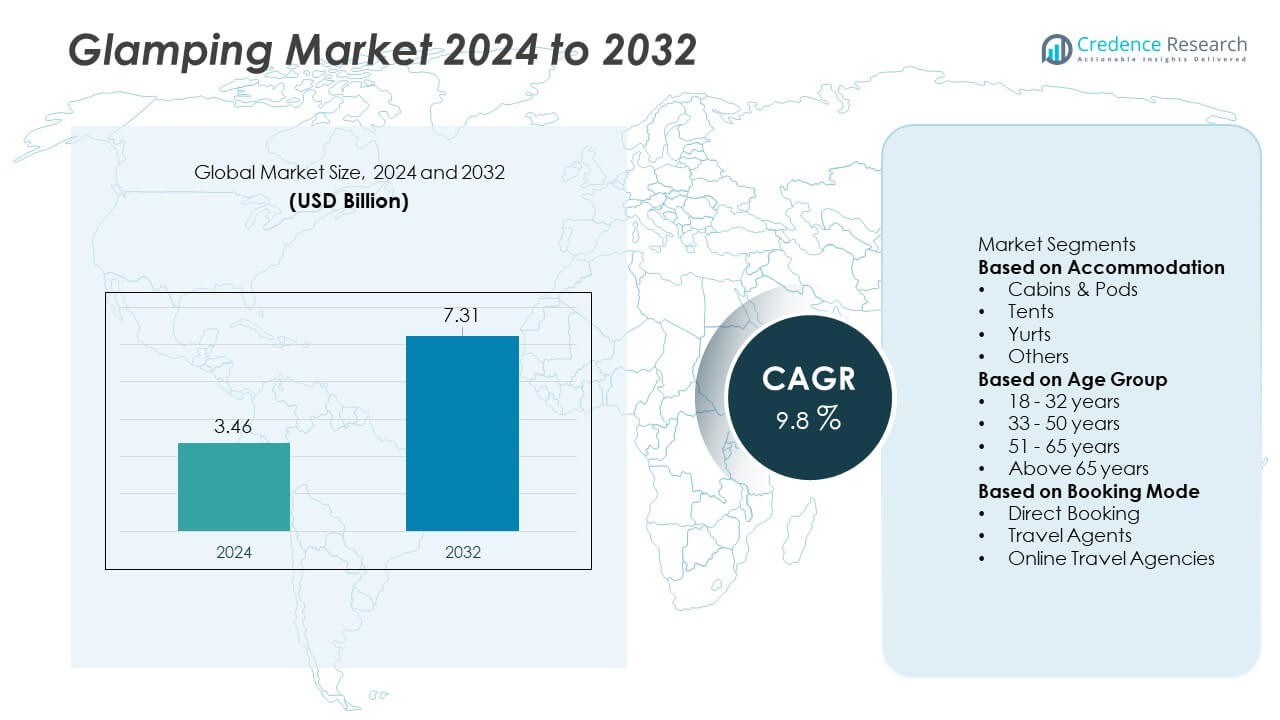
Home » Packaging » Glamping Market

Glamping Market By Type (Motor Homes, Tree Houses, Eco-pods, Yurts, Tipis) By Consumer Orientation (Male, Female, Kids) By Age Group (Below 18 years, 18-35 years, 35-50 years, Above 50 years) By Size (Less than two people, 2-5 people, More than five people) – Growth, Future Prospects & Competitive Analysis, 2016 – 2028

Price: $4999

Published: | Report ID: 6636 | Report Format : PDF

About this report

The global glamping market report investigates the glamping industry critically using key parameters. The report includes investment strategies, the need for Glamping investments, and numerous benefits for investors. Importantly, this research outlines significant developments in worldwide technical rules for the glamping sector, as well as how economic and non-economic constraints are assisting the growth of the glamping market. Furthermore, the paper examines historical and predicted market sizes at the regional, global, and national levels. The research also includes a thorough examination of major investment propositions, the demand and supply gap, competition positioning, STAR analysis, SRC analysis, and Tornado analysis. Key technological developments, as well as other analyses such as Porter’s five forces analysis, PESTEL analysis, value chain analysis, and so on,

REPORT ATTRIBUTE DETAILS
Glamping Market by Volume Yes
Market by Value Yes
Market, Tornado Analysis Yes
Market, STAR Analysis Yes
Market, SRC Analysis Yes
Market, Import-Export Data Yes (On Demand)
Market Pricing Analysis Yes (On Demand)
Market Segment Analysis By Type (Motor homes, Tree houses, Eco-pods, Yurts, Tipis, Safari Tents, Bell Tents and Others)

By Consumer Orientation (Males, Females and Kids)

By Age Group (below 18 years, 18-35 years, 35-50 years and Above 50 years)

By Size (Less than two people, 2-5 people and more than five people)

Market, Regional Analysis North America (U.S. and Canada)

Europe (Germany, UK, France, Italy, Spain, and Rest of Europe)

Asia Pacific (China, India, Japan, South Korea, South East Asia, and Rest of Asia Pacific)

Latin America (Brazil, Mexico, and Rest of Latin America)

Middle East and Africa (GCC Countries, South Africa, and Rest of Middle East and Africa)

Market Key Companies ACCORSA., Hilton Worldwide Holdings Inc., Radisson Hotel Group, Bourne Leisure Holdings Limited, TENTRR, TentsXpert, Under Canvas, The Resort at Paws Up Collective Retreats, Asheville Glamping, Glam Xperience, Pure Pods, Getaway House, Inc., Hoshino Resorts Inc., Baillie Lodges.
Market Competitive Landscape Market Share Analysis

Competitive Benchmarking

Key Players Market Positioning

Geographical Presence Analysis

Major Strategies Adopted

Key Highlights of the Report

How are the major segments performing in the glamping market?

  • In 2021, the eco-pods segment dominated the largest share of the glamping market due to its advanced features, such as lockable doors and windows, safety, and others.
  • In 2021, the men’s segment dominated the global glamping market due to a shift from consumer interest from traditional camping to glamping, which drives growth in the global glamping market.
  • In 2021, the 35-50 years segment dominated the glamping market share due to this age group’s increasing preference for comfort and luxury.
  • In 2021, the 2–5 people segment accounted for the largest market share due to the increased demand for group travelers in the glamping market.
Design Element 2

Access crucial information at unmatched prices!

Request your free sample report today & start making informed decisions powered by Credence Research!

Download Free Sample
CTA Design Element 3

Which region dominated the glamping market?

The North American region dominated for the highest market share in 2021 due to the increasing demand for nature adventures. The rising choices of comfortable and luxurious traveling, the increasing number of tour operators, and online glamping services are increasing the growth of market in North America. Canada and the U.S. mostly enjoy different accommodations. Additionally, the rising advancements and innovative techniques are driving the market’s growth in this region. Furthermore, open-air live music concerts and social media developers made glamping popular. These factors are increasing market growth in the North American region.

How is the US market performing in the glamping market?

In 2021, the U.S. market dominated for the highest market share due to the increasing demand for nature adventures. The rising choices of comfortable and luxurious traveling, the increasing number of tour operators, and online glamping services are increasing the growth of the market in the U.S. Additionally, the rising advancements and innovative techniques are driving the market’s growth in this region.

What is the competitive environment of the glamping market?

The main players are concentrating on implementing partnerships and innovations to increase their contributions and win the largest market share. For instance, in 2019, Baillie Lodges entered into a joint venture with KSL Capital Partners, LLC (KSL) to offer tourists Australia’s finest luxury lodges. Therefore, it is anticipated that such contributions from key market players will strengthen the sector and lead to higher demand during the forecast period.

Executive Summary

How has glamping aided in the expansion of the tourism sector?

Glamping means enjoying luxurious amenities while camping in a comfortable setting. These amenities may include Wi-Fi, bars, electricity, beds, spas, bathrooms, indoor plumbing, and housekeeping services. These accommodations use the natural surroundings to produce eco-friendly spaces and promote sustainable travel. The rapid expansion of outdoor tourism and the rising income levels of people worldwide drive the market’s expansion. The desire for creative glamping lodgings, such as villas, lodges, treehouses, tents, cabins, and tipis, is increasing as the industry expands. During the projection period, developing luxury multi-story tree homes and modern-style yurts with top-notch amenities would provide lucrative prospects to market participants. The market will also grow as a result of increased government initiatives to upgrade infrastructure associated with tourism.

Which are the key investments by the Glamping Market players?

The rising trend of outdoor activities with luxuries impacts the market for glamping. Due to this, market players are investing heavily, which supports market expansion during the forecast period. For instance, the EcoFlow River portable power station series debuted in March 2022, according to EcoFlow, a provider of portable power and renewable energy solutions. There are series available for indoor and outdoor use.

Some of the major players in the glamping market are ACCORSA, Hilton Worldwide Holdings Inc., Bourne Leisure Holdings Limited, Radisson Hotel Group, TENTRR, TentsXpert, Under Canvas, Asheville Glamping, Glam Xperience, Pure Pods, The Resort at Paws Up Collective Retreats, Getaway House, Inc., Hoshino Resorts Inc., and Baillie Lodges.

What are the major driving factors for the glamping market?

The increasing influence of social media among consumers is the major factor in the growth of the glamping market. The tourist sites offering various holiday packages are also growing in market demand.   Moreover, government investments and technological advancement are expected to grow in the glamping market. One of the main factors anticipated to drive the market is the rise in concerts and significant music festivals organized every other week in different parts of the world. Over the forecast year, more customers are anticipated to be interested in outdoor activities and experiences close to nature. These factors are increasing the growth of the global glamping market.

What are the major risks for the glamping market?

The increasing popularity of recreational vehicles among people is the major restraint on the glamping market. Furthermore, the government’s strict regulation of various places is expected to hamper market growth. Additionally, declining demand for glamping hampered this market during the pandemic. These factors are hampering the growth of the global glamping market.

Which is the key type in the glamping market?

The type segment is classified into motor homes, eco-pods, yurts, tipis, tree houses, safari tents, bell tents, and others; the eco-pods segment dominated the largest share of the glamping market due to its advanced features, such as lockable doors and windows, safety, and others. The availability of eco-pods in different sizes and shapes and the ease of accommodation are expected to drive growth. These factors contributed to the expansion of the glamping market.

How is the glamping market performing in different regions?

The highest glamping market share in 2021 belonged to the North American region due to the rising demand for outdoor adventures. The global glamping market in North America is expanding due to the increasing options for comfortable and opulent travel, the rise in tour operators, and the availability of online glamping services. The market is expanding in this region due to rising innovation and cutting-edge technologies. Glamping became well-known thanks to social media platforms and outdoor live music events. These elements boost the North American region’s share of the global glamping market.

Glamping Market

Asia Pacific accounted for the largest share of the global glamping market. The increasing population leads to the rising number of the tourist industry, mostly in such countries as India, China, Japan, and others are expected to enhance demand in the Asia Pacific. Furthermore, in the Asia Pacific, disposal income and lifestyle changes are expected to grow the global glamping market. These factors are increasing the growth of the Asia-Pacific region.

What is the regulatory landscape for the glamping market?

The regulatory environment for the glamping industry is one where governments are learning to adopt a stronger regulatory approach globally for high-quality healthcare as a result of the rise in catastrophic natural disasters and some external dangers in developing nations like China and India.

What is the market size of glamping in terms of value?

The global glamping market is growing at a substantial CAGR of 10.50% in the upcoming years. The global glamping industry was estimated to be worth USD 2.3 billion in 2021 and was expected to be worth USD 4.18 billion by 2028.

Shape Your Report to Specific Countries or Regions & Enjoy 30% Off!

What are the major players planning for the future of the glamping market?

The previously comparatively concentrated global glamping market is becoming more and more diverse as a result of the emergence of many strong competitors. In parallel, the majority of newly established glamping businesses plan to expand their product lines through investments and innovations.

Segmentation of Global Glamping Market-

Global Glamping Market – By Type

  • Motor Homes
  • Tree Houses
  • Eco-pods
  • Yurts
  • Tipis
  • Safari Tents
  • Bell Tents
  • Others

Global Glamping Market – By Consumer Orientation

  • Male
  • Female
  • Kids

Global Glamping Market – By Age Group

  • Below 18 years
  • 18-35 years
  • 35-50 years
  • Above 50 years

Global Glamping Market – By Size

  • Less than two people
  • 2-5 people
  • More than five people

Global Glamping Market – By Region

  • North America
    • US.
    • Canada
  • Europe
    • Germany
    • France
    • UK.
    • Italy
    • Spain
    • Rest of Europe
  • Asia Pacific
    • China
    • Japan
    • India
    • South Korea
    • South-east Asia
    • Rest of Asia Pacific
  • Latin America
    • Brazil
    • Mexico
    • Rest of Latin America
  • Middle East & Africa
    • GCC Countries
    • South Africa
    • Rest of Middle East and Africa

1. Preface
1.1. Report Description
1.1.1. Purpose of the Report
1.1.2. Target Audience
1.1.3. USP and Key Offerings
1.2. Research Scope
1.3. Research Methodology
1.3.1. Phase I – Secondary Research
1.3.2. Phase II – Primary Research
1.3.3. Phase III – Expert Panel Review
1.3.4. Approach Adopted
1.3.4.1. Top-Down Approach
1.3.4.2. Bottom-Up Approach
1.3.5. Assumptions
1.4. Market Segmentation

2. Executive Summary
2.1. Market Snapshot: Global Glamping Market
2.2. Global Glamping Market, By Type
2.3. Global Glamping Market, By Consumer Orientation
2.4. Global Glamping Market, By Age Group
2.5. Global Glamping Market, By Size
2.6. Global Glamping Market, By Region

3. Market Dynamics & Factors Analysis
3.1. Introduction
3.1.1. Global Glamping Market Value, 2016-2028, (US$ Bn)
3.2. Market Dynamics
3.2.1. Key Growth Trends
3.2.2. Market Drivers
3.2.3. Market Restraints
3.2.4. Market Opportunities
3.2.5. Major Industry Challenges
3.3. Attractive Investment Proposition,2021
3.3.1. Type
3.3.2. Consumer Orientation
3.3.3. Age Group
3.3.4. Size
3.3.5. Geography

4. Premium Insights
4.1. STAR (Situation, Task, Action, Results) Analysis
4.2. Porter’s Five Forces Analysis
4.2.1. Threat of New Entrants
4.2.2. Bargaining Power of Buyers/Consumers
4.2.3. Bargaining Power of Suppliers
4.2.4. Threat of Substitute Types
4.2.5. Intensity of Competitive Rivalry
4.3. Value Chain Analysis
4.4. Technology Analysis
4.5. Marketing Strategy Analysis
4.5.1. Direct Marketing
4.5.2. Indirect Marketing
4.5.3. Marketing Channel Development Trend

5. Market Positioning of Key Players, 2021
5.1. Company market share of key players, 2021
5.2. Competitive Benchmarking
5.3. Market Positioning of Key Vendors
5.4. Geographical Presence Analysis
5.5. Major Strategies Adopted By Key Players
5.5.1. Key Strategies Analysis
5.5.2. Mergers and Acquisitions
5.5.3. Partnerships
5.5.4. Product Launch
5.5.5. Geographical Expansion
5.5.6. Others

6. COVID 19 Impact Analysis
6.1. Global Glamping Market Pre Vs Post COVID 19, 2019 – 2028
6.2. Impact on Import & Export
6.3. Impact on Demand & Supply

7. Global Glamping Market
7.1. Global Glamping Market, By Type, 2016-2028(US$ Bn)
7.1.1. Overview
7.1.2. Global Glamping market, By Type, 2021 vs 2028 (in%)
7.1.3. Global Glamping Market, By Motor homes, 2016-2028 (US$ Bn)
7.1.4. Global Glamping Market, By Tree houses, 2016-2028 (US$ Bn)
7.1.5. Global Glamping Market, By Eco-Pods, 2016-2028 (US$ Bn)
7.1.6. Global Glamping Market, By Yurts, 2016-2028 (US$ Bn)
7.1.7. Global Glamping Market, By Tipis, 2016-2028 (US$ Bn)
7.1.8. Global Glamping Market, By Safari Tents, 2016-2028 (US$ Bn)
7.1.9. Global Glamping Market, By Bell Tents, 2016-2028 (US$ Bn)
7.1.10. Global Glamping Market, By Others, 2016-2028 (US$ Bn)
7.2. Global Glamping Market, By Consumer Orientation, 2016-2028(US$ Bn)
7.2.1. Overview
7.2.2. Global Glamping Market, By Male, 2021 vs 2028 (in%)
7.2.3. Global Glamping Market, By Female, 2016-2028 (US$ Bn)
7.2.4. Global Glamping Market, By Kids, 2016-2028 (US$ Bn)
7.3. Global Glamping Market, By Age Group, 2016-2028 (US$ Bn)
7.3.1. Overview
7.3.2. Global Glamping Market, By Below 18 years, 2021 vs 2028 (in%)
7.3.3. Global Glamping Market, By 18-35 years, 2016-2028 (US$ Bn)
7.3.4. Global Glamping Market, By 35-50 years, 2016-2028 (US$ Bn)
7.3.5. Global Glamping Market, By Above 50 years, 2016-2028 (US$ Bn)
7.4. Global Glamping Market, By Size, 2016-2028(US$ Bn)
7.4.1. Overview
7.4.2. Global Glamping Market, By Less than 2 people, 2021 vs 2028 (in%)
7.4.3. Global Glamping Market, By 2-5 people, 2016-2028 (US$ Bn)
7.4.4. Global Glamping Market, By More than 5 people, 2016-2028 (US$ Bn)

8. North America Glamping Market Analysis
8.1. North America Glamping Market By Type, 2016-2028(US$ Bn)
8.1.1. Overview
8.1.2. SRC Analysis
8.2. North America Glamping Market By Consumer Orientation, 2016-2028(US$ Bn)
8.2.1. Overview
8.3. SRC Analysis
8.4. North America Glamping Market By Age Group, 2016-2028(US$ Bn)
8.4.1. Overview
8.5. SRC Analysis
8.6. North America Glamping Market By Size, 2016-2028(US$ Bn)
8.6.1. Overview
8.7. SRC Analysis
8.8. North America Glamping Market By Country, 2016-2028 (US$ Bn)
8.8.1. U.S.
8.8.1.1. U.S. Glamping Market Estimates and Forecast, 2016-2028 (US$ Bn)
8.8.1.2. U.S. Glamping By Type, 2016-2028 (US$ Bn)
8.8.1.3. U.S. Glamping By Consumer Orientation, 2016-2028 (US$ Bn)
8.8.1.4. U.S. Glamping By Age Group, 2016-2028 (US$ Bn)
8.8.1.5. U.S. Glamping By Size, 2016-2028 (US$ Bn)
8.8.1.6. Canada
8.8.1.7. Canada Glamping Market Estimates and Forecast, 2016-2028 (US$ Bn)
8.8.1.8. Canada Glamping By Type, 2016-2028 (US$ Bn)
8.8.1.9. Canada Glamping By Consumer Orientation, 2016-2028 (US$ Bn)
8.8.1.10. Canada Glamping By Age Group, 2016-2028 (US$ Bn)
8.8.1.11. Canada Glamping By Size, 2016-2028 (US$ Bn)

9. Europe Glamping Market Analysis
9.1. Europe Glamping Market By Type, 2016-2028(US$ Bn)
9.1.1. Overview
9.1.2. SRC Analysis
9.2. Europe Glamping Market By Consumer Orientation, 2016-2028(US$ Bn)
9.2.1. Overview
9.3. SRC Analysis
9.4. Europe Glamping Market By Age Group, 2016-2028(US$ Bn)
9.4.1. Overview
9.5. SRC Analysis
9.6. Europe Glamping Market By Size, 2016-2028(US$ Bn)
9.6.1. Overview
9.6.2. SRC Analysis
9.7. Europe Glamping Market By Country, 2016-2028 (US$ Bn)
9.7.1. Germany
9.7.1.1. Germany Glamping Market Estimates and Forecast, 2016-2028 (US$ Bn)
9.7.1.2. Germany Glamping By Type, 2016-2028 (US$ Bn)
9.7.1.3. Germany Glamping By Consumer Orientation, 2016-2028 (US$ Bn)
9.7.1.4. Germany Glamping By Age Group, 2016-2028 (US$ Bn)
9.7.1.5. Germany Glamping By Size, 2016-2028 (US$ Bn)
9.7.2. France
9.7.2.1. France Glamping Market Estimates and Forecast, 2016-2028 (US$ Bn)
9.7.2.2. France Glamping By Type, 2016-2028 (US$ Bn)
9.7.2.3. France Glamping By Consumer Orientation, 2016-2028 (US$ Bn)
9.7.2.4. France Glamping By Age Group, 2016-2028 (US$ Bn)
9.7.2.5. France Glamping By Size, 2016-2028 (US$ Bn)
9.7.3. UK
9.7.3.1. UK Glamping Market Estimates and Forecast, 2016-2028 (US$ Bn)
9.7.3.2. UK Glamping By Type, 2016-2028 (US$ Bn)
9.7.3.3. UK Glamping By Consumer Orientation, 2016-2028 (US$ Bn)
9.7.3.4. UK Glamping By Age Group, 2016-2028 (US$ Bn)
9.7.3.5. UK Glamping By Size, 2016-2028 (US$ Bn)
9.7.4. Italy
9.7.4.1. Italy Glamping Market Estimates and Forecast, 2016-2028 (US$ Bn)
9.7.4.2. Italy Glamping By Type, 2016-2028 (US$ Bn)
9.7.4.3. Italy Glamping By Consumer Orientation, 2016-2028 (US$ Bn)
9.7.4.4. Italy Glamping By Age Group, 2016-2028 (US$ Bn)
9.7.4.5. Italy Glamping By Size, 2016-2028 (US$ Bn)
9.7.5. Spain
9.7.5.1. Spain Glamping Market Estimates and Forecast, 2016-2028 (US$ Bn)
9.7.5.2. Spain Glamping By Type, 2016-2028 (US$ Bn)
9.7.5.3. Spain Glamping By Consumer Orientation, 2016-2028 (US$ Bn)
9.7.5.4. Spain Glamping By Age Group, 2016-2028 (US$ Bn)
9.7.5.5. Spain Glamping By Size, 2016-2028 (US$ Bn)
9.7.6. Rest of Europe
9.7.6.1. Rest of Europe Glamping Market Estimates and Forecast, 2016-2028 (US$ Bn)
9.7.6.2. Rest of Europe Glamping By Type, 2016-2028 (US$ Bn)
9.7.6.3. Rest of Europe Glamping By Consumer Orientation, 2016-2028 (US$ Bn)
9.7.6.4. Rest of Europe Glamping By Age Group, 2016-2028 (US$ Bn)
9.7.6.5. Rest of Europe Glamping By Size, 2016-2028 (US$ Bn)
9.8. Asia Pacific Glamping Market Analysis
9.9. Asia Pacific Glamping Market By Type, 2016-2028(US$ Bn)
9.9.1. Overview
9.9.2. SRC Analysis
9.10. Asia Pacific Glamping Market By Consumer Orientation, 2016-2028(US$ Bn)
9.10.1. Overview
9.11. SRC Analysis
9.12. Asia Pacific Glamping Market By Age Group, 2016-2028(US$ Bn)
9.12.1. Overview
9.12.2. SRC Analysis
9.13. Asia Pacific Glamping Market By Size, 2016-2028(US$ Bn)
9.13.1. Overview
9.13.2. SRC Analysis
9.14. Asia Pacific Glamping Market By Country, 2016-2028 (US$ Bn)
9.14.1. China
9.14.1.1. China Glamping Market Estimates and Forecast, 2016-2028 (US$ Bn)
9.14.1.2. China Glamping By Type, 2016-2028 (US$ Bn)
9.14.1.3. China Glamping By Consumer Orientation, 2016-2028 (US$ Bn)
9.14.1.4. China Glamping By Age Group, 2016-2028 (US$ Bn)
9.14.1.5. China Glamping By Size, 2016-2028 (US$ Bn)
9.14.2. Japan
9.14.2.1. Japan Glamping Market Estimates and Forecast, 2016-2028 (US$ Bn)
9.14.2.2. Japan Glamping By Type, 2016-2028 (US$ Bn)
9.14.2.3. Japan Glamping By Consumer Orientation, 2016-2028 (US$ Bn)
9.14.2.4. Japan Glamping By Age Group, 2016-2028 (US$ Bn)
9.14.2.5. Japan Glamping By Size, 2016-2028 (US$ Bn)
9.14.3. India
9.14.3.1. India Glamping Market Estimates and Forecast, 2016-2028 (US$ Bn)
9.14.3.2. India Glamping By Type, 2016-2028 (US$ Bn)
9.14.3.3. India Glamping By Consumer Orientation, 2016-2028 (US$ Bn)
9.14.3.4. India Glamping By Age Group, 2016-2028 (US$ Bn)
9.14.3.5. India Glamping By Size, 2016-2028 (US$ Bn)
9.14.4. South Korea
9.14.4.1. South Korea Glamping Market Estimates and Forecast, 2016-2028 (US$ Bn)
9.14.4.2. South Korea Glamping By Type, 2016-2028 (US$ Bn)
9.14.4.3. South Korea Glamping By Consumer Orientation, 2016-2028 (US$ Bn)
9.14.4.4. South Korea Glamping By Age Group, 2016-2028 (US$ Bn)
9.14.4.5. South Korea Glamping By Size, 2016-2028 (US$ Bn)
9.14.5. South-East Asia
9.14.5.1. South-East Asia Glamping Market Estimates and Forecast, 2016-2028 (US$ Bn)
9.14.5.2. South-East Asia Glamping By Type, 2016-2028 (US$ Bn)
9.14.5.3. South-East Asia Glamping By Consumer Orientation, 2016-2028 (US$ Bn)
9.14.5.4. South-East Asia Glamping By Age Group, 2016-2028 (US$ Bn)
9.14.5.5. South-East Asia Glamping By Size, 2016-2028 (US$ Bn)
9.14.6. Rest of Asia Pacific
9.14.6.1. Rest of Asia Pacific Glamping Market Estimates and Forecast, 2016-2028 (US$ Bn)
9.14.6.2. Rest of Asia Pacific Glamping By Type, 2016-2028 (US$ Bn)
9.14.6.3. Rest of Asia Pacific Glamping By Consumer Orientation, 2016-2028 (US$ Bn)
9.14.6.4. Rest of Asia Pacific Glamping By Age Group, 2016-2028 (US$ Bn)
9.14.6.5. Rest of Asia Pacific Glamping By Size, 2016-2028 (US$ Bn)

10. Latin America Glamping Market Analysis
10.1. Latin America Glamping Market By Type, 2016-2028(US$ Bn)
10.1.1. Overview
10.1.2. SRC Analysis
10.2. Latin America Glamping Market By Consumer Orientation, 2016-2028(US$ Bn)
10.2.1. Overview
10.3. SRC Analysis
10.4. Latin America Glamping Market By Age Group, 2016-2028(US$ Bn)
10.4.1. Overview
10.4.2. SRC Analysis
10.5. Latin America Glamping Market By Size, 2016-2028(US$ Bn)
10.5.1. Overview
10.5.2. SRC Analysis
10.6. Latin America Glamping Market By Country, 2016-2028 (US$ Bn)
10.6.1. Brazil
10.6.1.1. Brazil Glamping Market Estimates and Forecast, 2016-2028 (US$ Bn)
10.6.1.2. Brazil Glamping By Type, 2016-2028 (US$ Bn)
10.6.1.3. Brazil Glamping By Consumer Orientation, 2016-2028 (US$ Bn)
10.6.1.4. Brazil Glamping By Age Group, 2016-2028 (US$ Bn)
10.6.1.5. Brazil Glamping By Size, 2016-2028 (US$ Bn)
10.6.2. Mexico
10.6.2.1. Mexico Glamping Market Estimates and Forecast, 2016-2028 (US$ Bn)
10.6.2.2. Mexico Glamping By Type, 2016-2028 (US$ Bn)
10.6.2.3. Mexico Glamping By Consumer Orientation, 2016-2028 (US$ Bn)
10.6.2.4. Mexico Glamping By Age Group, 2016-2028 (US$ Bn)
10.6.2.5. Mexico Glamping By Size, 2016-2028 (US$ Bn)
10.6.3. Rest of Latin America
10.6.3.1. Rest of Latin America Glamping Market Estimates and Forecast, 2016-2028 (US$ Bn)
10.6.3.2. Rest of Latin America Glamping By Type, 2016-2028 (US$ Bn)
10.6.3.3. Rest of Latin America Glamping By Consumer Orientation, 2016-2028 (US$ Bn)
10.6.3.4. Rest of Latin America Glamping By Age Group, 2016-2028 (US$ Bn)
10.6.3.5. Rest of Latin America Glamping By Size, 2016-2028 (US$ Bn)

11. Middle East and Africa Glamping Market Analysis
11.1. Middle East and Africa Glamping Market By Type, 2016-2028(US$ Bn)
11.1.1. Overview
11.1.2. SRC Analysis
11.2. Middle East and Africa Glamping Market By Consumer Orientation, 2016-2028(US$ Bn)
11.2.1. Overview
11.3. SRC Analysis
11.4. Middle East and Africa Glamping Market By Age Group, 2016-2028(US$ Bn)
11.4.1. Overview
11.4.2. SRC Analysis
11.5. Middle East and Africa Glamping Market By Size, 2016-2028(US$ Bn)
11.5.1. Overview
11.5.2. SRC Analysis
11.6. Middle East and Africa Glamping Market By Country, 2016-2028 (US$ Bn)
11.6.1. GCC Countries
11.6.1.1. GCC Countries Glamping Market Estimates and Forecast, 2016-2028 (US$ Bn)
11.6.1.2. GCC Countries Glamping By Type, 2016-2028 (US$ Bn)
11.6.1.3. GCC Countries Glamping By Consumer Orientation, 2016-2028 (US$ Bn)
11.6.1.4. GCC Countries Glamping By Age Group, 2016-2028 (US$ Bn)
11.6.1.5. GCC Countries Glamping By Size, 2016-2028 (US$ Bn)
11.6.2. South Africa
11.6.2.1. South Africa Glamping Market Estimates and Forecast, 2016-2028 (US$ Bn)
11.6.2.2. South Africa Glamping By Type, 2016-2028 (US$ Bn)
11.6.2.3. South Africa Glamping By Consumer Orientation, 2016-2028 (US$ Bn)
11.6.2.4. South Africa Glamping By Age Group, 2016-2028 (US$ Bn)
11.6.2.5. South Africa Glamping By Size, 2016-2028 (US$ Bn)
11.6.3. Rest of Middle East and Africa
11.6.3.1. Rest of Middle East and Africa Glamping Market Estimates and Forecast, 2016-2028 (US$ Bn)
11.6.3.2. Rest of Middle East and Africa Glamping By Type, 2016-2028 (US$ Bn)
11.6.3.3. Rest of Middle East and Africa Glamping By Consumer Orientation, 2016-2028 (US$ Bn)
11.6.3.4. Rest of Middle East and Africa Glamping By Age Group, 2016-2028 (US$ Bn)
11.6.3.5. Rest of Middle East and Africa Glamping By Size, 2016-2028 (US$ Bn)

12. Company Profiles
12.1. Siemens (Germany)
12.2. Company Overview
12.3. Products/More than 5 people Portfolio
12.4. Geographical Presence
12.5. Financial Summary
12.6. Market Revenue and Net Profit (2019-2021)
12.7. Business Segment Revenue Analysis
12.8. Geographical Revenue Analysis
12.9. ACCOR SA.
12.10. Hilton Worldwide Holdings INC.
12.11. Radisson Hotel Group
12.12. Bourne Leisure Holdings Limited
12.13. TENTRR
12.14. Tents Xpert
12.15. Under Canvas
12.16. The Resort At Paws Up
12.17. Collective Retreats
12.18. Asheville Glamping
12.19. Glam Xperience
12.20. Pure Pods
12.21. Getaway House, Inc.
12.22. Hoshino Resorts Inc.
12.23. Baillie Lodges

List of Figures
FIG. 1 Global Glamping Market: Research Methodology
FIG. 2 Market Size Estimation – Top Down & Bottom up Approach
FIG. 3 Global Glamping Market Segmentation
FIG. 4 Global Glamping Market, By Type, 2021 (US$ Bn)
FIG. 5 Global Glamping Market, By Consumer Orientation, 2021 (US$ Bn)
FIG. 6 Global Glamping Market, By Age Group, 2021 (US$ Bn)
FIG. 7 Global Glamping Market, By Size, 2021 (US$ Bn)
FIG. 8 Global Glamping Market, By Geography, 2021 (US$ Bn)
FIG. 9 Attractive Investment Proposition, By Type, 2021
FIG. 10 Attractive Investment Proposition, By Consumer Orientation, 2021
FIG. 11 Attractive Investment Proposition, By Age Group, 2021
FIG. 12 Attractive Investment Proposition, By Size, 2021
FIG. 13 Attractive Investment Proposition, By Geography, 2021
FIG. 14 Global Market Share Analysis of Key Glamping Market Manufacturers, 2021
FIG. 15 Global Glamping Market Value Contribution, By Type, 2021 & 2028 (Value %)
FIG. 16 Global Glamping Market, By Motor homes , Value, 2016-2028 (US$ Bn)
FIG. 17 Global Glamping Market, By Tree houses, Value, 2016-2028 (US$ Bn)
FIG. 18 Global Glamping Market, By Eco-Pods, Value, 2016-2028 (US$ Bn)
FIG. 19 Global Glamping Market, By Yurts, Value, 2016-2028 (US$ Bn)
FIG. 20 Global Glamping Market, By Tipis, Value, 2016-2028 (US$ Bn)
FIG. 21 Global Glamping Market, By Safari Tents, Value, 2016-2028 (US$ Bn)
FIG. 22 Global Glamping Market, By Bell Tents, Value, 2016-2028 (US$ Bn)
FIG. 23 Global Glamping Market, By Others, Value, 2016-2028 (US$ Bn)
FIG. 24 Global Glamping Market Value Contribution, By Consumer Orientation, 2021 & 2028 (Value %)
FIG. 25 Global Glamping Market, By Male, Value, 2016-2028 (US$ Bn)
FIG. 26 Global Glamping Market, By Female, Value, 2016-2028 (US$ Bn)
FIG. 27 Global Glamping Market, By Kids, Value, 2016-2028 (US$ Bn)
FIG. 28 Global Glamping Market Value Contribution, By Age Group, 2021 & 2028 (Value %)
FIG. 29 Global Glamping Market, By Below 18 years, Value, 2016-2028 (US$ Bn)
FIG. 30 Global Glamping Market, By 18-35 years, Value, 2016-2028 (US$ Bn)
FIG. 31 Global Glamping Market, By 35-50 years, Value, 2016-2028 (US$ Bn)
FIG. 32 Global Glamping Market, By Above 50 years, Value, 2016-2028 (US$ Bn)
FIG. 33 Global Glamping Market Value Contribution, By Size, 2021 & 2028 (Value %)
FIG. 34 Global Glamping Market, By Less than 2 people, Value, 2016-2028 (US$ Bn)
FIG. 35 Global Glamping Market, By 2-5 people, Value, 2016-2028 (US$ Bn)
FIG. 36 Global Glamping Market, By More than 5 people, Value, 2016-2028 (US$ Bn)
FIG. 37 U.S.Glamping Market 2016-2028 (US$ Bn)
FIG. 38 Canada Glamping Market 2016-2028 (US$ Bn)
FIG. 39 Germany Glamping Market 2016-2028 (US$ Bn)
FIG. 40 France Glamping Market 2016-2028 (US$ Bn)
FIG. 41 U.K.Glamping Market 2016-2028 (US$ Bn)
FIG. 42 Italy Glamping Market 2016-2028 (US$ Bn)
FIG. 43 Spain Glamping Market 2016-2028 (US$ Bn)
FIG. 44 Rest of Europe Glamping Market 2016-2028 (US$ Bn)
FIG. 45 China Glamping Market 2016-2028 (US$ Bn)
FIG. 46 Japan Glamping Market 2016-2028 (US$ Bn)
FIG. 47 India Glamping Market 2016-2028 (US$ Bn)
FIG. 48 South Korea Glamping Market 2016-2028 (US$ Bn)
FIG. 49 Southeast Asia Glamping Market 2016-2028 (US$ Bn)
FIG. 50 Rest of Asia PacificGlamping Market 2016-2028 (US$ Bn)
FIG. 51 Latin America Glamping Market 2016-2028 (US$ Bn)
FIG. 52 Brazil Glamping Market 2016-2028 (US$ Bn)
FIG. 53 Mexico Glamping Market 2016-2028 (US$ Bn)
FIG. 54 Rest of Latin America Glamping Market 2016-2028 (US$ Bn)
FIG. 55 Middle East & Africa Glamping Market 2016-2028 (US$ Bn)
FIG. 56 GCC Countries Glamping Market 2016-2028 (US$ Bn)
FIG. 57 South Africa Glamping Market 2016-2028 (US$ Bn)
FIG. 58 Rest of Middle East and Africa Glamping Market 2016-2028 (US$ Bn)

List of Tables
TABLE 1 Market Snapshot: Global Glamping Market
TABLE 2 Global Glamping Market, By Competitive Benchmarking, 2021
TABLE 3 Global Glamping Market, By Geographical Presence Analysis, 2021
TABLE 4 Global Glamping Market, By Key Strategies Analysis, 2021
TABLE 5 Global Glamping Market, By Type, 2016-2028 (US$ Bn)
TABLE 6 Global Glamping Market, By Consumer Orientation, 2016-2028 (US$ Bn)
TABLE 7 Global Glamping Market, By Age Group, 2016-2028 (US$ Bn)
TABLE 8 Global Glamping Market, By Size, 2016-2028 (US$ Bn)
TABLE 9 Global Glamping Market, By Geography, 2016-2028 (US$ Bn)
TABLE 10 North America Glamping Market By Type, 2016-2028 (US$ Bn)
TABLE 11 North America Glamping Market By Consumer Orientation, 2016-2028 (US$ Bn)
TABLE 12 North America Glamping Market By Age Group, 2016-2028 (US$ Bn)
TABLE 13 North America Glamping Market By Size, 2016-2028 (US$ Bn)
TABLE 14 North America Glamping Market By Country, 2016-2028 (US$ Bn)
TABLE 15 US Glamping Market By Type, 2016-2028 (US$ Bn)
TABLE 16 US Glamping Market By Consumer Orientation, 2016-2028 (US$ Bn)
TABLE 17 US Glamping Market By Age Group, 2016-2028 (US$ Bn)
TABLE 18 US Glamping Market By Size, 2016-2028 (US$ Bn)
TABLE 19 Canada Glamping Market By Type, 2016-2028 (US$ Bn)
TABLE 20 Canada Glamping Market By Consumer Orientation, 2016-2028 (US$ Bn)
TABLE 21 Canada Glamping Market By Age Group, 2016-2028 (US$ Bn)
TABLE 22 Canada Glamping Market By Size, 2016-2028 (US$ Bn)
TABLE 23 Europe Glamping Market By Type, 2016-2028 (US$ Bn)
TABLE 24 Europe Glamping Market By Consumer Orientation, 2016-2028 (US$ Bn)
TABLE 25 Europe Glamping Market By Age Group, 2016-2028 (US$ Bn)
TABLE 26 Europe Glamping Market By Size, 2016-2028 (US$ Bn)
TABLE 27 Europe Glamping Market By Country, 2016-2028 (US$ Bn)
TABLE 28 Germany Glamping Market By Type, 2016-2028 (US$ Bn)
TABLE 29 Germany Glamping Market By Consumer Orientation, 2016-2028 (US$ Bn)
TABLE 30 Germany Glamping Market By Age Group, 2016-2028 (US$ Bn)
TABLE 31 Germany Glamping Market By Size, 2016-2028 (US$ Bn)
TABLE 32 France Glamping Market By Type, 2016-2028 (US$ Bn)
TABLE 33 France Glamping Market By Consumer Orientation, 2016-2028 (US$ Bn)
TABLE 34 France Glamping Market By Age Group, 2016-2028 (US$ Bn)
TABLE 35 France Glamping Market By Size, 2016-2028 (US$ Bn)
TABLE 36 UK Glamping Market By Type, 2016-2028 (US$ Bn)
TABLE 37 UK Glamping Market By Consumer Orientation, 2016-2028 (US$ Bn)
TABLE 38 UK Glamping Market By Age Group, 2016-2028 (US$ Bn)
TABLE 39 UK Glamping Market By Size, 2016-2028 (US$ Bn)
TABLE 40 Italy Glamping Market By Type, 2016-2028 (US$ Bn)
TABLE 41 Italy Glamping Market By Consumer Orientation, 2016-2028 (US$ Bn)
TABLE 42 Italy Glamping Market By Age Group, 2016-2028 (US$ Bn)
TABLE 43 Italy Glamping Market By Size, 2016-2028 (US$ Bn)
TABLE 44 Spain Glamping Market By Type, 2016-2028 (US$ Bn)
TABLE 45 Spain Glamping Market By Consumer Orientation, 2016-2028 (US$ Bn)
TABLE 46 Spain Glamping Market By Age Group, 2016-2028 (US$ Bn)
TABLE 47 Spain Glamping Market By Size, 2016-2028 (US$ Bn)
TABLE 48 Rest of Europe Glamping Market By Type, 2016-2028 (US$ Bn)
TABLE 49 Rest of Europe Glamping Market By Consumer Orientation, 2016-2028 (US$ Bn)
TABLE 50 Rest of Europe Glamping Market By Age Group, 2016-2028 (US$ Bn)
TABLE 51 Rest of Europe Glamping Market By Size, 2016-2028 (US$ Bn)
TABLE 52 Asia Pacific Glamping Market By Type, 2016-2028 (US$ Bn)
TABLE 53 Asia Pacific Glamping Market By Consumer Orientation, 2016-2028 (US$ Bn)
TABLE 54 Asia Pacific Glamping Market By Age Group, 2016-2028 (US$ Bn)
TABLE 55 Asia Pacific Glamping Market By Size, 2016-2028 (US$ Bn)
TABLE 56 Asia Pacific Glamping Market By Country, 2016-2028 (US$ Bn)
TABLE 57 China Glamping Market By Type, 2016-2028 (US$ Bn)
TABLE 58 China Glamping Market By Consumer Orientation, 2016-2028 (US$ Bn)
TABLE 59 China Glamping Market By Age Group, 2016-2028 (US$ Bn)
TABLE 60 China Glamping Market By Size, 2016-2028 (US$ Bn)
TABLE 61 Japan Glamping Market By Type, 2016-2028 (US$ Bn)
TABLE 62 Japan Glamping Market By Consumer Orientation, 2016-2028 (US$ Bn)
TABLE 63 Japan Glamping Market By Age Group, 2016-2028 (US$ Bn)
TABLE 64 Japan Glamping Market By Size, 2016-2028 (US$ Bn)
TABLE 65 India Glamping Market By Type, 2016-2028 (US$ Bn)
TABLE 66 India Glamping Market By Consumer Orientation, 2016-2028 (US$ Bn)
TABLE 67 India Glamping Market By Age Group, 2016-2028 (US$ Bn)
TABLE 68 India Glamping Market By Size, 2016-2028 (US$ Bn)
TABLE 69 South Korea Glamping Market By Type, 2016-2028 (US$ Bn)
TABLE 70 South Korea Glamping Market By Consumer Orientation, 2016-2028 (US$ Bn)
TABLE 71 South Korea Glamping Market By Age Group, 2016-2028 (US$ Bn)
TABLE 72 South Korea Glamping Market By Size, 2016-2028 (US$ Bn)
TABLE 73 South East Asia Glamping Market By Type, 2016-2028 (US$ Bn)
TABLE 74 South East Asia Glamping Market By Consumer Orientation, 2016-2028 (US$ Bn)
TABLE 75 South East Asia Glamping Market By Age Group, 2016-2028 (US$ Bn)
TABLE 76 South East Asia Glamping Market By Size, 2016-2028 (US$ Bn)
TABLE 77 Rest of Asia Pacific Glamping Market By Type, 2016-2028 (US$ Bn)
TABLE 78 Rest of Asia Pacific Glamping Market By Consumer Orientation, 2016-2028 (US$ Bn)
TABLE 79 Rest of Asia Pacific Glamping Market By Age Group, 2016-2028 (US$ Bn)
TABLE 80 Rest of Asia Pacific Glamping Market By Size, 2016-2028 (US$ Bn)
TABLE 81 Latin America Glamping Market By Type, 2016-2028 (US$ Bn)
TABLE 82 Latin America Glamping Market By Consumer Orientation, 2016-2028 (US$ Bn)
TABLE 83 Latin America Glamping Market By Age Group, 2016-2028 (US$ Bn)
TABLE 84 Latin America Glamping Market By Size, 2016-2028 (US$ Bn)
TABLE 85 Latin America Glamping Market By Country, 2016-2028 (US$ Bn)
TABLE 86 Brazil Glamping Market By Type, 2016-2028 (US$ Bn)
TABLE 87 Brazil Glamping Market By Consumer Orientation, 2016-2028 (US$ Bn)
TABLE 88 Brazil Glamping Market By Age Group, 2016-2028 (US$ Bn)
TABLE 89 Brazil Glamping Market By Size, 2016-2028 (US$ Bn)
TABLE 90 Mexico Glamping Market By Type, 2016-2028 (US$ Bn)
TABLE 91 Mexico Glamping Market By Consumer Orientation, 2016-2028 (US$ Bn)
TABLE 92 Mexico Glamping Market By Age Group, 2016-2028 (US$ Bn)
TABLE 93 Mexico Glamping Market By Size, 2016-2028 (US$ Bn)
TABLE 94 Rest of Latin America Glamping Market By Type, 2016-2028 (US$ Bn)
TABLE 95 Rest of Latin America Glamping Market By Consumer Orientation, 2016-2028 (US$ Bn)
TABLE 96 Rest of Latin America Glamping Market By Age Group, 2016-2028 (US$ Bn)
TABLE 97 Rest of Latin America Glamping Market By Size, 2016-2028 (US$ Bn)
TABLE 98 Middle East and Africa Glamping Market By Type, 2016-2028 (US$ Bn)
TABLE 99 Middle East and Africa Glamping Market By Consumer Orientation, 2016-2028 (US$ Bn)
TABLE 100 Middle East and Africa Glamping Market By Age Group, 2016-2028 (US$ Bn)
TABLE 101 Middle East and Africa Glamping Market By Size, 2016-2028 (US$ Bn)
TABLE 102 Middle East and Africa Glamping Market By Country, 2016-2028 (US$ Bn)
TABLE 103 GCC Countries Glamping Market By Type, 2016-2028 (US$ Bn)
TABLE 104 GCC Countries Glamping Market By Consumer Orientation, 2016-2028 (US$ Bn)
TABLE 105 GCC Countries Glamping Market By Age Group type, 2016-2028 (US$ Bn)
TABLE 106 GCC Countries Glamping Market By Size, 2016-2028 (US$ Bn)
TABLE 107 South Africa Glamping Market By Type, 2016-2028 (US$ Bn)
TABLE 108 South Africa Glamping Market By Consumer Orientation, 2016-2028 (US$ Bn)
TABLE 109 South Africa Glamping Market By Age Group, 2016-2028 (US$ Bn)
TABLE 110 South Africa Glamping Market By Size, 2016-2028 (US$ Bn)
TABLE 111 Rest of Middle East and Africa Glamping Market By Type, 2016-2028 (US$ Bn)
TABLE 112 Rest of Middle East and Africa Glamping Market By Consumer Orientation, 2016-2028 (US$ Bn)
TABLE 113 Rest of Middle East and Africa Glamping Market By Age Group, 2016-2028 (US$ Bn)
TABLE 114 Rest of Middle East and Africa Glamping Market By Size, 2016-2028 (US$ Bn)

Frequently Asked Questions

Which region will contribute notably towards the glamping market value?

The North American region dominated for the highest market share in 2021 due to the increasing demand for nature adventures.

Which key factors will influence the glamping market growth over 2022-2028?

The increasing influence of social media among consumers is the major factor in the glamping market growth.

Which is the major segment in the glamping market by type?

The eco-pods segment had a major share in the global glamping market in 2021.

Which is the major segment in the glamping market by Industry consumer orientation?

The men segment had a major share in the global glamping market in 2021.

Which is the major segment in the glamping market by age group?

The 30-50 years segment had a major share in the global glamping market in 2021.

Returnable Transport Packaging (RTP) Market

Published:
Report ID: 31723

Inverted Pouch Market

Published:
Report ID: 27027

Retail Ready Packaging Market

Published:
Report ID: 23508

Medication Pouch Inspection Market

Published:
Report ID: 22972

Seaweed Coated Carton Market

Published:
Report ID: 19373

Temperature Sensitive Packaging Market

Published:
Report ID: 19375

Chemically Recycled Flexible Packaging Market

Published:
Report ID: 19298

Recyclable HDPE Blister Packaging Market

Published:
Report ID: 19269

Aluminum Caps And Closures Market

Published:
Report ID: 12273

Polypropylene Packaging Films Market

Published:
Report ID: 10561

Anti Counterfeit Pharmaceutical Packaging Market

Published:
Report ID: 20251

EVOH Film For Packaging Market

Published:
Report ID: 20198

Purchase Options

$2999
Delivery Format: Excel.
$4999
Designed for the individual purchaser.
$6999
Users located at a single corporate site or regional office.
$7999
Allowed for unlimited sharing globally within one company.
Smallform of Sample request

Have a question?

User Profile

Don’t settle for less – trust Mitul to help you find the best solution.

Report delivery within 24 to 48 hours

– Other Info –

What people say?-

User Review

I am very impressed with the information in this report. The author clearly did their research when they came up with this product and it has already given me a lot of ideas.

Jana Schmidt
CEDAR CX Technologies

– Connect with us –

Phone

+91 6232 49 3207


support

24/7 Research Support


sales@credenceresearch.com

– Research Methodology –

Going beyond the basics: advanced techniques in research methodology

– Trusted By –

Pepshi, LG, Nestle
Motorola, Honeywell, Johnson and johnson
LG Chem, SIEMENS, Pfizer
Unilever, Samsonite, QIAGEN