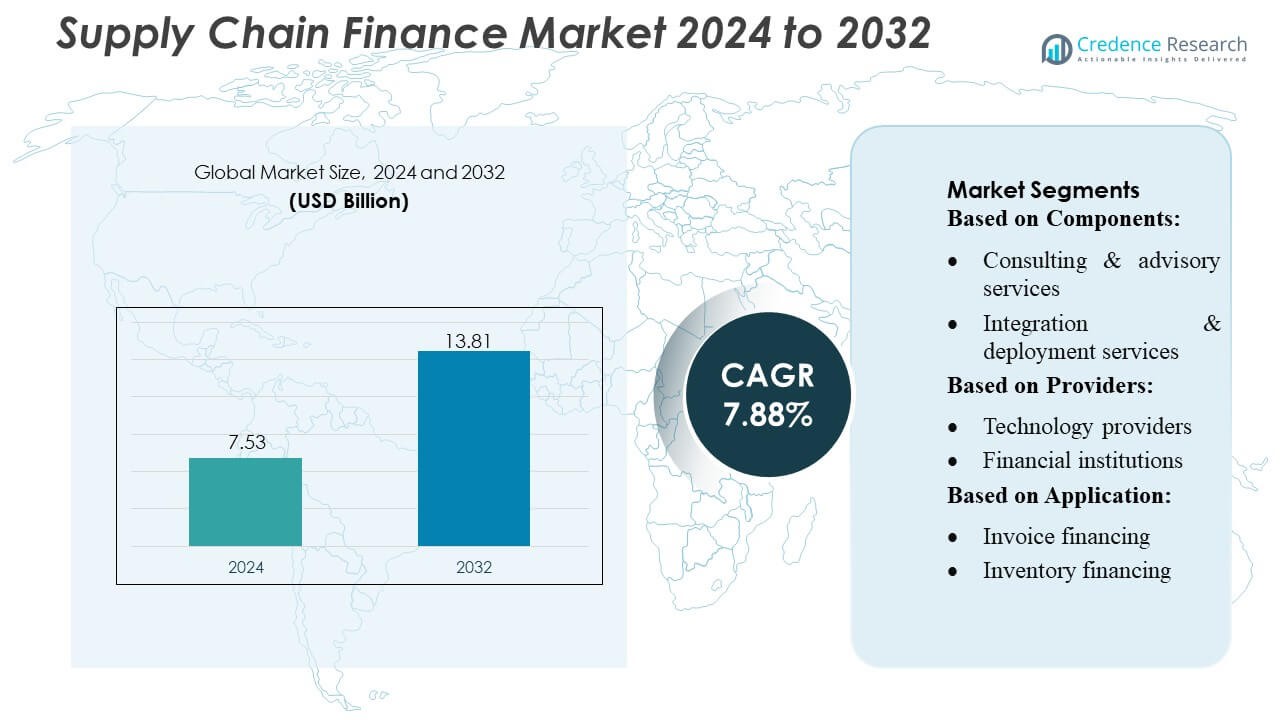
Global Supply Chain Finance Market By Offering (Export and Import Bills, Letter of Credit, Performance Bonds, Shipping Guarantees, and Others), By Provider (Banks, Trade Finance House, and Others) -Growth, Future Prospects & Competitive Analysis, 2016 – 2030

Price: $4999

Published: | Report ID: 15548 | Report Format : PDF

Key Highlights of the report

How are the major segments performing in the Supply Chain Finance market?

  • In 2022, the export and import bills segment accounted for the market’s largest share due to banks facilitating document movement and supplier payments.
  • In 2022, the bank segment held a prominent share in the global supply chain finance market as it is widely used due to its relatively low cost.
  • In 2022, the domestic category held a prominent market share in the global supply chain finance market due to its low maintenance cost due to the growing consumption of supply chain finance software.
  • In 2022, the small and medium-sized enterprises segment will dominate the global market. Implementing supply chain finance solutions and services would result in enhanced revenues, desired outcomes, and expanded business efficiency for SMEs.

What is the Market Size of Supply Chain Finance regarding value?

The global supply chain finance market is anticipated to grow at a substantial CAGR of 8.50% in the upcoming years. The Global Supply Chain Finance industry was estimated to be worth USD 6.2 billion in 2022 and was expected to be worth USD 10.97 billion by 2028.

Design Element 2

Access crucial information at unmatched prices!

Request your free sample report today & start making informed decisions powered by Credence Research!

Download Free Sample
CTA Design Element 3

Which region dominated the Supply Chain Finance market?

In 2022, the Asia-Pacific region was anticipated to hold a prominent share of the global supply chain finance market. This was attributed to the fact that the governments in these economies have started to invest heavily in supply chain finance systems due to the improved security concerns from financial institutions for trading activities. In addition, supply chain finance is getting significant traction in the Asia- Pacific region owing to a surge in several cases of market abuse and fraud along with growing complexities of regulatory compliance requirements in banks and financial institutions.

Supply Chain Finance Market

How is US Market Performing in the Supply Chain Finance market?

The presence of a large number of businesses and retailers adopting supply chain finance solutions to strengthen their global supply and logistic network. In this manner, North America dominates the supply chain finance market growth. Besides, the geographical expansion of businesses led organizations to reassess their existing supply chain and logistic network. The necessity of managing safety during this reassessment of the supply chain is expected to drive the supply chain finance market across the US.

How is the economy impacting the global Supply Chain Finance growth?

In 2022, the North American region was anticipated to hold a prominent share of the global Supply Chain Finance market. In the US, potassium sulfate is preferred as a fertilizer because of its outstanding performance and properties. The production of tree nuts, such as cashews, almonds, etc. and turf has increased steadily in the last few years. Farmers are increasingly concentrating on adopting SOP-based fertilizers to generate effective crop yields.

What is the competitive environment of the Supply Chain Finance market?

The supply chain finance industry has shown growth in the past few years; however, owing to the outbreak of COVID-19, the market witnessed a huge decline in 2020. This increase in remote working and social distancing created a challenge for supply chain finance in financial firms for capturing data from a multitude of locations and sources. All these factors have enhanced the chances of risk and decline in the supply chain finance market in the form of the unregistered channel to communicate misreported trades. However, the recession and the Ukraine-Russia war also impacted the economy of the supply chain finance market over the forecast period.

Executive Summary

What are the key trends in the Supply Chain Finance market?

  • In 2022, New agreements between cross-border countries will provide huge opportunities and driving forces in terms of labor productivity, permit greater use of machinery, overcome technical support, stimulate innovations, and enable countries to expand their economic development.
  • Moreover, enhanced competition in foreign trade also drives niche opportunities for the market. Such agreements enhance local credit by lowering the cost of borrowing or financing expansion and empowering domestic and SMEs in the market.

How does the growing demand for safety and security increase the supply chain finance market?

Increase in demand for supply chain finance on market manipulation such as losing investor confidence, fraud behavioral patterning, damaging market integrity, and insider business pressure on financial enterprises to invest in supply chain finance techniques that have less proliferation, ability to collate and observe multiple structured & unstructured data sets together, and deliver financial security in the form of payment hazard and supply risk to an importer and exporter. In the early days of international trade, multiple exporters were never convinced whether or when the importer would remunerate them for their services. Over time, exporters tried to find various ways to decrease the non-payment risk from importers. Moreover, the importers were also worried about making prior payments for goods since they needed a guarantee of the seller would ship the goods. Supply chain finance has evolved to address these risks by revving payments to exporters and ensuring importers that all the goods ordered have been shipped with a letter of credit (LOC). Supply chain finance providers have expanded the number of solutions to improve the overall investor interface experience and keep themselves ahead of their competitors in the upcoming years. Thus, the advancement in need for safety and security of supplying activities is propelling the growth of the supply chain finance market.

Which are the key investments by the Supply Chain Finance market players?

The major companies operating in the industry are highly inclined towards adopting different growth strategies, including capacity expansion, new product launches, partnerships, mergers and acquisitions, geographical expansion, and product innovation, to remain competitive in the marketplace. The prominent companies operating in the industry are highly inclined towards the adoption of different growth strategies such as capacity expansion, partnerships, geographical expansion, mergers and acquisitions, new product launches, and product innovation to remain competitive in the marketplace. For instance, in March 2022, IBSFINtech extended its product offerings with the launch of VNDZY, an integrated SaaS solution for Supply Chain Finance. IBSFINtech is a globally renowned risk, treasury, and trade finance management enterprise that delivers digitized explanations for end-to-end industrialization of the corporates’ cash flow, treasury, liquidity, risk and trade finance functions. Powered by AI, the SaaS platform VNDZY® provides a connected ecosystem for Corporations to create a win-win solution backed by advanced technologies.

Some major players in the supply chain finance market are Asian Development Bank, BNP Paribas, Bank of America Corporation, Citigroup, Inc., Royal Bank of Scotland Plc, HSBC Group, JPMorgan Chase & Co., Eulers Herms (Allianz Trade), Mitsubishi UFJ Financial Group, Inc., and Standard Chartered.

What are the Major Driving Factors for the Supply Chain Finance Market?

Increasing investments in supply chain finance tools for monitoring pre-trade, post-trade, and examination of cross-asset and cross-market trades among small organizations drive market growth. In addition, various fintech organizations are adopting supply chain finance systems to drive their revenue growth opportunity and to improve service efficiencies, which fuels the adoption of supply chain finance. Smaller businesses often need more access to loans and other states of temporary financing to cover the price of goods they plan to sell and buy. Supply chain finance bridges the financial gap between importers and exporters. It provides short to medium-term working capital, which provides security of the stock or service being exported or imported with supporting products or structures that allow risk mitigation. Furthermore, supply chain finance mitigates the credit, payment risks or default risk that suppliers hold with banks or financial institutions and provide additional security that assures that larger orders can be fulfilled. Therefore, small businesses can operate with larger inventory volumes more easily as they work with a stronger credit of end customers. Hence, resolving business constraints such as detecting anomalous behavior, enabling risk-based discovery, and others due to the emerging importance of the supply system boosts market growth.

What are the Major Risks for the Supply Chain Finance Market?

The enterprises adopting cloud-based SCM face security and privacy issues. The enterprises possess confidential data that requires to be protected from evading data breaches and theft, as it may impact the overall reputation of enterprises. The firms’ data may leak over the Internet and can be used by unauthorized users, which is a growing concern among firms. For example, the cloud-based transportation management system requires multitenant architecture, in which a single interpretation of the software runs on a server that multiple customers share. Hence, subscribers of an enterprise can view the data of competitors. These security issues relating to data access by unauthorized users will likely threaten the enterprise’s data security and competitive business position. Hence, these problems relating to security and privacy enhance the growing concern among firms and hampers the growth of the cloud supply chain finance market during the forecast period.

Which is the key application in the Supply Chain Finance market?

The SMEs segment is anticipated to hold a prominent market share in 2022 as it is projected to gain traction as provide flexibility and scalability, along with a reduced cost. Implementing supply chain finance solutions and services would result in enhanced revenues, desired outcomes, and expanded business efficiency for SMEs. However, SMEs witness three critical challenges: capital, skills, and scalability. To overcome these problems, the SMEs adopt the pay-as-you-go model, i.e., the cloud deployment model, which offers flexibility to manage the IT infrastructure per their needs. SMEs witness intense competition from huge enterprises. Thus, to achieve a competitive edge, they are embracing supply chain finance services, enabling quick responses, timely decisions, and enhanced business productivity. This trend is projected to continue among SMEs during the forecast period.

How is the Supply Chain Finance market performing in regions?

As a technologically advanced, North America was anticipated to be the fastest-growing region as it leads the world in terms of supply chain finance vendor existence. North America is a global adopter of supply chain finance solutions and services. The US holds the largest share of its supply chain finance market in North America. Many industries in the region have adopted supply chain finance services, including BFSI, healthcare, retail, manufacturing, and retail. The growing lot trend and focus on making supply chain functions, including logistics, fulfillment, warehousing, production, and transportation management, more efficient has expanded the requirement for his SCM in the region. Huge investments in infrastructure by governments and private firms, particularly in India and Indonesia, to facilitate mobility and expand infrastructure are expected to boost the demand for supply chain finance in the region. The latest trends in containerization, trucking, and computerization are increasing the scale of shipments and deliveries of raw materials, work-in-progress (WIP), and finished goods worldwide, effectively controlling supply chain cost, quality, and delivery.

What is the regulatory landscape for the Supply Chain Finance market?

It is hugely agreed that supply chains contain and incorporate material, information, and financial flows across firms. There is a robust history and continually enhancing research agenda investigating supply chain management practices and theories associated with material and knowledge flows and processes. However, the management of financial discharges from a supply chain perspective and in mixture with the other flows, usually directed to as supply chain finance (SCF), needs to be explored more. Our understanding of SCF approaches and solutions in buying and supply management (PSM) is only starting to form. The purpose of this editorial is to deliver some grounding of initial studies and concepts of SCF, illustrate recent and emerging thought in this address with articles published in this special issue, and assume how the SCF domain may evolve in theory and practice with the advent of latest digital technologies and big data analytics.

Shape Your Report to Specific Countries or Regions & Enjoy 30% Off!

What are the major players planning for the future of the Supply Chain Finance market?

Growing regional existence and investment in downstream applications are anticipated to deliver a competitive edge in the market. For instance, in May 2022, Kinaxis announced a breakthrough in advanced analytics for supply chain planning by introducing its new Planning. Al analytical approach at Kinexions, 2022, its annual supply chain innovators conference. Part of the Kinaxis Rapid Response platform, Planning. Al is the only concurrent planning solution to automatically detect and fuse the best combination of heuristics, optimization, and machine learning.

REPORT ATTRIBUTE DETAILS
Supply Chain Finance Market by Volume Yes
Supply Chain Finance Market by Value Yes
Supply Chain Finance Market, Tornado Analysis Yes
Supply Chain Finance Market, STAR Analysis Yes
Supply Chain Finance Market, SRC Analysis Yes
Supply Chain Finance Market, Import-Export Data Yes (On Demand)
Supply Chain Finance Market Pricing Analysis Yes (On Demand)
Supply Chain Finance Market Segment Analysis By Offering (Export and Import Bills

Letter of Credit, Performance Bonds, Shipping Guarantees, and Others)

By Provider (Banks, Trade Finance House, and Others)

By Application (Domestic and International)

By End Users (Large Enterprises and Small & Medium-sized Enterprises)


Supply Chain Finance Market, Regional Analysis North America (US and Canada)

Europe (Germany, UK, France, Italy, Spain, and Rest of Europe)

Asia Pacific (China, India, Japan, South Korea, South East Asia, and Rest of Asia Pacific)

Latin America (Brazil, Mexico, and Rest of Latin America)

Middle East and Africa (GCC Countries, South Africa, and Rest of Middle East and Africa)

Supply Chain Finance Market Key Companies Asian Development Bank, BNP Paribas, Bank of America Corporation, Citigroup, Inc., Eulers Herms (Allianz Trade), HSBC Group, JPMorgan Chase & Co., Mitsubishi UFJ Financial Group, Inc., Royal Bank of Scotland Plc, and Standard Chartered
Supply Chain Finance Market Competitive Landscape Market Share Analysis

Competitive Benchmarking

Key Players Market Positioning

Geographical Presence Analysis

Major Strategies Adopted

Segmentation of Global Supply Chain Finance Market-

Global Supply Chain Finance Market – By Offering

  • Export and Import Bills
  • Letter of Credit
  • Performance Bonds
  • Shipping Guarantees
  • Others

Global Supply Chain Finance Market – By Provider

  • Banks
  • Trade Finance House
  • Others

Global Supply Chain Finance Market – By Application

  • Domestic
  • International

Other Global Supply Chain Finance Market – By End User

  • Large Enterprises
  • Small and Medium-sized Enterprises

Global Supply Chain Finance Market – By Region

  • North America
    • U.S.
    • Canada
  • Europe
    • Germany
    • France
    • U.K.
    • Italy
    • Spain
    • Rest of Europe
  • Asia Pacific
    • China
    • Japan
    • India
    • South Korea
    • South-east Asia
    • Rest of Asia Pacific
  • Latin America
    • Brazil
    • Mexico
    • Rest of Latin America
  • Middle East & Africa
    • GCC Countries
    • South Africa
    • Rest of Middle East and Africa

1. Preface
1.1. Report Description
1.1.1. Purpose of the Report
1.1.2. Target Audience
1.1.3. USP and Key Offerings
1.2. Research Scope
1.3. Research Methodology
1.3.1. Phase I – Secondary Research
1.3.2. Phase II – Primary Research
1.3.3. Phase III – Expert Panel Review
1.3.4. Approach Adopted
1.3.4.1. Top-Down Approach
1.3.4.2. Bottom-Up Approach
1.3.5. Assumptions
1.4. Market Introduction
1.5. Market Research Scope

2. Executive Summary
2.1. Market Snapshot: Global Supply Chain Finance Market
2.2. Global Supply Chain Finance Market, By Offering
2.3. Global Supply Chain Finance Market, By Provider
2.4. Global Supply Chain Finance Market, By Application
2.5. Global Supply Chain Finance Market, By End User
2.6. Global Supply Chain Finance Market, By Region

3. Market Dynamics & Factors Analysis
3.1. Introduction
3.1.1. Global Supply Chain Finance Market Value, 2017-2030, (US$ Bn)
3.1.2. Y-o-Y Growth Trend Analysis
3.2. Market Dynamics
3.2.1. Market Drivers
3.2.2. Market Restraints
3.2.3. Market Opportunities
3.2.4. Major Industry Challenges
3.3. Growth and Development Patterns
3.4. Investment Feasibility Analysis
3.5. Market Opportunity Analysis
3.5.1. Offering
3.5.2. Provider
3.5.3. Application
3.5.4. End User
3.5.5. Geography

4. Premium Insights
4.1. STAR (Situation, Task, Action, Results) Analysis
4.2. Porter’s Five Forces Analysis
4.2.1. Threat of New Entrants
4.2.2. Bargaining Power of Buyers/Consumers
4.2.3. Bargaining Power of Suppliers
4.2.4. Threat of Substitute Types
4.2.5. Intensity of Competitive Rivalry
4.3. Key Market Trends
4.3.1. Demand Side Trends
4.3.2. Supply Side Trends
4.4. Value Chain Analysis
4.5. Technology Analysis
4.6. Analysis and Recommendations
4.7. Marketing Strategy Analysis
4.7.1. Direct Marketing
4.7.2. Indirect Marketing
4.7.3. Marketing Channel Development Trend

5. Market Positioning of Key Players, 2022
5.1. Company market share of key players, 2022
5.2. Competitive Benchmarking
5.3. Market Positioning of Key Vendors
5.4. Geographical Presence Analysis
5.5. Major Strategies Adopted by Key Players
5.5.1. Key Strategies Analysis
5.5.2. Mergers and Acquisitions
5.5.3. Partnerships
5.5.4. Product Launch
5.5.5. Geographical Expansion
5.5.6. Others

6. Economic Impact Analysis
6.1. Recession Impact
6.1.1. North America
6.1.2. Europe
6.1.3. Asia Pacific
6.1.4. Latin America
6.1.5. Middle East and Africa
6.2. Ukraine-Russia War Impact
6.2.1. North America
6.2.2. Europe
6.2.3. Asia Pacific
6.2.4. Latin America
6.2.5. Middle East and Africa
6.3. COVID-19 Impact Analysis
6.3.1. North America
6.3.2. Europe
6.3.3. Asia Pacific
6.3.4. Latin America
6.3.5. Middle East and Africa

7. Global Supply Chain Finance Market
7.1. Global Supply Chain Finance Market, by Offering, 2017-2030(US$ Bn)
7.1.1. Overview
7.1.2. Global Supply Chain Finance Market, By Offering, 2022 vs 2030 (in%)
7.1.3. Global Supply Chain Finance Market, By Export and Import Bills, 2017-2030 (US$ Bn)
7.1.4. Global Supply Chain Finance Market, By Letter of Credit, 2017-2030 (US$ Bn)
7.1.5. Global Supply Chain Finance Market, By Performance Bonds, 2017-2030 (US$ Bn)
7.1.6. Global Supply Chain Finance Market, By Shipping Guarantees, 2017-2030 (US$ Bn)
7.1.7. Global Supply Chain Finance Market, By Others, 2017-2030 (US$ Bn)
7.2. Global Supply Chain Finance Market, by Provider, 2017-2030(US$ Bn)
7.2.1. Overview
7.2.2. Global Supply Chain Finance Market, By Provider, 2022 vs 2030 (in%)
7.2.3. Global Supply Chain Finance Market, By Banks, 2017-2030 (US$ Bn)
7.2.4. Global Supply Chain Finance Market, By Trade Finance House, 2017-2030 (US$ Bn)
7.2.5. Global Supply Chain Finance Market, By Others, 2017-2030 (US$ Bn)
7.3. Global Supply Chain Finance Market, by Application, 2017-2030(US$ Bn)
7.3.1. Overview
7.3.2. Global Supply Chain Finance Market, By Application, 2022 vs 2030 (in%)
7.3.3. Global Supply Chain Finance Market, By Domestic, 2017-2030 (US$ Bn)
7.3.4. Global Supply Chain Finance Market, By International, 2017-2030 (US$ Bn)
7.4. Global Supply Chain Finance Market, by End User, 2017-2030(US$ Bn)
7.4.1. Overview
7.4.2. Global Supply Chain Finance Market, By End User, 2022 vs 2030 (in%)
7.4.3. Global Supply Chain Finance Market, By Large Enterprises, 2017-2030 (US$ Bn)
7.4.4. Global Supply Chain Finance Market, By Small and Medium-Sized Enterprises, 2017-2030 (US$ Bn)

8. North America Supply Chain Finance Market Analysis
8.1. North America Supply Chain Finance Market, by Offering, 2017-2030(US$ Bn)
8.1.1. Overview
8.1.2. SRC Analysis
8.2. North America Supply Chain Finance Market, by Provider, 2017-2030(US$ Bn)
8.2.1. Overview
8.2.2. SRC Analysis
8.3. North America Supply Chain Finance Market, by Application, 2017-2030(US$ Bn)
8.3.1. Overview
8.3.2. SRC Analysis
8.4. North America Supply Chain Finance Market, by End User, 2017-2030(US$ Bn)
8.4.1. Overview
8.4.2. SRC Analysis
8.5. North America Supply Chain Finance Market, by Country, 2017-2030 (US$ Bn)
8.5.1. U.S.
8.5.1.1. U.S. Supply Chain Finance Market Estimates and Forecast, 2017-2030 (US$ Bn)
8.5.1.2. U.S. Supply Chain Finance, By Offering, 2017-2030 (US$ Bn)
8.5.1.3. U.S. Supply Chain Finance, By Provider, 2017-2030 (US$ Bn)
8.5.1.4. U.S. Supply Chain Finance, By Application, 2017-2030 (US$ Bn)
8.5.1.5. U.S. Supply Chain Finance, By End User, 2017-2030 (US$ Bn)
8.5.2. Canada
8.5.2.1. Canada Supply Chain Finance Market Estimates and Forecast, 2017-2030 (US$ Bn)
8.5.2.2. Canada Supply Chain Finance, By Offering, 2017-2030 (US$ Bn)
8.5.2.3. Canada Supply Chain Finance, By Provider, 2017-2030 (US$ Bn)
8.5.2.4. Canada Supply Chain Finance, By Application, 2017-2030 (US$ Bn)
8.5.2.5. Canada Supply Chain Finance, By End User, 2017-2030 (US$ Bn)

9. Europe Supply Chain Finance Market Analysis
9.1. Europe Supply Chain Finance Market, by Offering, 2017-2030(US$ Bn)
9.1.1. Overview
9.1.2. SRC Analysis
9.2. Europe Supply Chain Finance Market, by Provider, 2017-2030(US$ Bn)
9.2.1. Overview
9.2.2. SRC Analysis
9.3. Europe Supply Chain Finance Market, by Application, 2017-2030(US$ Bn)
9.3.1. Overview
9.3.2. SRC Analysis
9.4. Europe Supply Chain Finance Market, by End User, 2017-2030(US$ Bn)
9.4.1. Overview
9.4.2. SRC Analysis
9.5. Europe Supply Chain Finance Market, by Country, 2017-2030 (US$ Bn)
9.5.1. Germany
9.5.1.1. Germany Supply Chain Finance Market Estimates and Forecast, 2017-2030 (US$ Bn)
9.5.1.2. Germany Supply Chain Finance, By Offering, 2017-2030 (US$ Bn)
9.5.1.3. Germany Supply Chain Finance, By Provider, 2017-2030 (US$ Bn)
9.5.1.4. Germany Supply Chain Finance, By Application, 2017-2030 (US$ Bn)
9.5.1.5. Germany Supply Chain Finance, By End User, 2017-2030 (US$ Bn)
9.5.2. France
9.5.2.1. France Supply Chain Finance Market Estimates and Forecast, 2017-2030 (US$ Bn)
9.5.2.2. France Supply Chain Finance, By Offering, 2017-2030 (US$ Bn)
9.5.2.3. France Supply Chain Finance, By Provider, 2017-2030 (US$ Bn)
9.5.2.4. France Supply Chain Finance, By Application, 2017-2030 (US$ Bn)
9.5.2.5. France Supply Chain Finance, By End User, 2017-2030 (US$ Bn)
9.5.3. UK
9.5.3.1. UK Supply Chain Finance Market Estimates and Forecast, 2017-2030 (US$ Bn)
9.5.3.2. UK Supply Chain Finance, By Offering, 2017-2030 (US$ Bn)
9.5.3.3. UK Supply Chain Finance, By Provider, 2017-2030 (US$ Bn)
9.5.3.4. UK Supply Chain Finance, By Application, 2017-2030 (US$ Bn)
9.5.3.5. UK Supply Chain Finance, By End User, 2017-2030 (US$ Bn)
9.5.4. Italy
9.5.4.1. Italy Supply Chain Finance Market Estimates and Forecast, 2017-2030 (US$ Bn)
9.5.4.2. Italy Supply Chain Finance, By Offering, 2017-2030 (US$ Bn)
9.5.4.3. Italy Supply Chain Finance, By Provider, 2017-2030 (US$ Bn)
9.5.4.4. Italy Supply Chain Finance, By Application, 2017-2030 (US$ Bn)
9.5.4.5. Italy Supply Chain Finance, By End User, 2017-2030 (US$ Bn)
9.5.5. Spain
9.5.5.1. Spain Supply Chain Finance Market Estimates and Forecast, 2017-2030 (US$ Bn)
9.5.5.2. Spain Supply Chain Finance, By Offering, 2017-2030 (US$ Bn)
9.5.5.3. Spain Supply Chain Finance, By Provider, 2017-2030 (US$ Bn)
9.5.5.4. Spain Supply Chain Finance, By Application, 2017-2030 (US$ Bn)
9.5.5.5. Spain Supply Chain Finance, By End User, 2017-2030 (US$ Bn)
9.5.6. Rest of Europe
9.5.6.1. Rest of Europe Supply Chain Finance Market Estimates and Forecast, 2017-2030 (US$ Bn)
9.5.6.2. Rest of Europe Supply Chain Finance, By Offering, 2017-2030 (US$ Bn)
9.5.6.3. Rest of Europe Supply Chain Finance, By Provider, 2017-2030 (US$ Bn)
9.5.6.4. Rest of Europe Supply Chain Finance, By Application, 2017-2030 (US$ Bn)
9.5.6.5. Rest of Europe Supply Chain Finance, By End User, 2017-2030 (US$ Bn)

10. Asia Pacific Supply Chain Finance Market Analysis
10.1. Asia Pacific Supply Chain Finance Market, by Offering, 2017-2030(US$ Bn)
10.1.1. Overview
10.1.2. SRC Analysis
10.2. Asia Pacific Supply Chain Finance Market, by Provider, 2017-2030(US$ Bn)
10.2.1. Overview
10.2.2. SRC Analysis
10.3. Asia Pacific Supply Chain Finance Market, by Application, 2017-2030(US$ Bn)
10.3.1. Overview
10.3.2. SRC Analysis
10.4. Asia Pacific Supply Chain Finance Market, by End User, 2017-2030(US$ Bn)
10.4.1. Overview
10.4.2. SRC Analysis
10.5. Asia Pacific Supply Chain Finance Market, by Country, 2017-2030 (US$ Bn)
10.5.1. China
10.5.1.1. China Supply Chain Finance Market Estimates and Forecast, 2017-2030 (US$ Bn)
10.5.1.2. China Supply Chain Finance, By Offering, 2017-2030 (US$ Bn)
10.5.1.3. China Supply Chain Finance, By Provider, 2017-2030 (US$ Bn)
10.5.1.4. China Supply Chain Finance, By Application, 2017-2030 (US$ Bn)
10.5.1.5. China Supply Chain Finance, By End User, 2017-2030 (US$ Bn)
10.5.2. Japan
10.5.2.1. Japan Supply Chain Finance Market Estimates and Forecast, 2017-2030 (US$ Bn)
10.5.2.2. Japan Supply Chain Finance, By Offering, 2017-2030 (US$ Bn)
10.5.2.3. Japan Supply Chain Finance, By Provider, 2017-2030 (US$ Bn)
10.5.2.4. Japan Supply Chain Finance, By Application, 2017-2030 (US$ Bn)
10.5.2.5. Japan Supply Chain Finance, By End User, 2017-2030 (US$ Bn)
10.5.3. India
10.5.3.1. India Supply Chain Finance Market Estimates and Forecast, 2017-2030 (US$ Bn)
10.5.3.2. India Supply Chain Finance, By Offering, 2017-2030 (US$ Bn)
10.5.3.3. India Supply Chain Finance, By Provider, 2017-2030 (US$ Bn)
10.5.3.4. India Supply Chain Finance, By Application, 2017-2030 (US$ Bn)
10.5.3.5. India Supply Chain Finance, By End User, 2017-2030 (US$ Bn)
10.5.4. South Korea
10.5.4.1. South Korea Supply Chain Finance Market Estimates and Forecast, 2017-2030 (US$ Bn)
10.5.4.2. South Korea Supply Chain Finance, By Offering, 2017-2030 (US$ Bn)
10.5.4.3. South Korea Supply Chain Finance, By Provider, 2017-2030 (US$ Bn)
10.5.4.4. South Korea Supply Chain Finance, By Application, 2017-2030 (US$ Bn)
10.5.4.5. South Korea Supply Chain Finance, By End User, 2017-2030 (US$ Bn)
10.5.5. South-East Asia
10.5.5.1. South-East Asia Supply Chain Finance Market Estimates and Forecast, 2017-2030 (US$ Bn)
10.5.5.2. South-East Asia Supply Chain Finance, By Offering, 2017-2030 (US$ Bn)
10.5.5.3. South-East Asia Supply Chain Finance, By Provider, 2017-2030 (US$ Bn)
10.5.5.4. South-East Asia Supply Chain Finance, By Application, 2017-2030 (US$ Bn)
10.5.5.5. South-East Asia Supply Chain Finance, By End User, 2017-2030 (US$ Bn)
10.5.6. Rest of Asia Pacific
10.5.6.1. Rest of Asia Pacific Supply Chain Finance Market Estimates and Forecast, 2017-2030 (US$ Bn)
10.5.6.2. Rest of Asia Pacific Supply Chain Finance, By Offering, 2017-2030 (US$ Bn)
10.5.6.3. Rest of Asia Pacific Supply Chain Finance, By Provider, 2017-2030 (US$ Bn)
10.5.6.4. Rest of Asia Pacific Supply Chain Finance, By Application, 2017-2030 (US$ Bn)
10.5.6.5. Rest of Asia Pacific Supply Chain Finance, By End User, 2017-2030 (US$ Bn)

11. Latin America Supply Chain Finance Market Analysis
11.1. Latin America Supply Chain Finance Market, by Offering, 2017-2030(US$ Bn)
11.1.1. Overview
11.1.2. SRC Analysis
11.2. Latin America Supply Chain Finance Market, by Provider, 2017-2030(US$ Bn)
11.2.1. Overview
11.2.2. SRC Analysis
11.3. Latin America Supply Chain Finance Market, by Application, 2017-2030(US$ Bn)
11.3.1. Overview
11.3.2. SRC Analysis
11.4. Latin America Supply Chain Finance Market, by End User, 2017-2030(US$ Bn)
11.4.1. Overview
11.4.2. SRC Analysis
11.5. Latin America Supply Chain Finance Market, by Country, 2017-2030 (US$ Bn)
11.5.1. Brazil
11.5.1.1. Brazil Supply Chain Finance Market Estimates and Forecast, 2017-2030 (US$ Bn)
11.5.1.2. Brazil Supply Chain Finance, By Offering, 2017-2030 (US$ Bn)
11.5.1.3. Brazil Supply Chain Finance, By Provider, 2017-2030 (US$ Bn)
11.5.1.4. Brazil Supply Chain Finance, By Application, 2017-2030 (US$ Bn)
11.5.1.5. Brazil Supply Chain Finance, By End User, 2017-2030 (US$ Bn)
11.5.2. Mexico
11.5.2.1. Mexico Supply Chain Finance Market Estimates and Forecast, 2017-2030 (US$ Bn)
11.5.2.2. Mexico Supply Chain Finance, By Offering, 2017-2030 (US$ Bn)
11.5.2.3. Mexico Supply Chain Finance, By Provider, 2017-2030 (US$ Bn)
11.5.2.4. Mexico Supply Chain Finance, By Application, 2017-2030 (US$ Bn)
11.5.2.5. Mexico Supply Chain Finance, By End User, 2017-2030 (US$ Bn)
11.5.3. Rest of Latin America
11.5.3.1. Rest of Latin America Supply Chain Finance Market Estimates and Forecast, 2017-2030 (US$ Bn)
11.5.3.2. Rest of Latin America Supply Chain Finance, By Offering, 2017-2030 (US$ Bn)
11.5.3.3. Rest of Latin America Supply Chain Finance, By Provider, 2017-2030 (US$ Bn)
11.5.3.4. Rest of Latin America Supply Chain Finance, By Application, 2017-2030 (US$ Bn)
11.5.3.5. Rest of Latin America Supply Chain Finance, By End User, 2017-2030 (US$ Bn)

12. Middle East and Africa Supply Chain Finance Market Analysis
12.1. Middle East and Africa Supply Chain Finance Market, by Offering, 2017-2030(US$ Bn)
12.1.1. Overview
12.1.2. SRC Analysis
12.2. Middle East and Africa Supply Chain Finance Market, by Provider, 2017-2030(US$ Bn)
12.2.1. Overview
12.2.2. SRC Analysis
12.3. Middle East and Africa Supply Chain Finance Market, by Application, 2017-2030(US$ Bn)
12.3.1. Overview
12.3.2. SRC Analysis
12.4. Middle East and Africa Supply Chain Finance Market, by End User, 2017-2030(US$ Bn)
12.4.1. Overview
12.4.2. SRC Analysis
12.5. Middle East and Africa Supply Chain Finance Market, by Country, 2017-2030 (US$ Bn)
12.5.1. GCC Countries
12.5.1.1. GCC Countries il Supply Chain Finance Market Estimates and Forecast, 2017-2030 (US$ Bn)
12.5.1.2. GCC Countries Supply Chain Finance, By Offering, 2017-2030 (US$ Bn)
12.5.1.3. GCC Countries Supply Chain Finance, By Provider, 2017-2030 (US$ Bn)
12.5.1.4. GCC Countries Supply Chain Finance, By Application, 2017-2030 (US$ Bn)
12.5.1.5. GCC Countries Supply Chain Finance, By End User, 2017-2030 (US$ Bn)
12.5.2. South Africa
12.5.2.1. South Africa Supply Chain Finance Market Estimates and Forecast, 2017-2030 (US$ Bn)
12.5.2.2. South Africa Supply Chain Finance, By Offering, 2017-2030 (US$ Bn)
12.5.2.3. South Africa Supply Chain Finance, By Provider, 2017-2030 (US$ Bn)
12.5.2.4. South Africa Supply Chain Finance, By Application, 2017-2030 (US$ Bn)
12.5.2.5. South Africa Supply Chain Finance, By End User, 2017-2030 (US$ Bn)
12.5.3. Rest of Middle East and Africa
12.5.3.1. Rest of Middle East and Africa Supply Chain Finance Market Estimates and Forecast, 2017-2030 (US$ Bn)
12.5.3.2. Rest of Middle East and Africa Supply Chain Finance, By Offering, 2017-2030 (US$ Bn)
12.5.3.3. Rest of Middle East and Africa Supply Chain Finance, By Provider, 2017-2030 (US$ Bn)
12.5.3.4. Rest of Middle East and Africa Supply Chain Finance, By Application, 2017-2030 (US$ Bn)
12.5.3.5. Rest of Middle East and Africa Supply Chain Finance, By End User, 2017-2030 (US$ Bn)

13. Company Profiles
13.1. Asian Development Bank
13.1.1. Company Overview
13.1.2. Products/Services Portfolio
13.1.3. Geographical Presence
13.1.4. Financial Summary
13.1.4.1. Market Revenue and Net Profit (2019-2022)
13.1.4.2. Business Segment Revenue Analysis
13.1.4.3. Geographical Revenue Analysis
13.2. BNP Paribas
13.3. Bank of America Corporation
13.4. Citigroup, Inc.
13.5. Eulers Herms (Allianz Trade)
13.6. HSBC Group
13.7. JPMorgan Chase & Co.
13.8. Mitsubishi UFJ Financial Group, Inc.
13.9. Royal Bank of Scotland Plc
13.10. Standard Chartered

List of Figures
FIG. 1 Global Supply Chain Finance Market: Research Methodology
FIG. 2 Market Size Estimation – Top Down & Bottom up Approach
FIG. 3 Global Supply Chain Finance Market Segmentation
FIG. 4 Global Supply Chain Finance Market, by Offering, 2022 (US$ Bn)
FIG. 5 Global Supply Chain Finance Market, by Provider, 2022 (US$ Bn)
FIG. 6 Global Supply Chain Finance Market, by Application Type, 2022 (US$ Bn)
FIG. 7 Global Supply Chain Finance Market, by End User, 2022 (US$ Bn)
FIG. 8 Global Supply Chain Finance Market, by Geography, 2022 (US$ Bn)
FIG. 9 Attractive Investment Proposition, by Offering, 2022
FIG. 10 Attractive Investment Proposition, by Provider, 2022
FIG. 11 Attractive Investment Proposition, by Application Type, 2022
FIG. 12 Attractive Investment Proposition, by End User, 2022
FIG. 13 Attractive Investment Proposition, by Geography, 2022
FIG. 14 Global Market Share Analysis of Key Supply Chain Finance Market Manufacturers, 2022
FIG. 15 Global Market Positioning of Key Supply Chain Finance Market Manufacturers, 2022
FIG. 16 Global Supply Chain Finance Market Value Contribution, By Offering, 2022 & 2030 (Value %)
FIG. 17 Global Supply Chain Finance Market, by Export and Import Bills, Value, 2017-2030 (US$ Bn)
FIG. 18 Global Supply Chain Finance Market, by Letter of Credit, Value, 2017-2030 (US$ Bn)
FIG. 19 Global Supply Chain Finance Market, by Performance Bonds, Value, 2017-2030 (US$ Bn)
FIG. 20 Global Supply Chain Finance Market, by Shipping Guarantees, Value, 2017-2030 (US$ Bn)
FIG. 21 Global Supply Chain Finance Market, by Others, Value, 2017-2030 (US$ Bn)
FIG. 22 Global Supply Chain Finance Market Value Contribution, By Provider, 2022 & 2030 (Value %)
FIG. 23 Global Supply Chain Finance Market, by Banks, Value, 2017-2030 (US$ Bn)
FIG. 24 Global Supply Chain Finance Market, by Trade Finance House, Value, 2017-2030 (US$ Bn)
FIG. 25 Global Supply Chain Finance Market, by Others, Value, 2017-2030 (US$ Bn)
FIG. 26 Global Supply Chain Finance Market Value Contribution, By Application, 2022 & 2030 (Value %)
FIG. 27 Global Supply Chain Finance Market, by Domestic, Value, 2017-2030 (US$ Bn)
FIG. 28 Global Supply Chain Finance Market, by International, Value, 2017-2030 (US$ Bn)
FIG. 29 Global Supply Chain Finance Market Value Contribution, By End User, 2022 & 2030 (Value %)
FIG. 30 Global Supply Chain Finance Market, by Large Enterprises, Value, 2017-2030 (US$ Bn)
FIG. 31 Global Supply Chain Finance Market, by Small and Medium-sized Enterprises, Value, 2017-2030 (US$ Bn)
FIG. 32 U.S. Supply Chain Finance Market, 2017-2030 (US$ Bn)
FIG. 33 Canada Supply Chain Finance Market, 2017-2030 (US$ Bn)
FIG. 34 Germany Supply Chain Finance Market, 2017-2030 (US$ Bn)
FIG. 35 France Supply Chain Finance Market, 2017-2030 (US$ Bn)
FIG. 36 U.K. Supply Chain Finance Market, 2017-2030 (US$ Bn)
FIG. 37 Italy Supply Chain Finance Market, 2017-2030 (US$ Bn)
FIG. 38 Spain Supply Chain Finance Market, 2017-2030 (US$ Bn)
FIG. 39 Rest of Europe Supply Chain Finance Market, 2017-2030 (US$ Bn)
FIG. 40 China Supply Chain Finance Market, 2017-2030 (US$ Bn)
FIG. 41 Japan Supply Chain Finance Market, 2017-2030 (US$ Bn)
FIG. 42 India Supply Chain Finance Market, 2017-2030 (US$ Bn)
FIG. 43 South Korea Supply Chain Finance Market, 2017-2030 (US$ Bn)
FIG. 44 Southeast Asia Supply Chain Finance Market, 2017-2030 (US$ Bn)
FIG. 45 Rest of Asia Pacific Supply Chain Finance Market, 2017-2030 (US$ Bn)
FIG. 46 Latin America Supply Chain Finance Market, 2017-2030 (US$ Bn)
FIG. 47 Brazil Supply Chain Finance Market, 2017-2030 (US$ Bn)
FIG. 48 Mexico Supply Chain Finance Market, 2017-2030 (US$ Bn)
FIG. 49 Rest of Latin America Supply Chain Finance Market, 2017-2030 (US$ Bn)
FIG. 50 Middle East & Africa Supply Chain Finance Market, 2017-2030 (US$ Bn)
FIG. 51 GCC Countries Supply Chain Finance Market, 2017-2030 (US$ Bn)
FIG. 52 South Africa Supply Chain Finance Market, 2017-2030 (US$ Bn)
FIG. 53 Rest of Middle East and Africa Supply Chain Finance Market, 2017-2030 (US$ Bn)

List of Tables
TABLE 1 Market Snapshot: Global Supply Chain Finance Market
TABLE 2 Global Supply Chain Finance Market, by Competitive Benchmarking, 2022
TABLE 3 Global Supply Chain Finance Market, by Geographical Presence Analysis, 2022
TABLE 4 Global Supply Chain Finance Market, by Key Strategies Analysis, 2022
TABLE 5 Global Supply Chain Finance Market, by Offering, 2017-2030 (US$ Bn)
TABLE 6 Global Supply Chain Finance Market, by Provider, 2017-2030 (US$ Bn)
TABLE 7 Global Supply Chain Finance Market, by Application, 2017-2030 (US$ Bn)
TABLE 8 Global Supply Chain Finance Market, by End User, 2017-2030 (US$ Bn)
TABLE 9 Global Supply Chain Finance Market, by Geography, 2017-2030 (US$ Bn)
TABLE 10 North America Supply Chain Finance Market, by Offering, 2017-2030 (US$ Bn)
TABLE 11 North America Supply Chain Finance Market, by Provider, 2017-2030 (US$ Bn)
TABLE 12 North America Supply Chain Finance Market, by Application, 2017-2030 (US$ Bn)
TABLE 13 North America Supply Chain Finance Market, by End User, 2017-2030 (US$ Bn)
TABLE 14 North America Supply Chain Finance Market, by Country, 2017-2030 (US$ Bn)
TABLE 15 US Supply Chain Finance Market, by Offering, 2017-2030 (US$ Bn)
TABLE 16 US Supply Chain Finance Market, by Provider, 2017-2030 (US$ Bn)
TABLE 17 US Supply Chain Finance Market, by Application, 2017-2030 (US$ Bn)
TABLE 18 US Supply Chain Finance Market, by End User, 2017-2030 (US$ Bn)
TABLE 19 Canada Supply Chain Finance Market, by Offering, 2017-2030 (US$ Bn)
TABLE 20 Canada Supply Chain Finance Market, by Provider, 2017-2030 (US$ Bn)
TABLE 21 Canada Supply Chain Finance Market, by Application, 2017-2030 (US$ Bn)
TABLE 22 Canada Supply Chain Finance Market, by End User, 2017-2030 (US$ Bn)
TABLE 23 Europe Supply Chain Finance Market, by Offering, 2017-2030 (US$ Bn)
TABLE 24 Europe Supply Chain Finance Market, by Provider, 2017-2030 (US$ Bn)
TABLE 25 Europe Supply Chain Finance Market, by Application, 2017-2030 (US$ Bn)
TABLE 26 Europe Supply Chain Finance Market, by End User, 2017-2030 (US$ Bn)
TABLE 27 Europe Supply Chain Finance Market, by Country, 2017-2030 (US$ Bn)
TABLE 28 Germany Supply Chain Finance Market, by Offering, 2017-2030 (US$ Bn)
TABLE 29 Germany Supply Chain Finance Market, by Provider, 2017-2030 (US$ Bn)
TABLE 30 Germany Supply Chain Finance Market, by Application, 2017-2030 (US$ Bn)
TABLE 31 Germany Supply Chain Finance Market, by End User, 2017-2030 (US$ Bn)
TABLE 32 France Supply Chain Finance Market, by Offering, 2017-2030 (US$ Bn)
TABLE 33 France Supply Chain Finance Market, by Provider, 2017-2030 (US$ Bn)
TABLE 34 France Supply Chain Finance Market, by Application, 2017-2030 (US$ Bn)
TABLE 35 France Supply Chain Finance Market, by End User, 2017-2030 (US$ Bn)
TABLE 36 UK Supply Chain Finance Market, by Offering, 2017-2030 (US$ Bn)
TABLE 37 UK Supply Chain Finance Market, by Provider, 2017-2030 (US$ Bn)
TABLE 38 UK Supply Chain Finance Market, by Application, 2017-2030 (US$ Bn)
TABLE 39 UK Supply Chain Finance Market, by End User, 2017-2030 (US$ Bn)
TABLE 40 Italy Supply Chain Finance Market, by Offering, 2017-2030 (US$ Bn)
TABLE 41 Italy Supply Chain Finance Market, by Provider, 2017-2030 (US$ Bn)
TABLE 42 Italy Supply Chain Finance Market, by Application, 2017-2030 (US$ Bn)
TABLE 43 Italy Supply Chain Finance Market, by End User, 2017-2030 (US$ Bn)
TABLE 44 Spain Supply Chain Finance Market, by Offering, 2017-2030 (US$ Bn)
TABLE 45 Spain Supply Chain Finance Market, by Provider, 2017-2030 (US$ Bn)
TABLE 46 Spain Supply Chain Finance Market, by Application, 2017-2030 (US$ Bn)
TABLE 47 Spain Supply Chain Finance Market, by End User, 2017-2030 (US$ Bn)
TABLE 48 Rest of Europe Supply Chain Finance Market, by Offering, 2017-2030 (US$ Bn)
TABLE 49 Rest of Europe Supply Chain Finance Market, by Provider, 2017-2030 (US$ Bn)
TABLE 50 Rest of Europe Supply Chain Finance Market, by Application, 2017-2030 (US$ Bn)
TABLE 51 Rest of Europe Supply Chain Finance Market, by End User, 2017-2030 (US$ Bn)
TABLE 52 Asia Pacific Supply Chain Finance Market, by Offering, 2017-2030 (US$ Bn)
TABLE 53 Asia Pacific Supply Chain Finance Market, by Provider, 2017-2030 (US$ Bn)
TABLE 54 Asia Pacific Supply Chain Finance Market, by Application, 2017-2030 (US$ Bn)
TABLE 55 Asia Pacific Supply Chain Finance Market, by End User, 2017-2030 (US$ Bn)
TABLE 56 Asia Pacific Supply Chain Finance Market, by Country, 2017-2030 (US$ Bn)
TABLE 57 China Supply Chain Finance Market, by Offering, 2017-2030 (US$ Bn)
TABLE 58 China Supply Chain Finance Market, by Provider, 2017-2030 (US$ Bn)
TABLE 59 China Supply Chain Finance Market, by Application, 2017-2030 (US$ Bn)
TABLE 60 China Supply Chain Finance Market, by End User, 2017-2030 (US$ Bn)
TABLE 61 Japan Supply Chain Finance Market, by Offering, 2017-2030 (US$ Bn)
TABLE 62 Japan Supply Chain Finance Market, by Provider, 2017-2030 (US$ Bn)
TABLE 63 Japan Supply Chain Finance Market, by Application, 2017-2030 (US$ Bn)
TABLE 64 Japan Supply Chain Finance Market, by End User, 2017-2030 (US$ Bn)
TABLE 65 India Supply Chain Finance Market, by Offering, 2017-2030 (US$ Bn)
TABLE 66 India Supply Chain Finance Market, by Provider, 2017-2030 (US$ Bn)
TABLE 67 India Supply Chain Finance Market, by Application, 2017-2030 (US$ Bn)
TABLE 68 India Supply Chain Finance Market, by End User, 2017-2030 (US$ Bn)
TABLE 69 South Korea Supply Chain Finance Market, by Offering, 2017-2030 (US$ Bn)
TABLE 70 South Korea Supply Chain Finance Market, by Provider, 2017-2030 (US$ Bn)
TABLE 71 South Korea Supply Chain Finance Market, by Application, 2017-2030 (US$ Bn)
TABLE 72 South Korea Supply Chain Finance Market, by End User, 2017-2030 (US$ Bn)
TABLE 73 South East Asia Supply Chain Finance Market, by Offering, 2017-2030 (US$ Bn)
TABLE 74 South East Asia Supply Chain Finance Market, by Provider, 2017-2030 (US$ Bn)
TABLE 75 South East Asia Supply Chain Finance Market, by Application, 2017-2030 (US$ Bn)
TABLE 76 South East Asia Supply Chain Finance Market, by End User, 2017-2030 (US$ Bn)
TABLE 77 Rest of Asia Pacific Supply Chain Finance Market, by Offering, 2017-2030 (US$ Bn)
TABLE 78 Rest of Asia Pacific Supply Chain Finance Market, by Provider, 2017-2030 (US$ Bn)
TABLE 79 Rest of Asia Pacific Supply Chain Finance Market, by Application, 2017-2030 (US$ Bn)
TABLE 80 Rest of Asia Pacific Supply Chain Finance Market, by End User, 2017-2030 (US$ Bn)
TABLE 81 Latin America Supply Chain Finance Market, by Offering, 2017-2030 (US$ Bn)
TABLE 82 Latin America Supply Chain Finance Market, by Provider, 2017-2030 (US$ Bn)
TABLE 83 Latin America Supply Chain Finance Market, by Application, 2017-2030 (US$ Bn)
TABLE 84 Latin America Supply Chain Finance Market, by End User, 2017-2030 (US$ Bn)
TABLE 85 Latin America Supply Chain Finance Market, by Country, 2017-2030 (US$ Bn)
TABLE 86 Brazil Supply Chain Finance Market, by Offering, 2017-2030 (US$ Bn)
TABLE 87 Brazil Supply Chain Finance Market, by Provider, 2017-2030 (US$ Bn)
TABLE 88 Brazil Supply Chain Finance Market, by Application, 2017-2030 (US$ Bn)
TABLE 89 Brazil Supply Chain Finance Market, by End User, 2017-2030 (US$ Bn)
TABLE 90 Mexico Supply Chain Finance Market, by Offering, 2017-2030 (US$ Bn)
TABLE 91 Mexico Supply Chain Finance Market, by Provider, 2017-2030 (US$ Bn)
TABLE 92 Mexico Supply Chain Finance Market, by Application, 2017-2030 (US$ Bn)
TABLE 93 Mexico Supply Chain Finance Market, by End User, 2017-2030 (US$ Bn)
TABLE 94 Rest of Latin America Supply Chain Finance Market, by Offering, 2017-2030 (US$ Bn)
TABLE 95 Rest of Latin America Supply Chain Finance Market, by Provider, 2017-2030 (US$ Bn)
TABLE 96 Rest of Latin America Supply Chain Finance Market, by Application, 2017-2030 (US$ Bn)
TABLE 97 Rest of Latin America Supply Chain Finance Market, by End User, 2017-2030 (US$ Bn)
TABLE 98 Middle East and Africa Supply Chain Finance Market, by Offering, 2017-2030 (US$ Bn)
TABLE 99 Middle East and Africa Supply Chain Finance Market, by Provider, 2017-2030 (US$ Bn)
TABLE 100 Middle East and Africa Supply Chain Finance Market, by Application, 2017-2030 (US$ Bn)
TABLE 101 Middle East and Africa Supply Chain Finance Market, by End User, 2017-2030 (US$ Bn)
TABLE 102 Middle East and Africa Supply Chain Finance Market, by Country, 2017-2030 (US$ Bn)
TABLE 103 GCC Countries Supply Chain Finance Market, by Offering, 2017-2030 (US$ Bn)
TABLE 104 GCC Countries Supply Chain Finance Market, by Provider, 2017-2030 (US$ Bn)
TABLE 105 GCC Countries Supply Chain Finance Market, by Application, 2017-2030 (US$ Bn)
TABLE 106 GCC Countries Supply Chain Finance Market, by End User, 2017-2030 (US$ Bn)
TABLE 107 South Africa Supply Chain Finance Market, by Offering, 2017-2030 (US$ Bn)
TABLE 108 South Africa Supply Chain Finance Market, by Provider, 2017-2030 (US$ Bn)
TABLE 109 South Africa Supply Chain Finance Market, by Application, 2017-2030 (US$ Bn)
TABLE 110 South Africa Supply Chain Finance Market, by End User, 2017-2030 (US$ Bn)
TABLE 111 Rest of Middle East and Africa Supply Chain Finance Market, by Offering, 2017-2030 (US$ Bn)
TABLE 112 Rest of Middle East and Africa Supply Chain Finance Market, by Provider, 2017-2030 (US$ Bn)
TABLE 113 Rest of Middle East and Africa Supply Chain Finance Market, by Application, 2017-2030 (US$ Bn)
TABLE 114 Rest of Middle East and Africa Supply Chain Finance Market, by End User, 2017-2030 (US$ Bn)

Frequently asked questions

How does COVID-19 impact the global supply chain finance market?

COVID-19 pandemic has negatively impacted the growth of the global supply chain finance market due to the surge in remote working activities creating the daunting task of capturing data from many locations and sources for the supply chain finance firms.

Which is the leading region of the market for supply chain finance?

Asia-Pacific accounted for the most heightened share in the global supply chain finance market.

What are the key drivers for the growth of the supply chain finance market?

The rise in competition in the supply chain finance business and the need for safety and security of supplying activities drive the supply chain finance market.

Which is the major segment in the supply chain finance market by offering?

The export and import bills segment had a major share in the global market in 2022.

Which is the major segment in the supply chain finance market by the provider?

The bank’s segment had a major share in the global market.

Which is the major segment in the supply chain finance market by application?

The domestic segment had a major global market share in 2022.

Which is the major segment in the supply chain finance market by end-user?

The small and medium-sized enterprises segment had a major share in the global market.

Saudi Arabia Managed Security Services Market

Published:
Report ID: 36393

Microwave Oven Market

Published:
Report ID: 36314

Inkjet Coders Market

Published:
Report ID: 6669

Rich Communication Services Market

Published:
Report ID: 35774

Middle East and Africa Real-Time Payments Market

Published:
Report ID: 35770

Vietnam Managed Security Services (MSS) Market

Published:
Report ID: 35766

Middle East and Africa EdTech and Smart Classroom Market

Published:
Report ID: 35756

Digital Business Support System (DBSS) Market

Published:
Report ID: 35732

China Artificial Intelligence (AI) Market

Published:
Report ID: 35729

Asia-Pacific Workforce Management Software Market

Published:
Report ID: 35719

Mobile Wallet Market

Published:
Report ID: 8977

Recirculating Chillers Market

Published:
Report ID: 8862

Purchase Options

$2999
Delivery Format: Excel.
$4999
Designed for the individual purchaser.
$6999
Users located at a single corporate site or regional office.
$7999
Allowed for unlimited sharing globally within one company.
Smallform of Sample request

Have a question?

User Profile

Don’t settle for less – trust Mitul to help you find the best solution.

Report delivery within 24 to 48 hours

– Other Info –

What people say?-

User Review

I am very impressed with the information in this report. The author clearly did their research when they came up with this product and it has already given me a lot of ideas.

Jana Schmidt
CEDAR CX Technologies

– Connect with us –

Phone

+91 6232 49 3207


support

24/7 Research Support


sales@credenceresearch.com

– Research Methodology –

Going beyond the basics: advanced techniques in research methodology

– Trusted By –

Pepshi, LG, Nestle
Motorola, Honeywell, Johnson and johnson
LG Chem, SIEMENS, Pfizer
Unilever, Samsonite, QIAGEN