
Shoppable streams move from TV studios to social feeds
The United States live video commerce market was valued at USD 14.63 billion in 2025 and is projected to increase from USD 19.20 billion in 2026 to USD 93.35 billion by 2035, registering a CAGR of 19.21% during 2026–2035. Demand comes from viewers who shop inside social feeds and from collectors who bid in real-time auctions on cards, coins and luxury goods. The South held the largest regional share, 37.5% in 2025, and it is also the fastest-growing region at 19.6% a year as its population keeps expanding. TikTok Shop, Whatnot, YouTube and eBay are competing for sellers with lower fees, creator commissions and new auction tools. The establishment of the TikTok USDS Joint Venture in January 2026 removed a ban risk that had held back some brand budgets.
Merchandise sold through live shoppable video defines the market
The market counts the merchandise value of goods sold during, or directly attributed to, live shoppable video in the United States. It covers hosted demonstrations, creator-led streams, live auctions, shoppable streaming on TV and one-to-one video consultations, sold through social apps, marketplaces, retailer apps and connected TV channels. Revenue models include retail margin, marketplace and affiliate commissions, sponsorship income and platform subscription fees.
Ordinary online orders with no measurable live video interaction are excluded, as are pre-recorded ads that cannot be shopped. The value chain runs from brands, resellers and collectors through hosts and creators to the platforms that run the stream, the checkout and buyer protection.
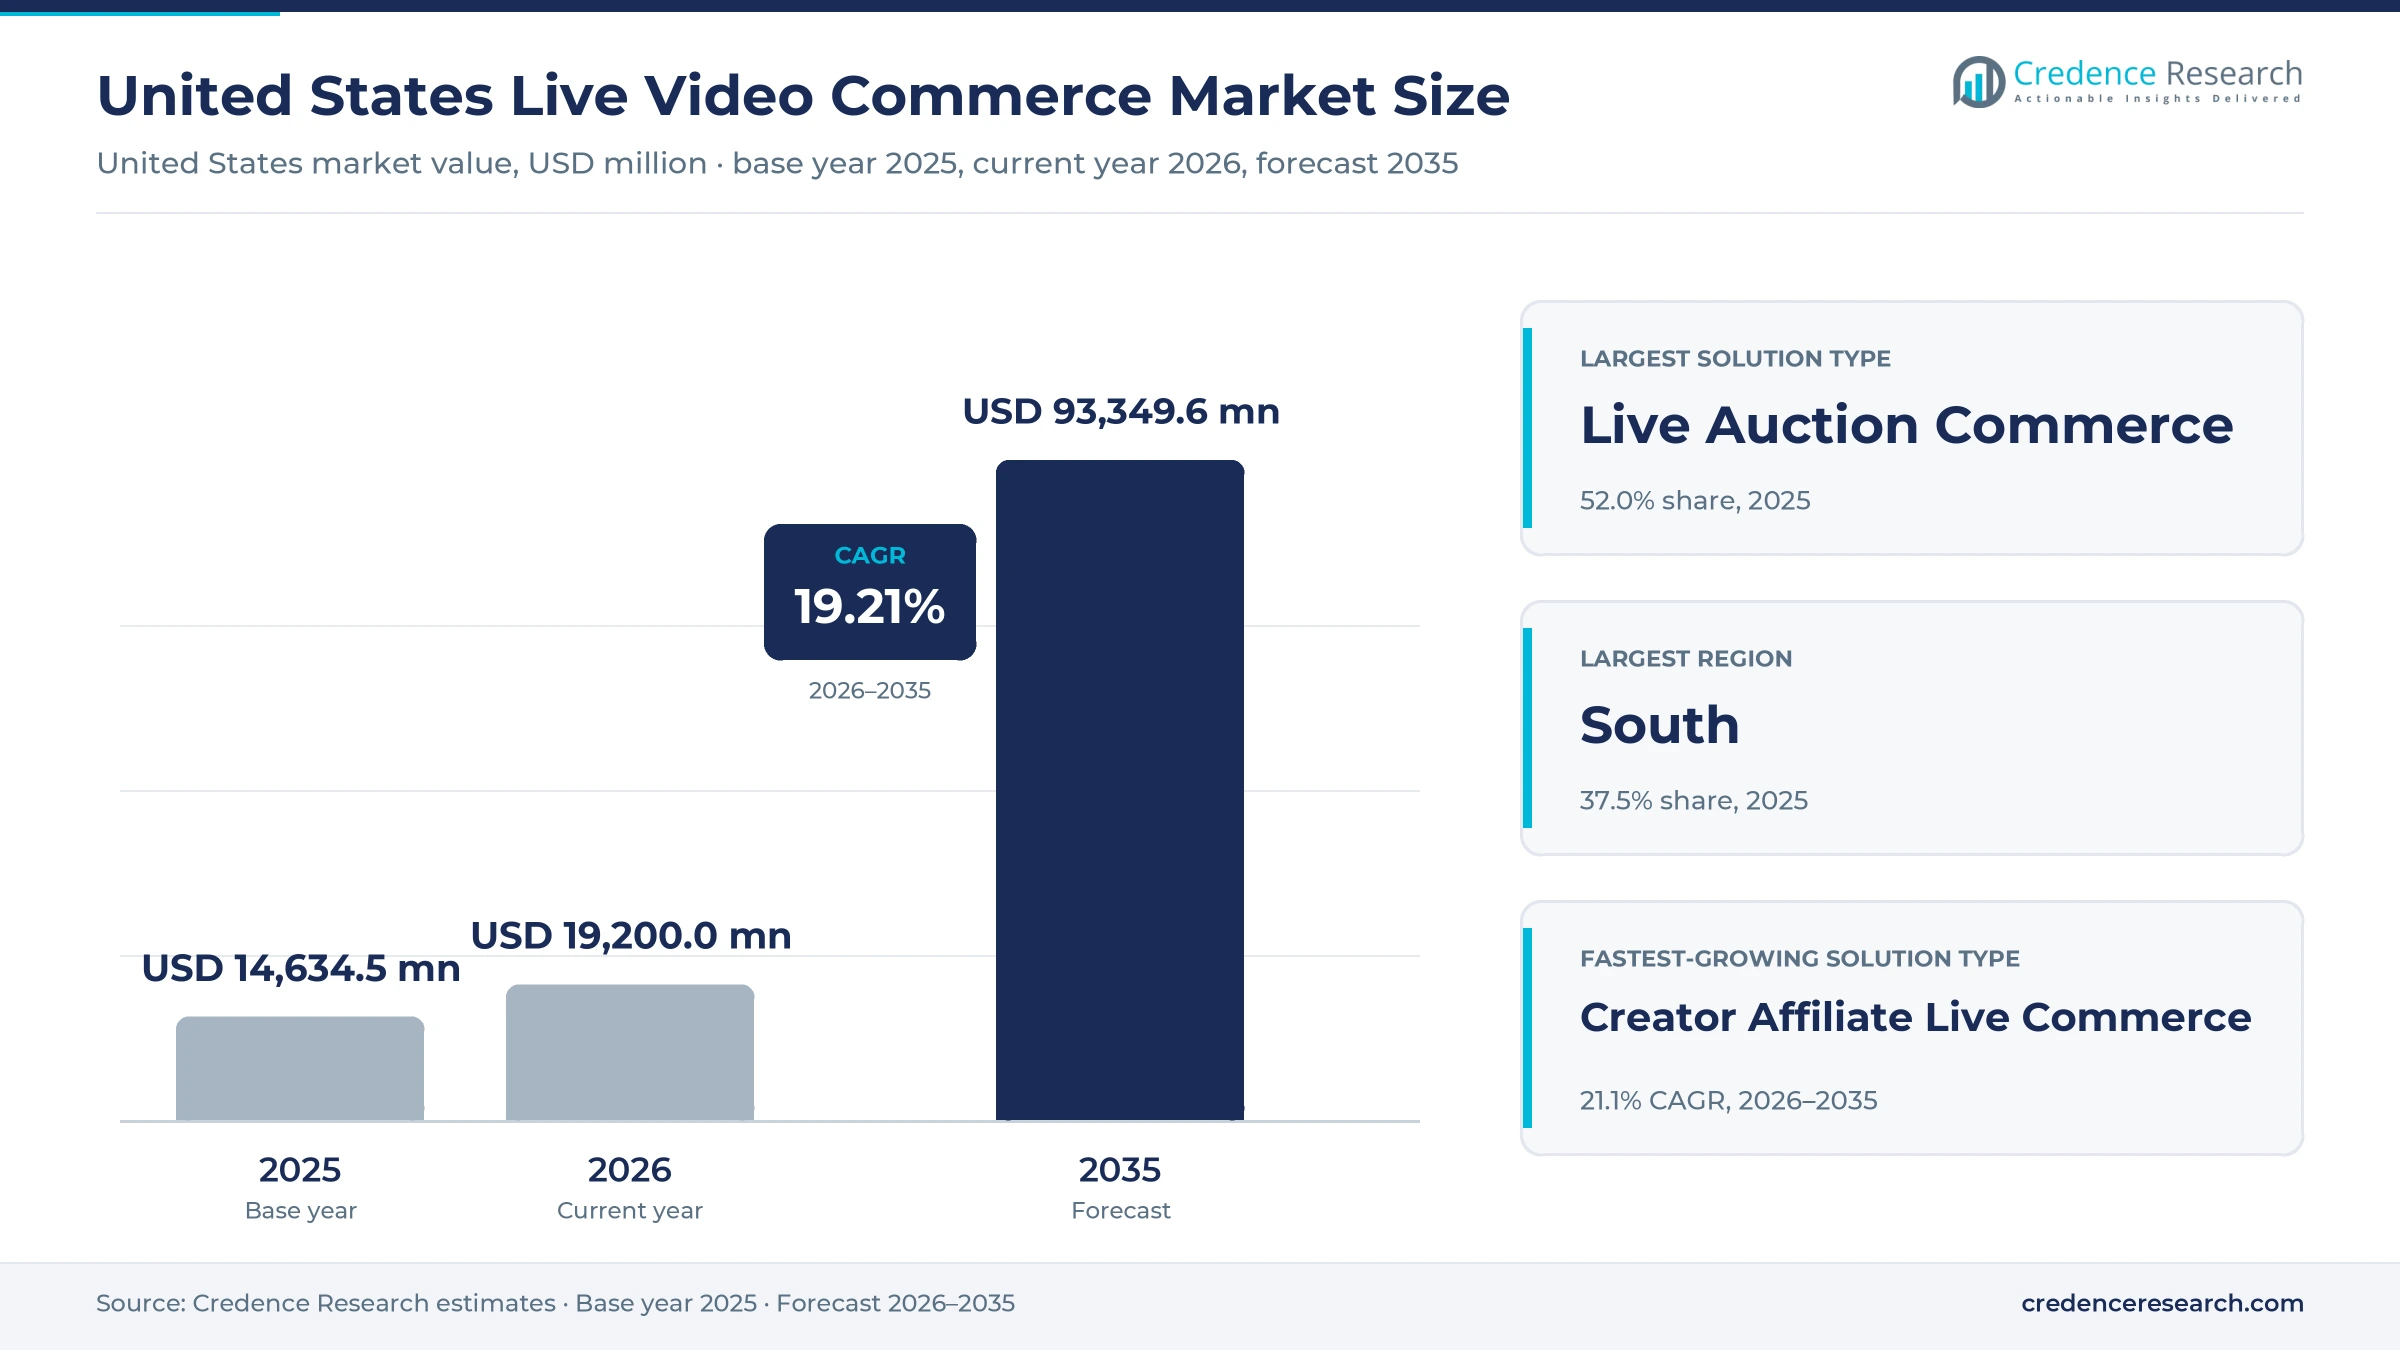
United States Live Video Commerce Market Insights
- The United States live video commerce market grows from USD 14.63 billion in 2025 to USD 93.35 billion by 2035 at a 19.21% CAGR as social, marketplace and TV channels add shoppable streams.
- The South held the largest regional share at 37.5% in 2025 and also grows fastest, helped by 6.0% population growth from 2020 to 2025.
- Live Auction Commerce led solution types with 52.0% in 2025, and Whatnot, the largest live auction app, generated $8 billion of live-sale merchandise value worldwide that year.
- QVC Group moved to 24/7 live shopping on TikTok in April 2025 and won court approval for its restructuring plan in July 2026.
- Whatnot raised $545 million at a $20 billion valuation in August 2026, a sign that investors expect live auctions to keep gaining buyers.
Auctions lead while creator affiliate selling grows fastest
Live auctions hold the largest share as creator selling scales
Based on solution type, the market is categorized into hosted demonstration retail, creator affiliate live commerce, live auction commerce, shoppable streaming and one-to-one video selling. Live Auction Commerce led with 52.0% of 2025 value because collectors bid in real time on cards, coins and luxury items, and Whatnot, the largest live auction app, generated $8 billion of live-sale merchandise value worldwide in 2025, according to Tubefilter. Creator Affiliate Live Commerce grows fastest at 21.1% a year as TikTok said its U.S. livestream sales more than doubled in the first half of 2026, according to Digital Today. Creators are paid on each sale, so brands can pay for results instead of airtime.
Marketplaces lead while social platforms gain live share
Based on deployment model, the market is categorized into social platform native, marketplace integrated, retailer-owned platform, FAST and connected TV, and syndicated multi-platform. Marketplace Integrated led with 55.0% of 2025 value because Whatnot, eBay Live and Amazon Live attach streams to existing catalogs, payments and buyer protection, and Whatnot recorded more than $75 million of live sales on Black Friday 2025, about triple a year earlier, according to Modern Retail. Social Platform Native grows fastest at 20.8% a year as live sessions rose from 10% to 14% of TikTok Shop U.S. merchandise value in 2025, according to Momentum Works. Short video still sells more on TikTok, which leaves room for live formats to gain share.
Collectibles lead while beauty gains fastest
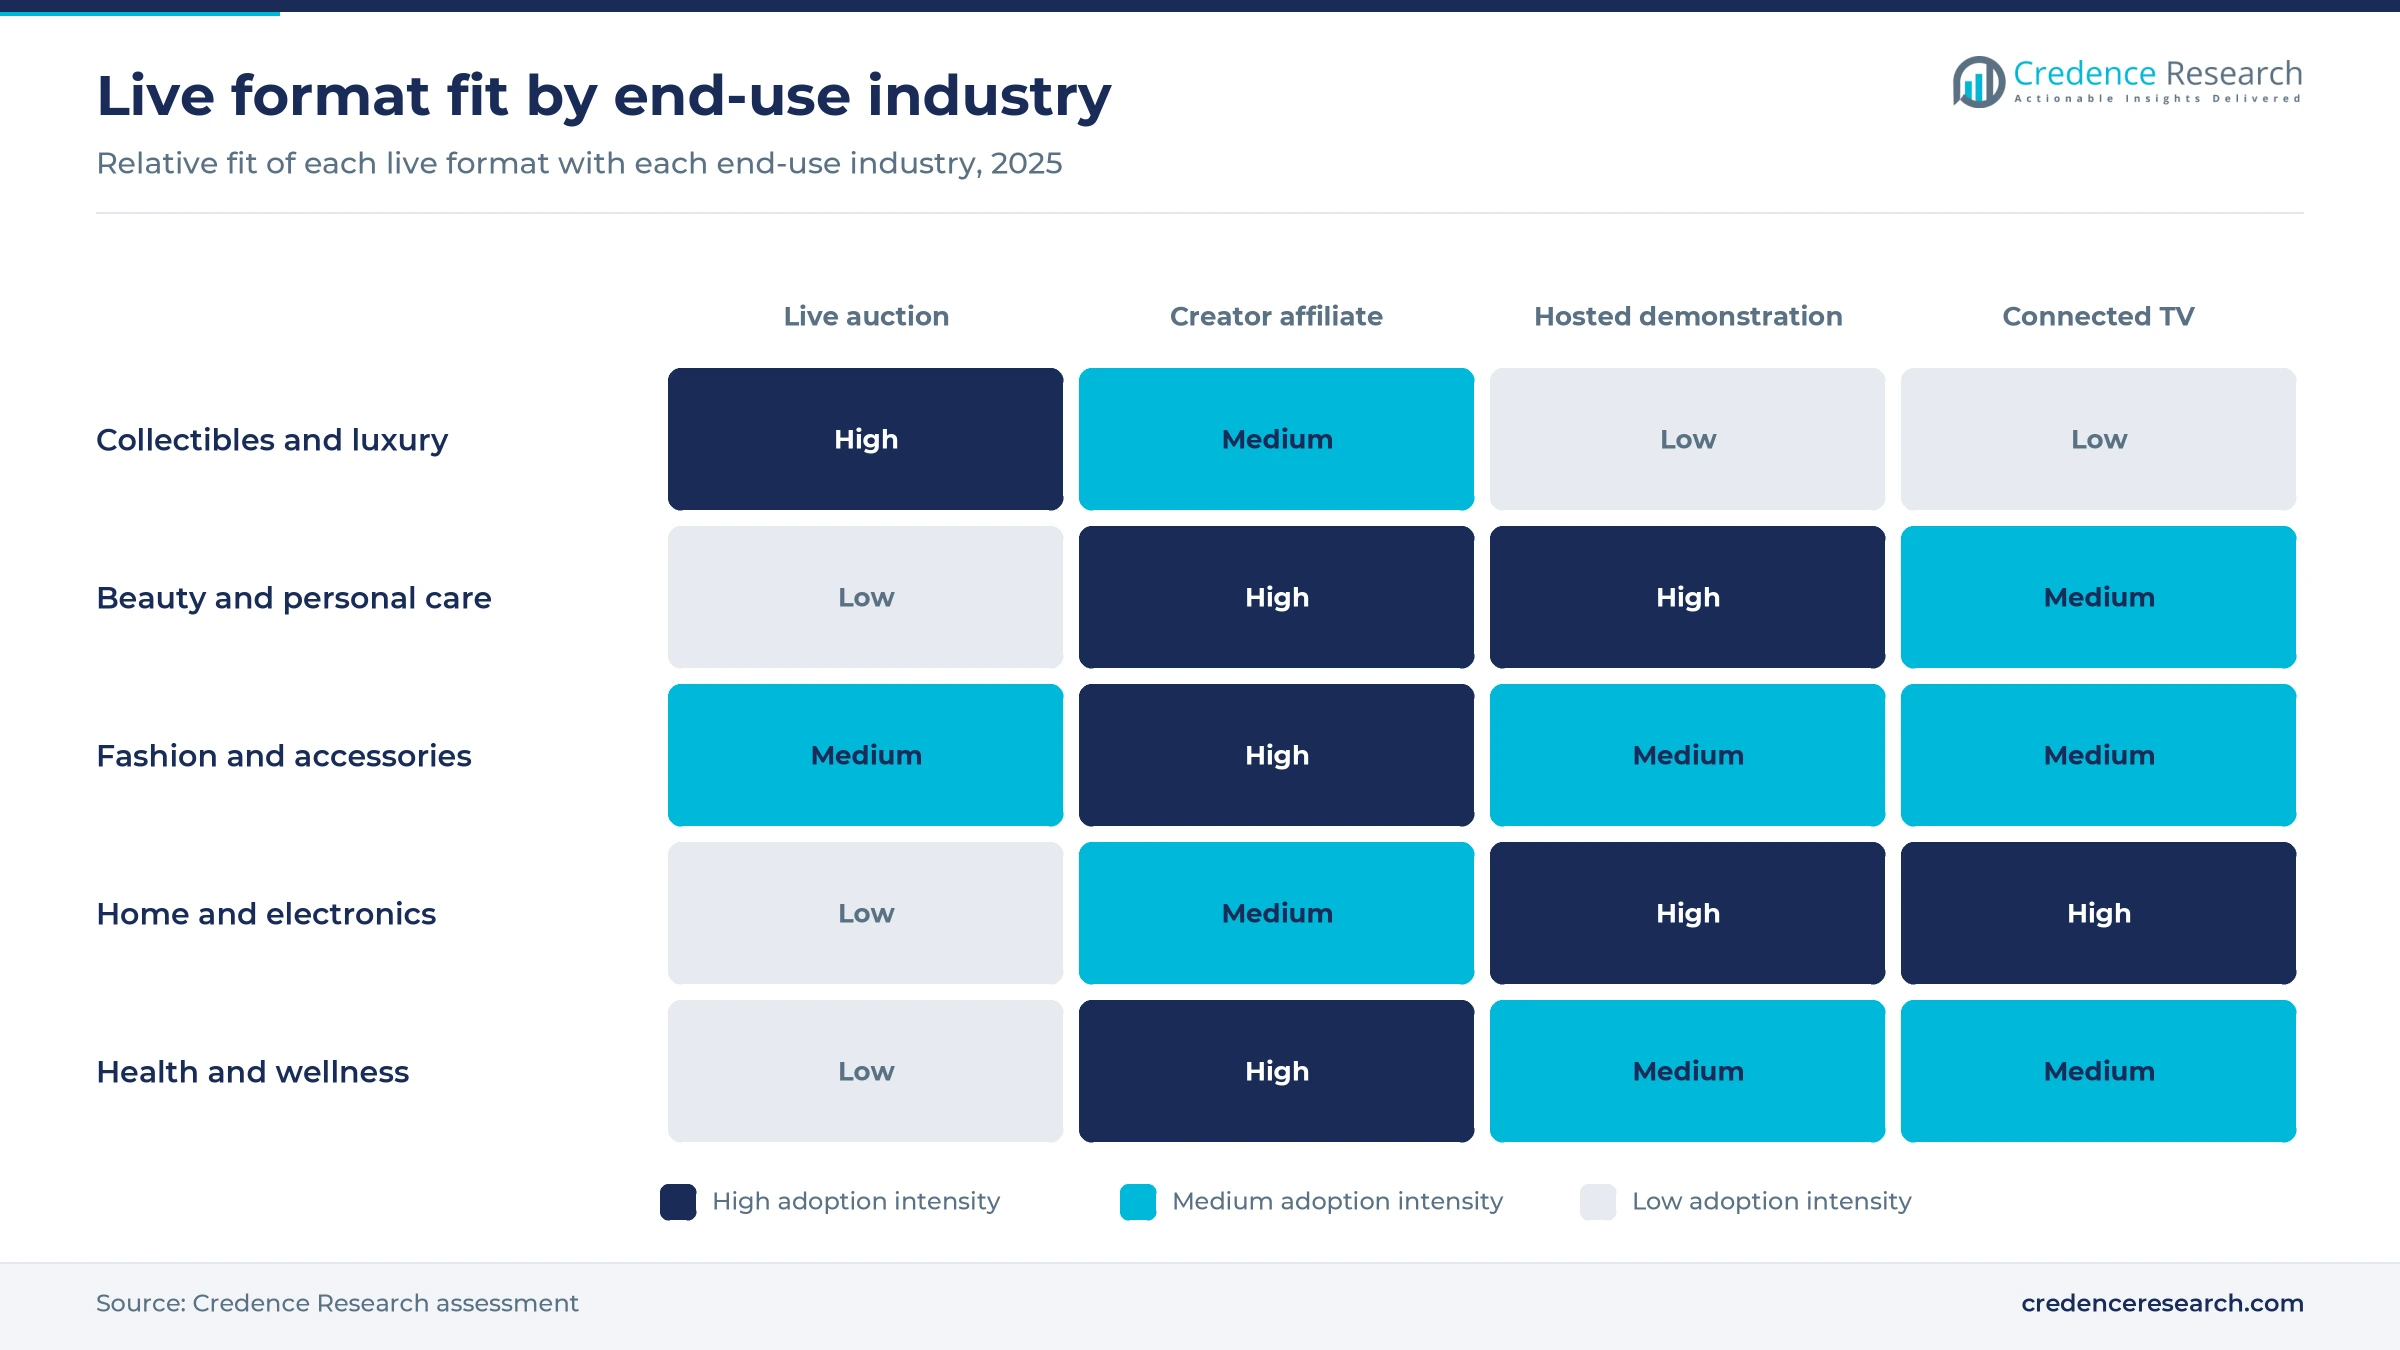
Based on end-use industry, the market is categorized into beauty and personal care, fashion and accessories, home and consumer electronics, collectibles and luxury goods, and health and wellness. Collectibles and Luxury Goods led with 42.0% of 2025 value because scarce items reward live bidding, and eBay ran 11 live holiday events from Nov. 28 to Dec. 20, 2025, including seven Hermès Birkin bags in one auction series. Beauty and Personal Care grows fastest at 20.7% a year as the category was the largest on TikTok Shop in the United States in 2025, according to Momentum Works. Live demonstration suits shades, textures and routines, which a static product page explains poorly.
Marketplace commissions lead as affiliate income grows
Based on revenue model, the market is categorized into retail merchandise margin, marketplace commission, affiliate commission, sponsorship and media revenue, and platform subscription fees. Marketplace Commission led with 34.0% of 2025 value because most live volume runs through marketplaces that take a cut of every order, and Whatnot had passed one billion total orders since launch, according to Tubefilter in June 2026. Affiliate Commission grows fastest at 21.2% a year as YouTube Shopping enrollment passed 1.3 million channels by September 2026, about 2.6 times the July 2025 level, according to PPC Land. Commission income scales with creator count rather than studio hours.
| Segment Group | Leading Sub-segment | Share, 2025 | Fastest-growing Sub-segment | CAGR, 2026–2035 |
|---|---|---|---|---|
| By Solution Type | Live Auction Commerce | 52.0% | Creator Affiliate Live Commerce | 21.1% |
| By Deployment Model | Marketplace Integrated | 55.0% | Social Platform Native | 20.8% |
| By End-Use Industry | Collectibles and Luxury Goods | 42.0% | Beauty and Personal Care | 20.7% |
| By Revenue Model | Marketplace Commission | 34.0% | Affiliate Commission | 21.2% |
Take rates of 6% to 8% set the cost of selling live
Sellers in U.S. live channels pay a percentage of each sale rather than a fee for airtime, which keeps entry costs low but makes take rates the main lever on seller margins. Commission plus payment processing typically absorbs about 9% to 11% of an item price for a small seller, before creator commissions or shipping subsidies. Rates fall with volume, and Whatnot reset its tiers from Sept. 21, 2026 as eBay Live courted the same card and coin sellers with a cap per item. High-value items therefore move toward platforms with caps, while low-priced impulse goods favor social apps with the largest audiences.
| Platform fee | Typical price or fee | Basis |
|---|---|---|
| Whatnot standard commission | 8% of item price plus 2.9% and USD 0.30 processing, for sellers under USD 15,000 in four weeks | Whatnot, via Value Added Resource, September 2026 |
| Whatnot high-volume tiers | 4.0% to 6.5% by category for sellers above USD 500,000 in four weeks | Whatnot, via Value Added Resource, September 2026 |
| eBay Live commission | 6% capped at USD 100 per item, 4% for coins, bullion and sneakers | eBay Live seller pricing, 2026 |
| eBay Live payment processing | 2.9% plus USD 0.30 per order | eBay Live seller pricing, 2026 |
Request a Free Sample
Fill in your details and we'll send you a free sample report.
- Sample data tables & charts
- Research methodology
Audiences, creators and checkout pull sales into streams
Audiences move to social and streaming feeds
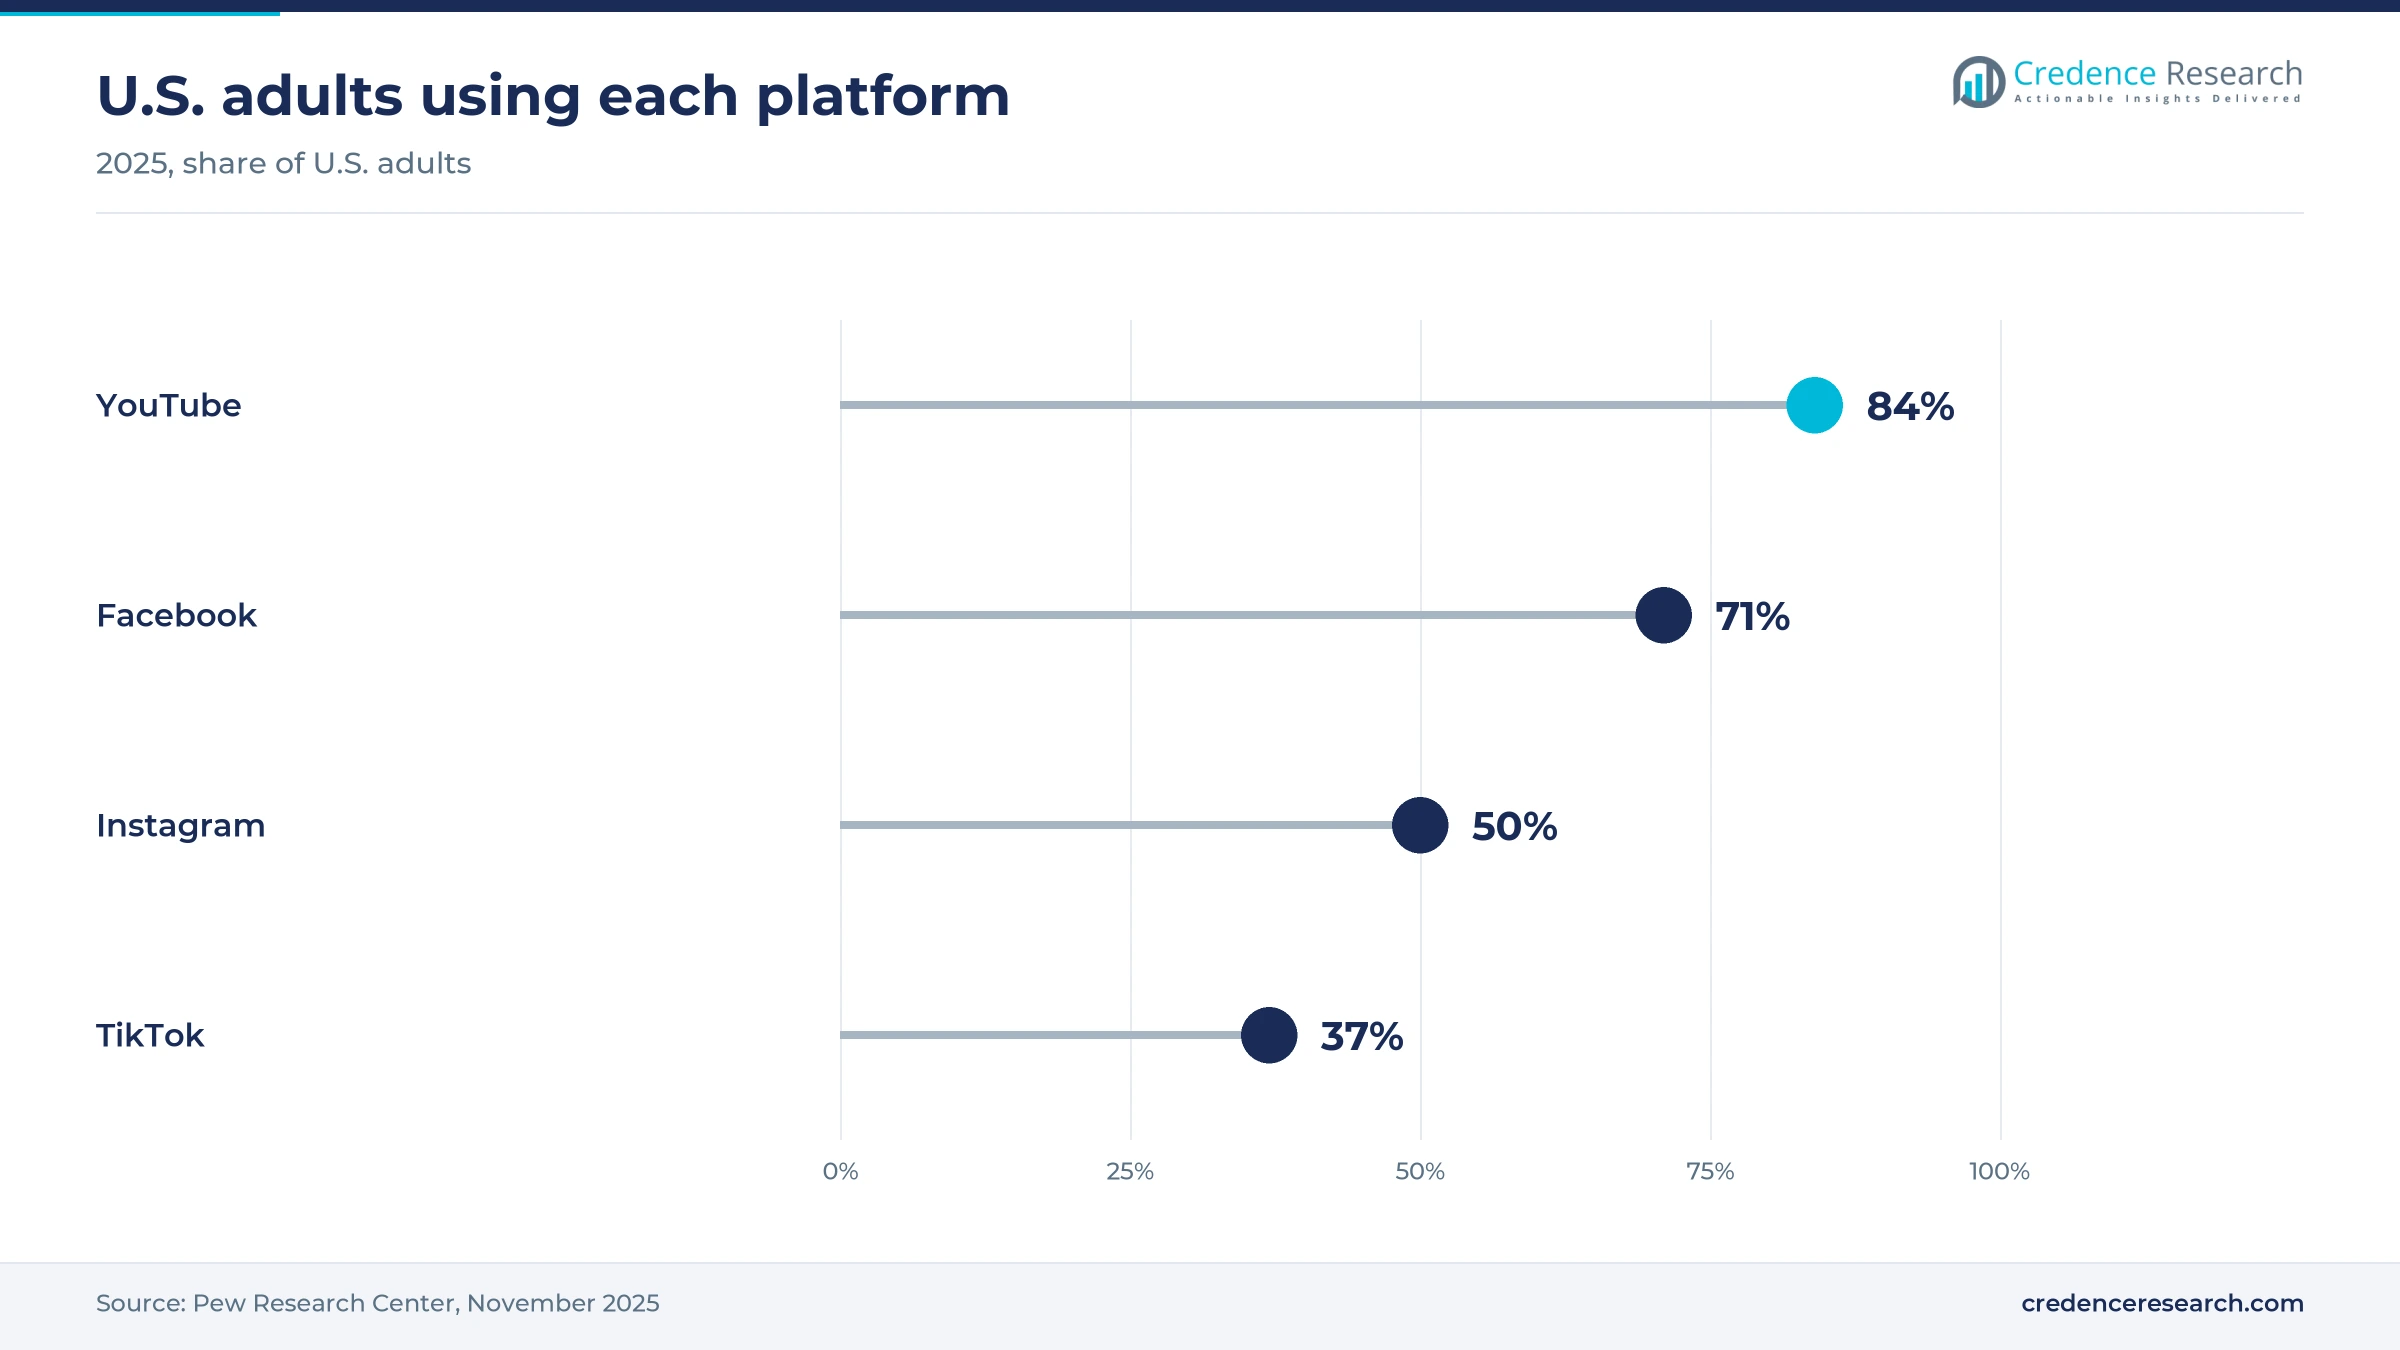
Shopping attention is following U.S. viewers onto social and streaming feeds, where a host can sell inside the content people already watch. Pew Research Center found in 2025 that 84% of U.S. adults use YouTube and 37% use TikTok, up from 21% in 2021. Roughly half of adults aged 18 to 29 open TikTok at least once a day, compared with 5% of adults 65 and older, according to the same survey. About half of U.S. adults visit YouTube at least once a day, Pew's frequency survey found, which gives shoppable streams a daily audience beyond TikTok. Platforms with daily young audiences therefore set the pace for discovery-led live selling.
Creators turn sales commissions into a media channel
Brands are moving budget from fixed sponsorship toward creators who are paid on the sales they drive, a model that suits live selling. The IAB projected U.S. creator economy ad spend at $37 billion in 2025, up 26% from a year earlier and about four times the growth rate of total media. YouTube opened its shopping affiliate program to Partner Program channels with as few as 500 subscribers on March 27, 2026, widening the pool of hosts. QVC Group said more than 74,000 creators had featured its products since it joined TikTok Shop in August 2024. Brands that run influencer marketing platforms well can scale live reach without building studios of their own.
Mobile checkout closes the gap between watching and buying
Live selling converts best when a viewer can pay in a tap without leaving the stream, and U.S. payment habits now support that. The Census Bureau estimated retail e-commerce at 17.1% of total U.S. retail sales in the second quarter of 2026, up 12.2% from a year earlier. The Federal Reserve Diary of Consumer Payment Choice recorded 11 mobile phone payments a month per consumer in 2024, up from four in 2018. Adults aged 18 to 24 used their phones for 45% of their payments, the same group that watches the most social video. Platforms that store cards and wallets for digital payments keep the payment data, which improves targeting for the next stream.
Collector communities fund dedicated auction platforms
Hobby communities in cards, coins, comics and sports memorabilia give live auctions a loyal, high-frequency buyer base. Whatnot raised $545 million at a $20 billion valuation on Aug. 7, 2026, nearly double its previous round, and it said the number of sellers past $1 million in lifetime sales had more than doubled in a year. Fanatics launched an originals slate on its Fanatics Collect app on June 22, 2026 with 24 creator partners to keep pace. eBay launched a nine-stop U.S. live shopping tour in June 2025 to recruit buyers in person. Investor money is funding seller acquisition, which keeps fees under pressure for the next few years.
TV networks go social as auctions spread across apps
TV shopping networks shift hours to social streams
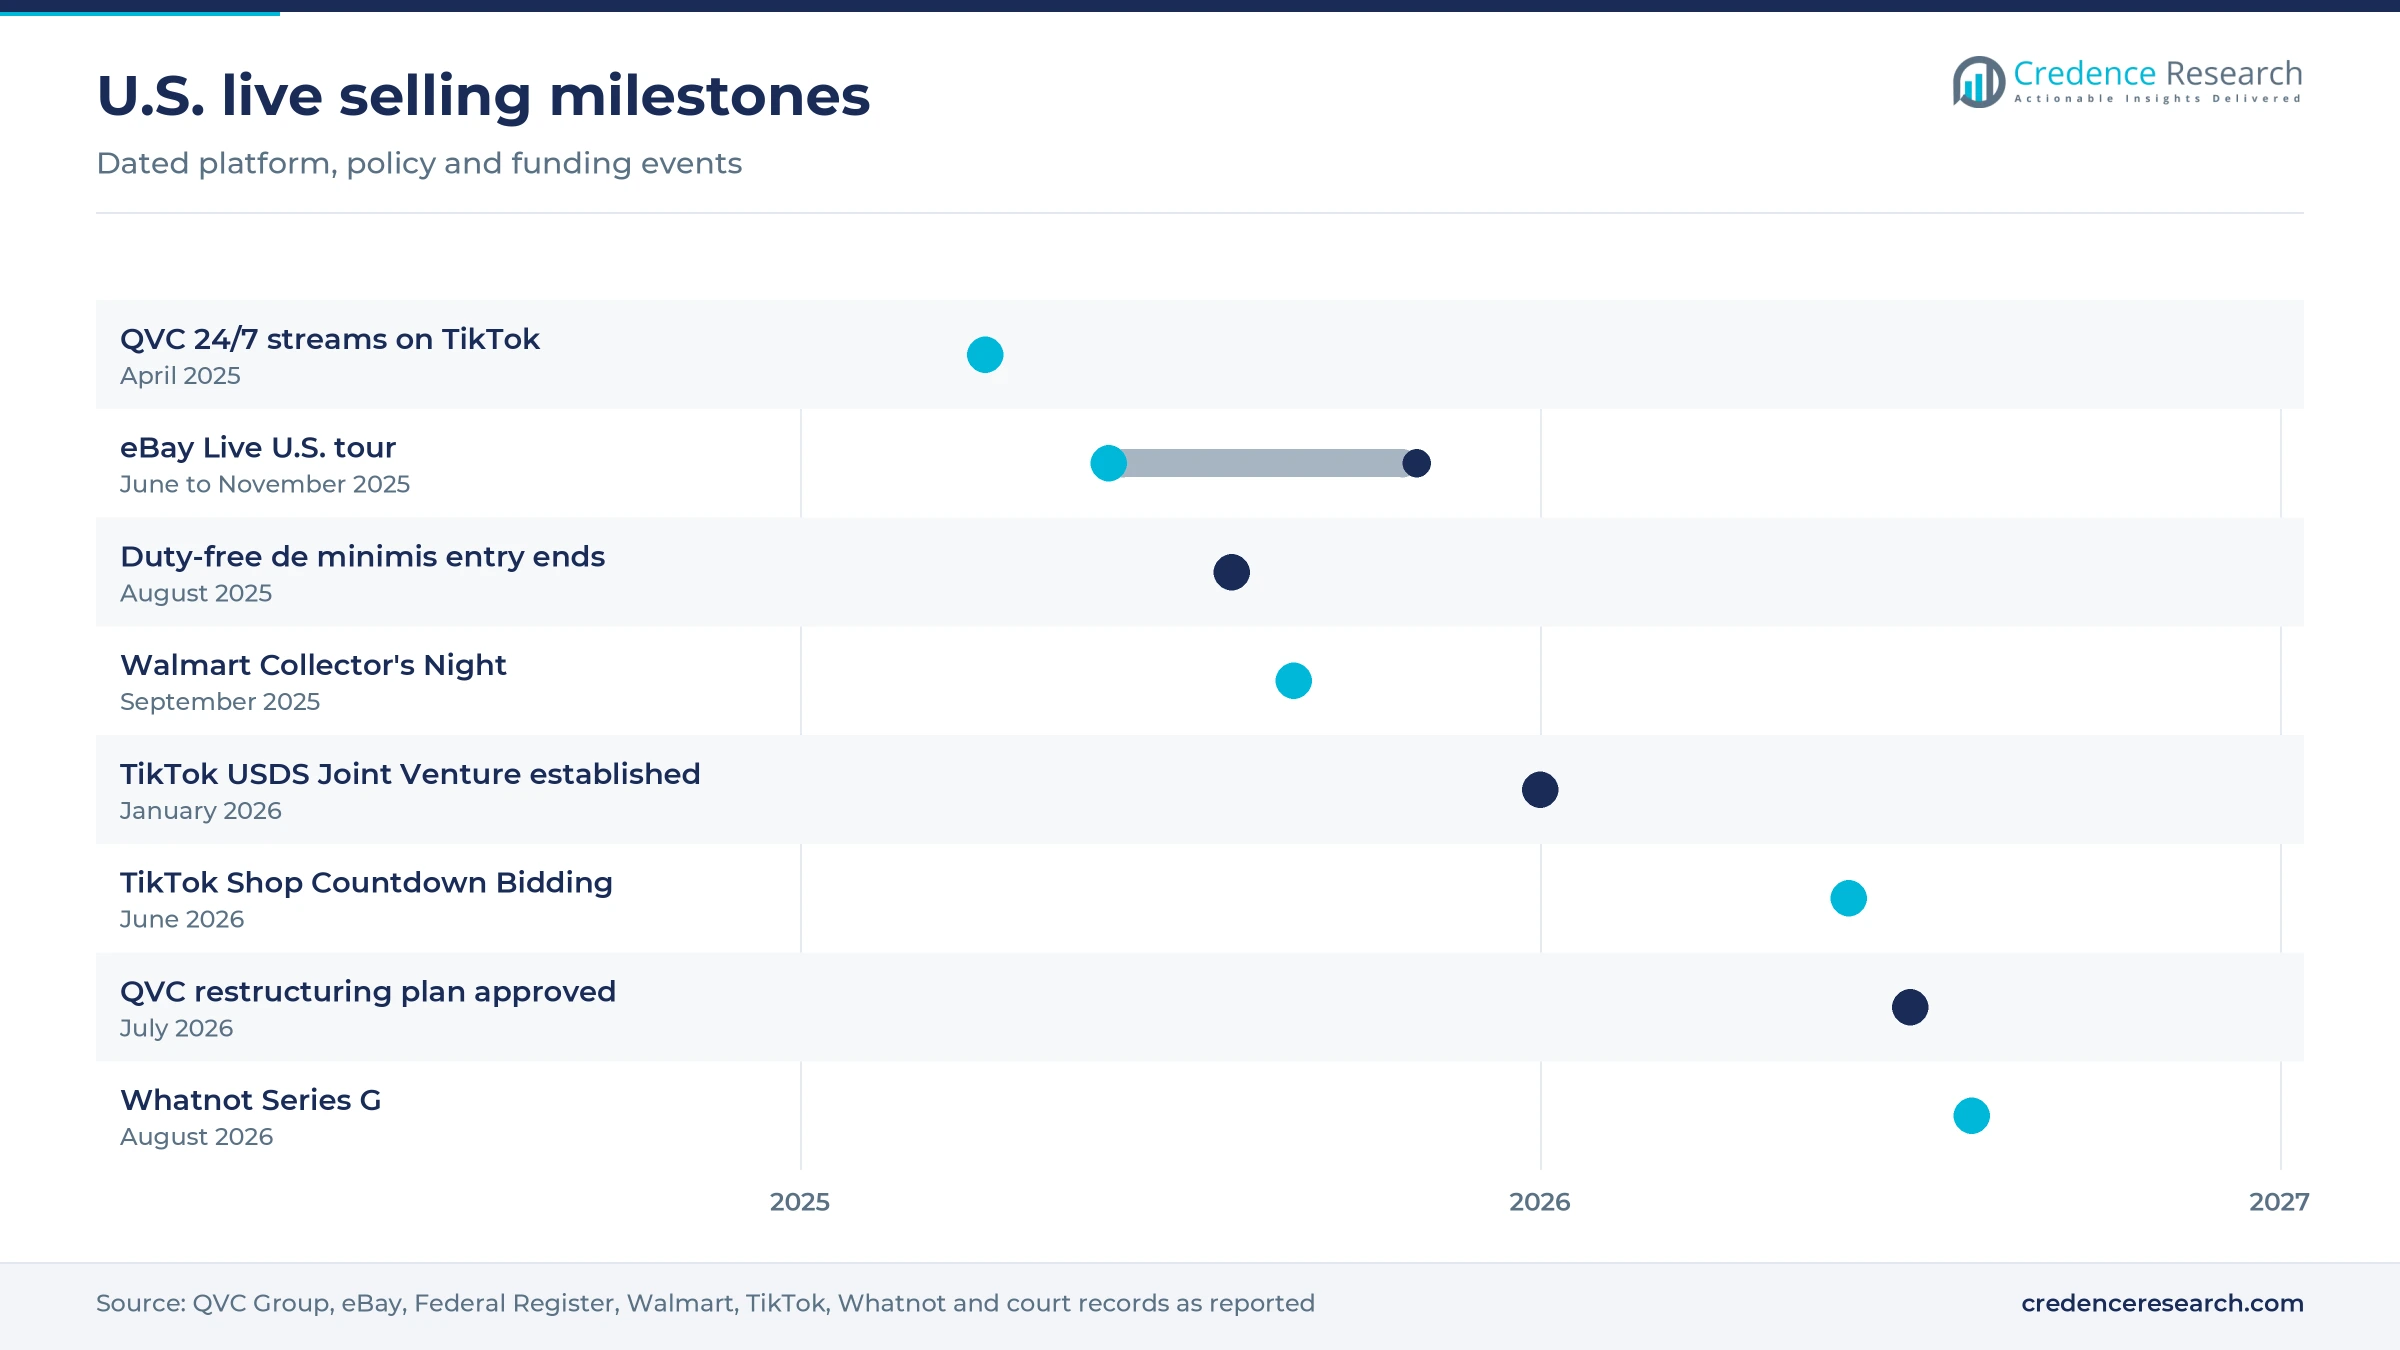
Legacy TV shopping is rebuilding around social and app streams as its owners restructure. QVC Group launched 24/7 live shopping on TikTok on April 2, 2025, carrying QVC and HSN talent and brands into the app. By June 2026 it produced over 220 hours of live programming a week for TikTok Shop, according to Digital Commerce 360. The same report said streaming-attributed sales grew 19% in 2025, and a bankruptcy court approved the group's restructuring on July 15, 2026, cutting debt from $6.6 billion to about $1.33 billion. Hosted Demonstration Retail keeps its studio skills, but its growth now depends on platforms it does not own.
Countdown bidding brings auctions into social apps
Auction mechanics are spreading from dedicated apps into general social platforms, which widens the buyer pool for collectible sellers. TikTok Shop documented Countdown Bidding for U.S. LIVE sessions in June 2026, with fixed and extended auctions and automatic payment by the winner, according to PPC Land. Its Surprise Set format caps bids at $5,000 and allows up to 500 units per item, and bids cannot be retracted. Live Auction Commerce already holds 52.0% of 2025 value, so a social rival with a far larger audience matters. Dedicated apps are likely to keep high-value collectors, while TikTok competes for casual bidders who discover auctions in their feed.
Retailer channels and connected TV open new live inventory
Retailers and TV platforms have an opening to run owned live channels that keep customer data and checkout in-house. Walmart began a weekly Collector's Night series on Walmart Live on Sept. 4, 2025, produced with TalkShopLive, its live commerce partner since 2021, with box breaks and exclusive product drops. Amazon launched a free, ad-supported Amazon Live channel on Prime Video and Freevee in April 2024 and cited a Samba TV finding that 75% of U.S. adults look at a mobile device while watching TV. QVC+ and HSN+ reached 1.5 million monthly active users by April 2026, according to Digital Commerce 360. Producers that stream one show to app, web and TV feeds gain the most.
Beauty, wellness and hard goods widen the category base
New categories give live sellers an opportunity beyond collectibles, toward everyday products that buyers reorder. eBay opened eBay Live to Hard Goods, Health & Beauty and Art & Antiques in October 2025 and dropped many sales-volume requirements from its seller application, according to Value Added Resource. Sellers that hosted livestreams on TikTok Shop during the 2025 Black Friday to Cyber Monday period saw 84% sales growth, across more than 760,000 sessions, according to TikTok. Palmstreet crossed 3 million orders in October 2025 and sold a rare plant for $26,000, which shows how niche hobbies can sustain live auctions. Categories that need demonstration, such as skincare and supplements, gain the most from these openings.
Import duties, endorsement rules and fees pressure sellers
End of duty-free parcels lifts costs for imported goods
Low-priced imported goods that fed impulse buying in live streams lost their duty advantage. Duty-free de minimis treatment for shipments of $800 or less ended for all countries at 12:01 a.m. on Aug. 29, 2025, according to the Federal Register notice. Postal shipments paid a specific duty of $80 to $200 per item until Feb. 28, 2026, after which only ad valorem duties apply. Sellers of cheap fashion and accessories face thinner margins, and domestic inventory becomes an advantage.
Review and endorsement rules raise compliance costs
Live hosts make claims in real time, which exposes sellers to tighter federal rules on endorsements and fake engagement. The FTC rule on consumer reviews and testimonials took effect on Oct. 21, 2024, with civil penalties of up to $51,744 per violation. It bars buying fake followers or views and requires insiders to disclose material ties to the business. Brands working with many affiliate creators must monitor disclosures across streams, which adds cost for smaller sellers.
Gamified auction formats invite consumer scrutiny
Random-prize auction formats lift engagement but expose platforms to refunds and gambling concerns. On June 17, 2026, TikTok barred iPhones, TVs, diamonds, gift cards and precious metals from its Surprise Sets after sellers lured bidders with high-value items and shipped cheap prizes, according to Shopifreaks. One buyer paid as much as $147 for a plush toy worth about $20. Platforms that tighten rules early protect trust, while sellers that rely on mystery formats lose a sales tool.
Fee resets can squeeze smaller sellers
Commission changes can quickly alter the economics for part-time sellers, who make up much of the live supply. Whatnot's new volume tiers took effect on Sept. 21, 2026 for existing sellers, and its extra 10% Premier Shop discount ended on Nov. 1, 2026, according to Value Added Resource. The same report said some lower-volume Premier Shop sellers may pay more under the new structure. Small sellers now compare fees across apps more often, which raises churn and acquisition costs for platforms.
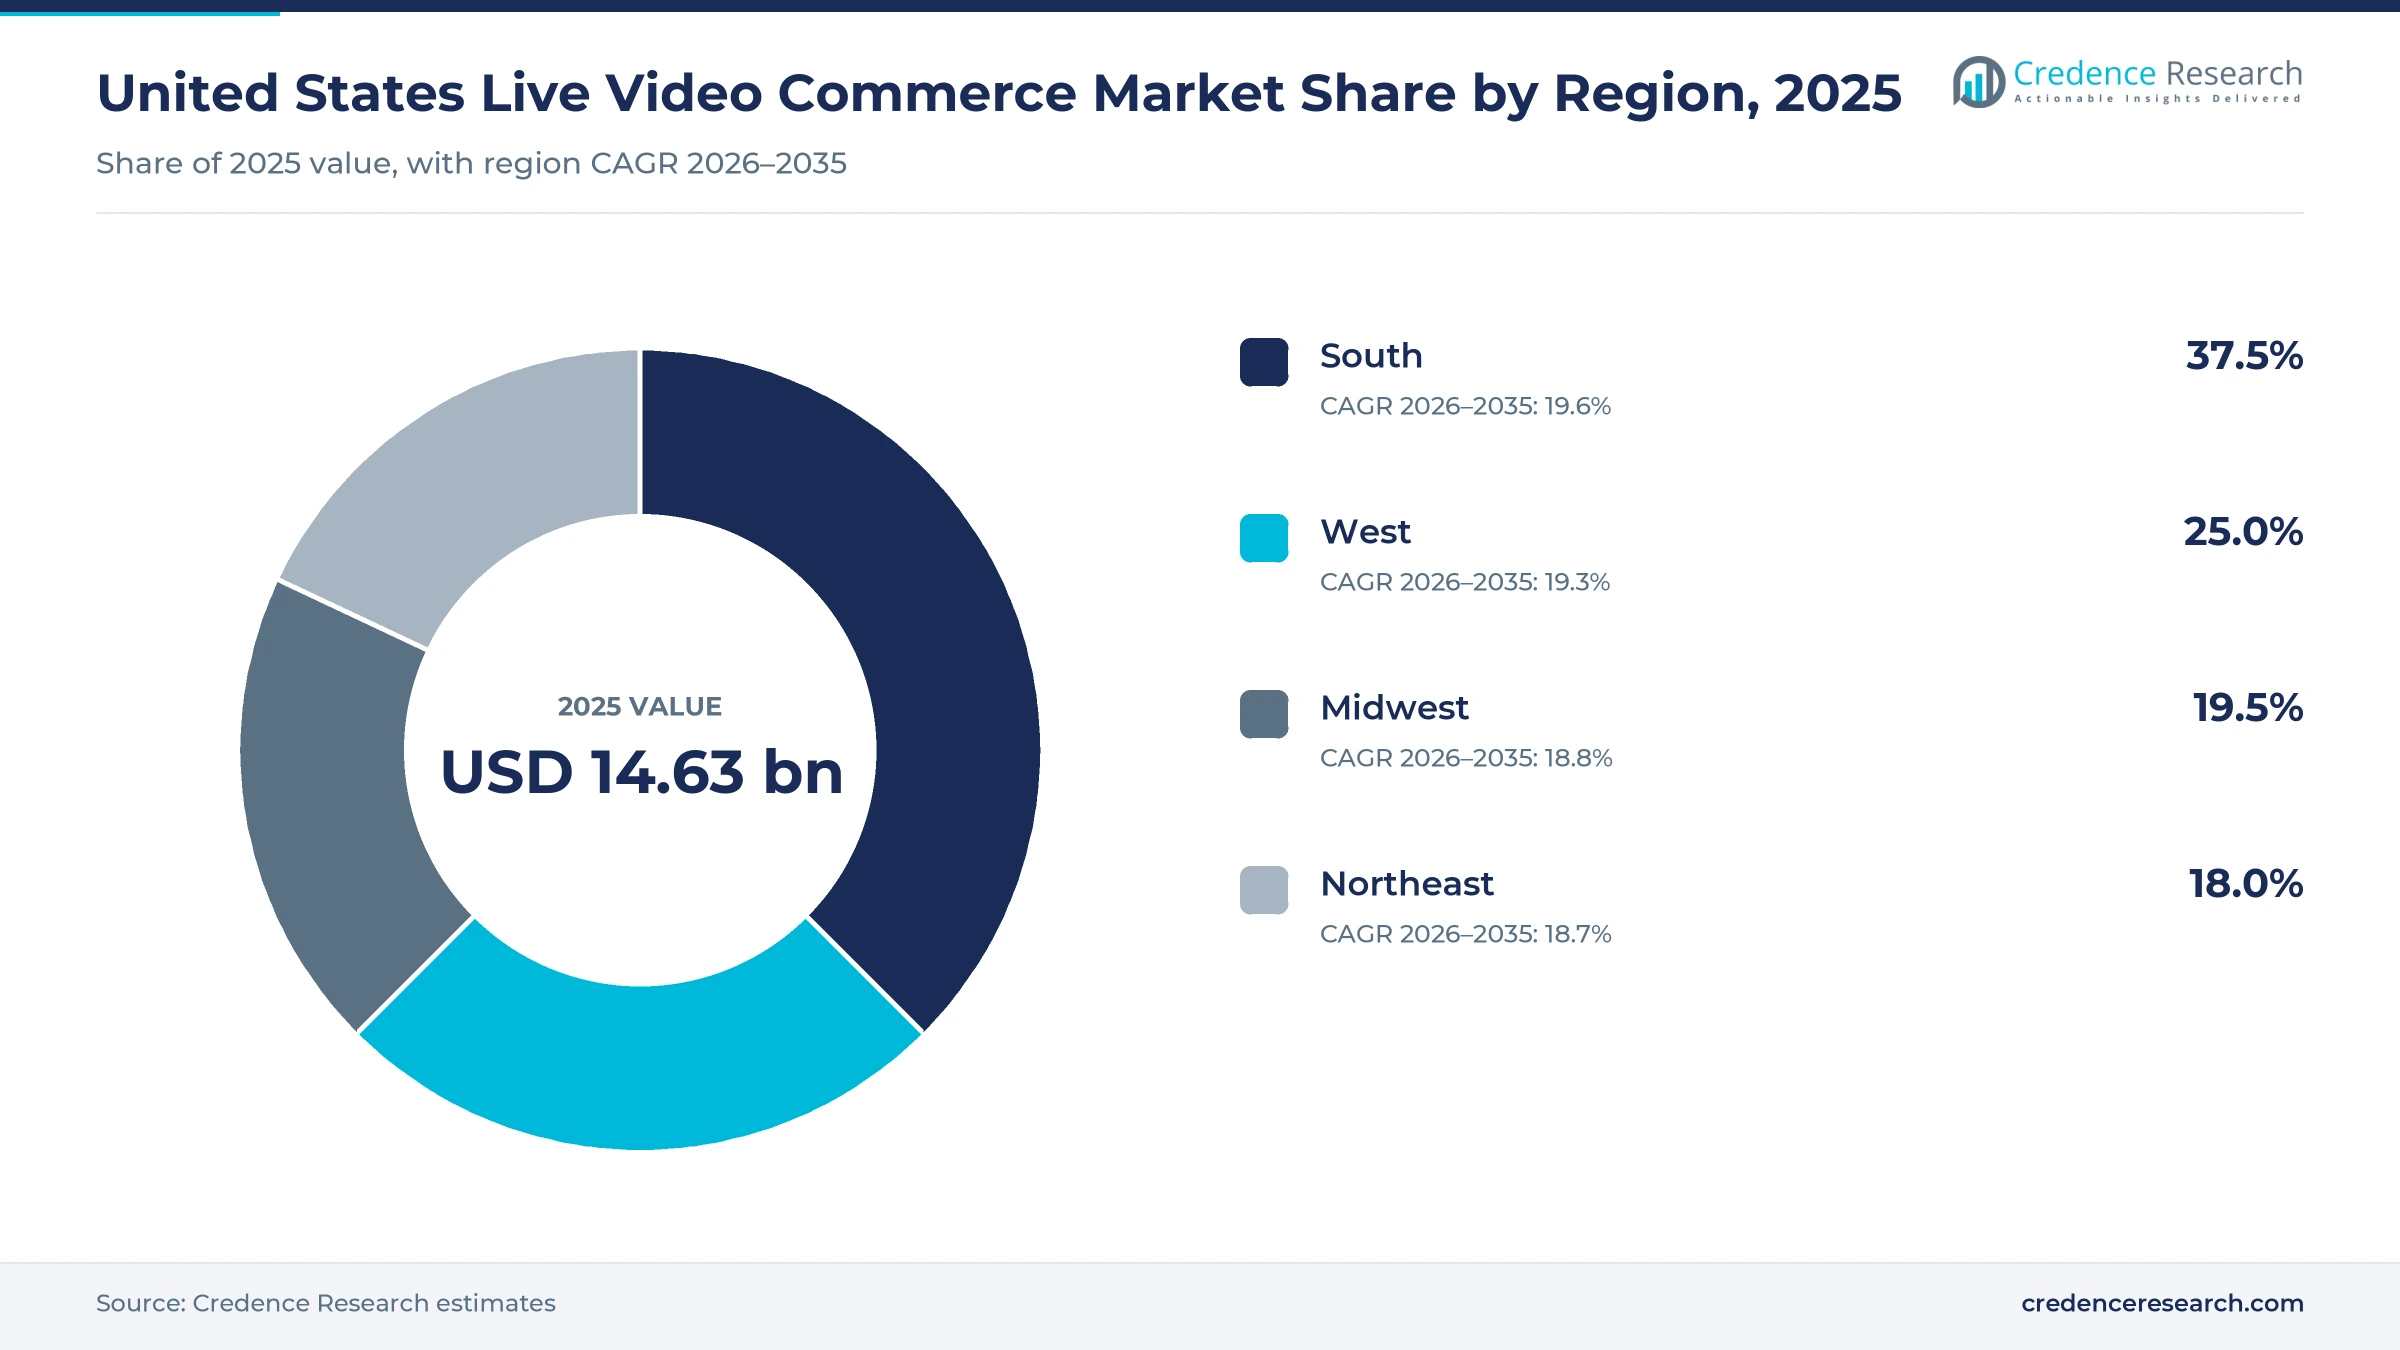
The South leads as its population grows fastest
| Region | Value, 2025 (USD billion) | Share, 2025 | CAGR, 2026–2035 |
|---|---|---|---|
| South | 5.49 | 37.5% | 19.6% |
| West | 3.66 | 25.0% | 19.3% |
| Midwest | 2.85 | 19.5% | 18.8% |
| Northeast | 2.63 | 18.0% | 18.7% |
The South leads with the fastest population growth
The South held 37.5% of 2025 value and grows at 19.6% a year, the fastest of the four regions. Census Bureau estimates show its population grew 6.0% from April 2020 to July 2025, nearly double the national 3.1%, and it was the only region where people under 18 increased. Growing suburbs add new buyers every year, which favors creator affiliate and auction formats.
The West leans on adult collectors and live events
The West held 25.0% of 2025 value and grows at 19.3% a year. Its share reflects large metro markets with many adult collectors. However, the West had the largest regional fall in people under 18, down 5.7% from 2020 to 2025, according to the Census Bureau. Demand therefore tilts toward adult collectors, luxury resale and beauty, which carry higher order values.
The Midwest grows below the national rate
The Midwest held 19.5% of 2025 value and grows at 18.8% a year, below the national rate. Its population under 18 fell 3.9% from 2020 to 2025, according to the Census Bureau, which limits growth among the youngest social video audiences. Marketplace apps reach card, coin and hobby buyers in smaller towns that lack nearby shops or shows. Sellers here gain more from auction and marketplace formats than from trend-driven social product drops.
The Northeast relies on spend per buyer
The Northeast held 18.0% of 2025 value and grows at 18.7% a year, the slowest of the four regions. It was the only region to lose young adults aged 18 to 24, down 2.1% from 2020 to 2025, and its under-18 population fell 4.1%, according to the Census Bureau. Dense metros in the region still support high spending per buyer. Growth here depends on raising spend per buyer rather than adding many new ones.
Restructurings, funding and auction tools reshape the field
| Development | Status and market relevance |
|---|---|
| In April 2025, QVC Group launched 24/7 live shopping streams on TikTok Shop with QVC and HSN brands and talent. | Live; moves TV hours to social |
| In September 2025, Walmart began a weekly Collector's Night series on Walmart Live, produced with TalkShopLive. | Running weekly; retailer-owned channel |
| In January 2026, the TikTok USDS Joint Venture was established with 80% non-Chinese ownership. | Established; ends U.S. ban risk |
| In June 2026, TikTok Shop documented Countdown Bidding for U.S. LIVE sessions. | Live; brings auctions to social |
| In August 2026, Whatnot raised $545 million in a Series G round at a $20 billion valuation. | Closed; funds growth and AI |
Low-latency video and one-tap checkout drive conversion
- Low-latency streaming keeps the delay between a host's pitch and a viewer's bid short enough for countdown auctions to stay fair.
- In-stream checkout stores payment and address details so a viewer can buy in one tap, and platforms can add buy now, pay later plans at the same step for higher-priced items.
- AI product tagging identifies products as they are mentioned, and YouTube introduced automatic timestamps for product tags on Sept. 16, 2025.
- Second-screen sync links a TV broadcast to a phone, as Amazon's shop the show feature does for its Prime Video and Fire TV channel.
Need a Custom Version of This Report?
Tailor the scope, geography, or segments to your exact requirements.
- Custom geography or segment scope
- Direct access to our analyst team
Social apps and auction marketplaces split U.S. buyers
Competition in the U.S. market runs across three business models. Social platforms such as TikTok Shop and YouTube Shopping compete on audience reach and creator incentives, and they win most first-time impulse buyers. Auction marketplaces such as Whatnot, eBay Live, Fanatics Live and Palmstreet compete for collectors through fees, authentication and seller tools, and eBay's $100 fee cap per item targets high-value card and coin sellers. Retail and media groups such as QVC Group and Amazon Live bring studio production, inventory and fulfillment, while TalkShopLive supplies production for Walmart's owned channel. Pricing power sits with whoever owns the buyer relationship and the checkout, so platforms use seller fee cuts, shopper coupons and creator bonuses to gain share. Seller loyalty is weak, because the same host can stream on several apps in one week.
A few platforms own the audience while sellers stay fragmented
The U.S. supply side is concentrated at the platform layer and fragmented among sellers. TikTok Shop, Whatnot, Amazon, YouTube and eBay control audiences, checkout and ranking, while thousands of small businesses, creators and hobby dealers supply the streams. Barriers are low for sellers, who need a phone, inventory and a following, but high for platforms, which must fund buyer protection, payments, moderation and seller incentives. Whatnot's latest funding round shows how much capital that takes. Margins sit with platforms through take rates and with sellers of scarce items, while sellers of commodity goods compete on price and shipping.
Companies profiled and their roles in this market
| Company | Type | Role in the market |
|---|---|---|
| TikTok Shop | Social platform | Runs U.S. LIVE selling with creator affiliates and added auction tools in 2026 |
| Whatnot | Live auction marketplace | Leads U.S. live auctions in cards, collectibles and fashion |
| QVC Inc. | Hosted retail network | Streams QVC and HSN content around the clock on TikTok Shop |
| Amazon Live | Marketplace and TV channel | Runs a free shoppable channel on Prime Video and Fire TV |
| YouTube Shopping | Social platform | Pays creators affiliate commissions on tagged products |
| eBay Live | Live auction marketplace | Added hard goods, health and beauty, and art categories in October 2025 |
| TalkShopLive | Production and syndication | Produces the weekly Collector's Night series on Walmart Live |
| Fanatics Live | Collectibles live platform | Runs card breaks and an originals slate on Fanatics Collect |
| Palmstreet | Niche live auction app | Sells rare plants, crystals and decor through live auctions |
Performance selling, not studio TV, carries growth to 2035
Credence Research's view is that U.S. live selling will grow as a performance channel rather than as a new form of shopping television. Money is moving toward creator commissions, auction fees and in-app checkout and away from studio airtime. Auction marketplaces hold the most defensible position, because collectors return every week and value authentication. Social platforms will add the most new buyers, but their gamified formats need firmer rules to keep trust. Sellers that stream one show to social, marketplace and TV feeds are likely to have the lowest cost per order by 2035.
Platform disclosures and federal data anchor the estimates
The report uses 2025 as the base year and 2026 to 2035 as the forecast period. Market values come from the Credence Research model, which measures merchandise value sold during, or directly attributed to, live shoppable video across social, marketplace, retailer and TV channels. Segment and regional splits are Credence Research estimates built from Census Bureau e-commerce and population data, Federal Reserve payment data, Pew Research Center platform surveys, company announcements and trade press. No interviews or primary surveys were conducted for this edition of the report.
Checkout and creator loyalty decide the 2035 leaders
The United States live video commerce market is expected to grow from USD 19.20 billion in 2026 to USD 93.35 billion by 2035 at a 19.21% CAGR. Growth will be fastest in the early years, while platforms still add first-time buyers, and slower later as take rates settle. Live auctions will keep the largest share, while creator affiliate selling gains the most ground. The South will add the most new buyers as its population grows. By 2035, the main contest will be over checkout and creator loyalty rather than over who has the biggest studio.
Platform rules and seller economics set the 2035 range
The range of outcomes depends on how fast social platforms convert short-video viewers into live buyers, and on whether fee competition leaves sellers enough margin to stream often. A downside case assumes tighter rules on auction formats, higher import costs and fee increases that push small sellers out. The base case assumes steady creator growth and stable take rates. An upside case needs in-stream checkout on connected TV to scale and live sessions to take a larger share of social shopping.
| Scenario | CAGR, 2026–2035 | Value, 2035 | What has to hold |
|---|---|---|---|
| Downside | 16.2% | USD 74.22 billion | Auction rules tighten, import costs stay high and small sellers leave the major apps |
| Base | 19.21% | USD 93.35 billion | Creator numbers keep rising and take rates stay near current levels |
| Upside | 21.7% | USD 112.52 billion | Connected TV checkout scales and live sessions win a larger share of social sales |
Frequently Asked Questions
How big is the United States live video commerce market?
Which solution type leads U.S. live selling?
Which U.S. region leads the market?
Which solution type grows fastest?
What do sellers pay to sell on U.S. live platforms?
How did the TikTok joint venture affect live selling?
Who are the key companies in the United States live video commerce market?
Which deployment model grows fastest?
Table of Content
Chapter 1 Market Segmentation
- 1.1 Segmentation Framework
- 1.1.1 Product and Service Classification
- 1.1.2 Application and End-Use Classification
- 1.1.3 Technology and Solution Classification
- 1.1.4 Customer and Distribution Channel Classification
- 1.1.5 Geographic Segmentation
- 1.1.6 Market Segment Definitions and Boundaries
- 1.2 By Solution Type
- 1.2.1 Live Auction Commerce
- 1.2.2 Creator Affiliate Live Commerce
- 1.2.3 Hosted Demonstration Retail
- 1.2.4 Shoppable Streaming
- 1.2.5 One-to-One Video Selling
- 1.3 By Deployment Model
- 1.3.1 Marketplace Integrated
- 1.3.2 Social Platform Native
- 1.3.3 Retailer-Owned Platform
- 1.3.4 FAST and Connected TV
- 1.3.5 Syndicated Multi-Platform
- 1.4 By End-Use Industry
- 1.4.1 Collectibles and Luxury Goods
- 1.4.2 Fashion and Accessories
- 1.4.3 Beauty and Personal Care
- 1.4.4 Home and Consumer Electronics
- 1.4.5 Health and Wellness
- 1.5 By Revenue Model
- 1.5.1 Marketplace Commission
- 1.5.2 Retail Merchandise Margin
- 1.5.3 Affiliate Commission
- 1.5.4 Sponsorship and Media Revenue
- 1.5.5 Platform Subscription Fees
Chapter 2 Introduction
- 2.1 Report Objectives and Scope
- 2.2 Product Definition and Industry Terminology
- 2.3 Market Inclusions and Exclusions
- 2.4 Research Process
- 2.4.1 Primary Research and Expert Interviews
- 2.4.2 Secondary Research and Source Review
- 2.4.3 Top-Down and Bottom-Up Estimation
- 2.4.4 Data Triangulation and Verification
- 2.5 Market Size Measurement Basis
- 2.5.1 2025: USD 14.63 billion → 2035: USD 93.35 billion
- 2.6 Historical and Forecast Reference Periods
- 2.6.1 Historical Period: 2018-2025
- 2.6.2 Base Year: 2025
- 2.6.3 Forecast Period: 2025-2035
- 2.7 Research Assumptions and Limitations
Chapter 3 Executive Summary
- 3.1 Market Snapshot and Key Findings
- 3.2 Base-Year Market Size, 2025
- 3.3 Forecast Market Size, 2035
- 3.4 Revenue and Volume Growth Outlook
- 3.5 Key Demand and Supply Indicators
- 3.6 Leading Market Segments
- 3.7 Fastest-Growing Market Opportunities
- 3.8 Regional Performance Highlights
- 3.9 Technology and Industry Transformation
- 3.10 Competitive Landscape Summary
- 3.11 Analyst View and Strategic Implications
Chapter 4 United States Live Video Commerce Market Trends and Developments
- 4.1 Historical Industry Development, 2018-2025
- 4.2 Recent Market Trends and Developments
- 4.3 Demand and Customer Behavior Trends
- 4.4 Technology and Product Innovation
- 4.5 Artificial Intelligence, Automation and Digitalization
- 4.6 Local Manufacturing and Supply Chain Realignment
- 4.7 Industry Partnerships, Mergers and Acquisitions
- 4.8 Sustainability and Circular Economy Developments
- 4.9 Government and Private Sector Investment Trends
- 4.10 Emerging Business Models and Commercialization
- 4.11 Industry Developments and Announcements
Chapter 5 United States Live Video Commerce Market Production, Supply and Demand Analysis
- 5.1 Demand Trend and Consumption Analysis, 2018-2025
- 5.2 Demand Forecast, 2025-2035
- 5.3 Production and Output Trend, 2018-2025
- 5.4 Production and Output Forecast, 2025-2035
- 5.5 Installed Capacity and Capacity Utilization
- 5.6 Company-Wise Production Plants and Statistics
- 5.6.1 Installed Production Capacity
- 5.6.2 Actual Production
- 5.6.3 Planned Capacity and Expansion Targets
- 5.7 Supply Chain Structure and Procurement Trends
- 5.8 Supply-Demand Gap and Bottlenecks
- 5.9 Import Dependence and Sourcing Structure
- 5.10 Contract Manufacturing and Outsourcing
- 5.11 Regional Supply and Demand Concentration
Chapter 6 United States Live Video Commerce Market Pricing Analysis
- 6.1 Pricing Structure and Measurement
- 6.2 Historical Pricing Trends, 2018-2025
- 6.3 Pricing Outlook, 2025-2035
- 6.4 Average Selling Price and Unit Economics
- 6.5 Pricing by Product and Market Segment
- 6.6 Geographic Pricing Differences
- 6.7 Key Input, Energy, Labor and Logistics Costs
- 6.8 Contract Pricing and Purchasing Models
- 6.9 Pricing Sensitivity and Competitive Positioning
- 6.10 Price, Margin and Profitability Implications
Chapter 7 United States Live Video Commerce Market Dynamics
- 7.1 Market Growth Drivers
- 7.1.1 Demand-Side Drivers
- 7.1.2 Technology and Innovation Drivers
- 7.1.3 Infrastructure and Investment Drivers
- 7.1.4 Regulatory and Policy Drivers
- 7.2 Market Restraints
- 7.2.1 Cost and Affordability Constraints
- 7.2.2 Technology and Adoption Barriers
- 7.2.3 Supply Chain and Operational Constraints
- 7.3 Market Challenges
- 7.3.1 Competitive Pressure and Margin Erosion
- 7.3.2 Skills, Infrastructure and Implementation Gaps
- 7.4 Emerging Market Opportunities
- 7.5 Market Dynamics Impact and Time-Horizon Assessment
Chapter 8 United States Live Video Commerce Value Chain Analysis
- 8.1 Industry Value Chain Overview
- 8.2 Upstream Suppliers and Critical Inputs
- 8.3 Technology and Component Providers
- 8.4 Manufacturing or Service Delivery
- 8.5 Distribution, Channel Partners and Integrators
- 8.6 Downstream Applications and End Users
- 8.7 Value Addition and Profit Pools
- 8.8 Vertical Integration and Outsourcing
- 8.9 Supplier Concentration and Risk
- 8.10 Supply Chain Localization and Resilience
Chapter 9 United States Live Video Commerce Market Regulations and Policies
- 9.1 Relevant Laws, Standards and Compliance Frameworks
- 9.2 Product, Service, Safety and Quality Requirements
- 9.3 Government Policies, Incentives and Subsidies
- 9.4 Imports, Exports and Trade Barriers
- 9.5 Public Procurement and Local Content Requirements
- 9.6 Environmental and Sustainability Compliance
- 9.7 Data Protection, AI and Cybersecurity Compliance
- 9.8 Upcoming Policy Changes and Market Implications
Chapter 10 United States Live Video Commerce Market Hotspots and Opportunities
- 10.1 Market Opportunity Mapping and Growth Hotspots
- 10.2 High-Growth Applications and Customer Groups
- 10.3 Underserved Markets and White-Space Opportunities
- 10.4 Emerging Technology and Product Opportunities
- 10.5 New Capacity and Investment Hotspots
- 10.6 Market Entry and Expansion Opportunities
- 10.7 Distribution and Partnership Opportunities
- 10.8 Near-Term and Long-Term Commercial Potential
- 10.9 Opportunity Attractiveness and Execution Risks
Chapter 11 United States Live Video Commerce Market Outlook, 2025-2035
- 11.1 Market Size and Analysis
- 11.1.1 Revenue (Market Measurement: 2025: USD 14.63 billion → 2035: USD 93.35 billion)
- 11.1.2 Market Volume and Quantity Sold
- 11.1.3 Historical Market Size, 2018-2025
- 11.1.4 Base-Year Market Size, 2025
- 11.2 Market Forecast, 2025-2035
- 11.2.1 Revenue Forecast to 2035
- 11.2.2 Volume Forecast to 2035
- 11.2.3 CAGR and Year-on-Year Growth
- 11.2.4 Incremental Revenue Opportunity
- 11.3 Forecast Assumptions and Scenario Analysis
- 11.3.1 Base-Case Forecast
- 11.3.2 Optimistic and Conservative Scenarios
- 11.3.3 Technology, Pricing and Policy Sensitivities
- 11.4 Market Attractiveness and Growth Outlook
Chapter 12 United States Live Video Commerce Market Segmentation and Outlook
- 12.1 Segmentation Summary and Market Shares, 2025
- 12.2 Largest and Fastest-Growing Segments
- 12.3 By Solution Type - Market Size and Forecast, 2025-2035
- 12.3.1 Segment Definition and Scope
- 12.3.2 Historical Market Size, 2018-2025
- 12.3.3 Revenue Forecast, 2025-2035
- 12.3.4 Volume Forecast, 2025-2035
- 12.3.5 Base-Year Market Share, 2025
- 12.3.6 Segment CAGR and Growth Drivers
- 12.3.7 Subsegment Market Size and Forecast
- 12.3.7.1 Live Auction Commerce
- 12.3.7.2 Creator Affiliate Live Commerce
- 12.3.7.3 Hosted Demonstration Retail
- 12.3.7.4 Shoppable Streaming
- 12.3.7.5 One-to-One Video Selling
- 12.3.8 Subsegment Pricing and Adoption Trends
- 12.3.9 Leading Suppliers and Competition
- 12.3.10 Regional Demand and Opportunities
- 12.4 By Deployment Model - Market Size and Forecast, 2025-2035
- 12.4.1 Segment Definition and Scope
- 12.4.2 Historical Market Size, 2018-2025
- 12.4.3 Revenue Forecast, 2025-2035
- 12.4.4 Volume Forecast, 2025-2035
- 12.4.5 Base-Year Market Share, 2025
- 12.4.6 Segment CAGR and Growth Drivers
- 12.4.7 Subsegment Market Size and Forecast
- 12.4.7.1 Marketplace Integrated
- 12.4.7.2 Social Platform Native
- 12.4.7.3 Retailer-Owned Platform
- 12.4.7.4 FAST and Connected TV
- 12.4.7.5 Syndicated Multi-Platform
- 12.4.8 Subsegment Pricing and Adoption Trends
- 12.4.9 Leading Suppliers and Competition
- 12.4.10 Regional Demand and Opportunities
- 12.5 By End-Use Industry - Market Size and Forecast, 2025-2035
- 12.5.1 Segment Definition and Scope
- 12.5.2 Historical Market Size, 2018-2025
- 12.5.3 Revenue Forecast, 2025-2035
- 12.5.4 Volume Forecast, 2025-2035
- 12.5.5 Base-Year Market Share, 2025
- 12.5.6 Segment CAGR and Growth Drivers
- 12.5.7 Subsegment Market Size and Forecast
- 12.5.7.1 Collectibles and Luxury Goods
- 12.5.7.2 Fashion and Accessories
- 12.5.7.3 Beauty and Personal Care
- 12.5.7.4 Home and Consumer Electronics
- 12.5.7.5 Health and Wellness
- 12.5.8 Subsegment Pricing and Adoption Trends
- 12.5.9 Leading Suppliers and Competition
- 12.5.10 Regional Demand and Opportunities
- 12.6 By Revenue Model - Market Size and Forecast, 2025-2035
- 12.6.1 Segment Definition and Scope
- 12.6.2 Historical Market Size, 2018-2025
- 12.6.3 Revenue Forecast, 2025-2035
- 12.6.4 Volume Forecast, 2025-2035
- 12.6.5 Base-Year Market Share, 2025
- 12.6.6 Segment CAGR and Growth Drivers
- 12.6.7 Subsegment Market Size and Forecast
- 12.6.7.1 Marketplace Commission
- 12.6.7.2 Retail Merchandise Margin
- 12.6.7.3 Affiliate Commission
- 12.6.7.4 Sponsorship and Media Revenue
- 12.6.7.5 Platform Subscription Fees
- 12.6.8 Subsegment Pricing and Adoption Trends
- 12.6.9 Leading Suppliers and Competition
- 12.6.10 Regional Demand and Opportunities
- 12.7 Segment Growth Comparison
- 12.8 Segment Attractiveness and Priority Matrix
Chapter 13 United States Live Video Commerce End-Use and Application Market Outlook
- 13.1 End-Use Industry and Customer Demand Structure
- 13.2 Leading Applications and Customer Groups
- 13.3 End-Use Market Size, Share and Forecast
- 13.4 Major End-Use Industry Deep Dives
- 13.4.1 Customer Requirements and Use Cases
- 13.4.2 Demand and Replacement Cycles
- 13.4.3 Technical and Regulatory Considerations
- 13.4.4 Purchasing and Procurement Models
- 13.4.5 Leading Vendors and Distribution Channels
- 13.4.6 Forecast and Commercial Opportunities
- 13.5 Emerging Applications and Cross-Segment Demand
- 13.6 End-Use Industry Investment Priorities
Chapter 14 United States Live Video Commerce Geographic Market Outlook, 2025-2035
- 14.1 Domestic Market Distribution and Demand Clusters
- 14.2 State- or Province-Wise Market Size and Forecast, 2025-2035
- 14.3 City and Metropolitan Market Outlook
- 14.4 Industrial, Manufacturing and Commercial Clusters
- 14.5 Geographic Concentration of Key End Users
- 14.6 Local Pricing and Purchasing Differences
- 14.7 Domestic Production Facilities and Capacity Map
- 14.8 Local Infrastructure and Project Pipeline
- 14.9 State-Level Policy and Incentive Differences
- 14.10 Subnational Investment Hotspots and Opportunities
- 14.11 Distribution and Logistics Networks
- 14.12 Domestic Competitive Footprint
Chapter 15 United States Live Video Commerce Technology, Innovation and Sustainability Outlook
- 15.1 Technology Landscape and Maturity
- 15.2 Product, Process and Service Innovation
- 15.3 AI, Automation and Digital Tools in the Industry
- 15.4 Technology Adoption and Performance Benchmarking
- 15.5 Innovation Pipeline and R&D Investment
- 15.6 Patent and Intellectual Property Trends
- 15.7 Energy Efficiency and Resource Management
- 15.8 Sustainability, Recycling and Circularity
- 15.9 Technology Roadmap, 2025-2035
- 15.10 Risks of Obsolescence and Technology Substitution
Chapter 16 United States Live Video Commerce Market Key Strategic Imperatives
- 16.1 Growth and Market Entry Priorities
- 16.2 High-Return Products and Segments
- 16.3 Pricing, Profitability and Cost Optimization
- 16.4 Technology Investment and Product Differentiation
- 16.5 Supply Chain Localization and Resilience
- 16.6 Distribution and Customer Acquisition
- 16.7 Partnership, Acquisition and Capacity Strategy
- 16.8 Regional Expansion Priorities
- 16.9 Short-, Medium- and Long-Term Actions
Chapter 17 Competition Outlook
- 17.1 Industry Competition Characteristics
- 17.2 Market Structure and Concentration
- 17.3 Market Share and Competitive Positioning, 2025
- 17.4 Company-Wise Revenue and Product Benchmarking
- 17.5 Production and Service Capacity Benchmarking
- 17.6 Technology, Pricing and Differentiation
- 17.7 Regional Footprint and Distribution Strength
- 17.8 Mergers, Acquisitions and Strategic Alliances
- 17.9 New Entrants and Competitive Threats
- 17.10 Porter's Five Forces and Industry Attractiveness
- 17.11 Competitive Outlook, 2025-2035
Chapter 18 Company Profiles
- 18.1 Company Coverage and Selection Criteria
- 18.2 QVC Inc.
- 18.2.1 Business Description
- 18.2.2 Company Ownership and Geographic Presence
- 18.2.3 Product and Service Portfolio
- 18.2.4 Manufacturing and Operating Footprint
- 18.2.5 Production Capacity and Expansion Plans
- 18.2.6 Financial Performance and Investment
- 18.2.7 Market Share and Competitive Position
- 18.2.8 Technology and Innovation Capabilities
- 18.2.9 Strategic Alliances or Partnerships
- 18.2.10 Recent Developments
- 18.2.11 Growth Strategy and Outlook
- 18.3 TikTok Shop
- 18.4 Whatnot
- 18.5 Amazon Live
- 18.6 YouTube Shopping
- 18.7 eBay Live
- 18.8 TalkShopLive
- 18.9 Fanatics Live
- 18.10 Palmstreet
- 18.11 Popshoplive
- 18.12 Other Relevant Market Participants
Note: Every listed company is profiled on the structure shown under the first company. The company list is preliminary and may change based on research findings, market developments, data availability and client requirements.
Chapter 19 Disclaimer
- 19.1 Research and Forecast Disclaimer
- 19.2 Data Source and Estimation Limitations
Note: The depth of individual sections depends on data availability for this market. Volume, capacity, trade and other unit-based metrics are included where applicable.

