
Market Overview
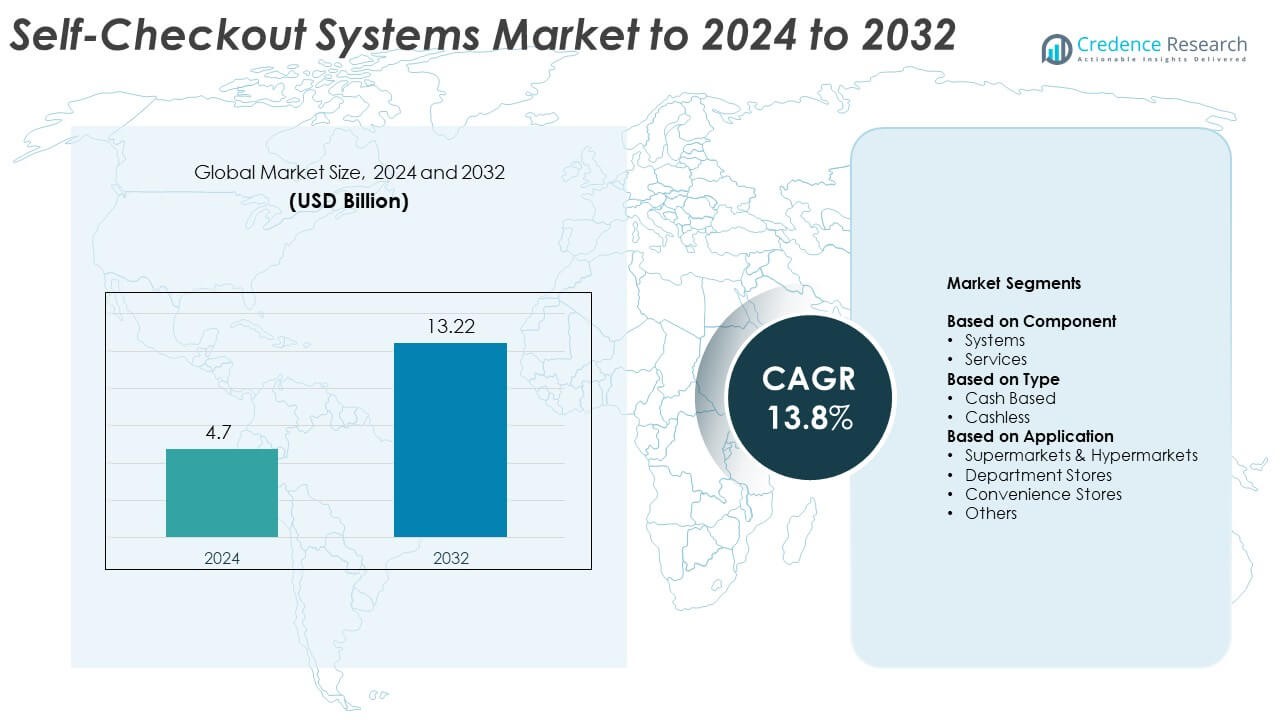
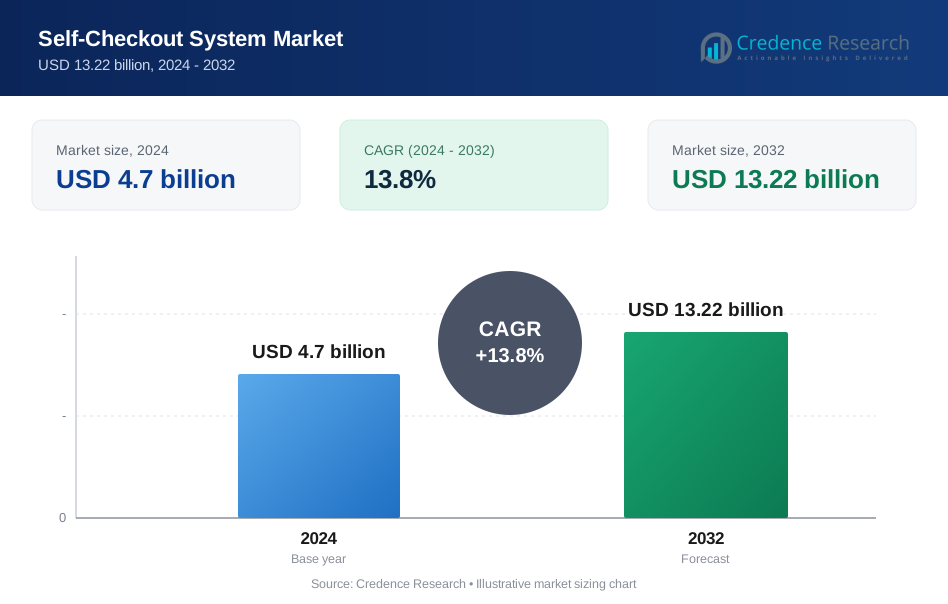
The Self-Checkout System Market size was valued at USD 4.7 billion in 2024 and is anticipated to reach USD 13.22 billion by 2032, at a CAGR of 13.8% during the forecast period.
| REPORT ATTRIBUTE | DETAILS |
|---|---|
| Historical Period | 2020-2023 |
| Base Year | 2024 |
| Forecast Period | 2025-2032 |
| Self-Checkout System Market Size 2024 | USD 4.7 Billion |
| Self-Checkout System Market , CAGR | 13.8% |
| Self-Checkout System Market Size 2032 | USD 13.22 Billion |
The self-checkout system market is led by major players including NCR Corporation, Toshiba Global Commerce Solutions, Diebold Nixdorf, Incorporated, Fujitsu, ITAB, Pyramid Computer GMBH, StrongPoint, Gilbarco Veeder-Root Company, ePOS HYBRID, MetroClick, and Metcalfe. These companies focus on innovation through AI integration, contactless payment solutions, and cloud-based management platforms to enhance retail efficiency. Strategic partnerships with retailers and technology providers further strengthen their global presence. North America dominated the market in 2024 with a 38.6% share, supported by advanced retail infrastructure and widespread adoption of digital payment systems across supermarkets, hypermarkets, and convenience stores.
Market Insights
- The self-checkout system market was valued at USD 4.7 billion in 2024 and is projected to reach USD 13.22 billion by 2032, growing at a CAGR of 13.8%.
- Rising demand for contactless transactions, automation in retail, and reduced labor dependency are key drivers supporting rapid adoption across global retail chains.
- The market is witnessing strong trends in AI-enabled, cashless, and hybrid checkout models that enhance customer convenience and operational efficiency.
- The industry is highly competitive, with companies focusing on product innovation, security integration, and strategic collaborations to expand market presence.
- North America led with 38.6% share in 2024, followed by Europe at 27.4% and Asia-Pacific at 23.8%, while the systems segment dominated by accounting for 68.5% share in the same year.
Market Segmentation Analysis:
By Component
The systems segment dominated the self-checkout system market in 2024, accounting for around 68.5% share. This dominance is driven by rising deployment of advanced kiosks integrated with AI, computer vision, and touchless payment features. Retailers increasingly prefer self-service systems to reduce labor costs and enhance checkout speed. Meanwhile, the services segment is growing steadily due to ongoing maintenance, software upgrades, and technical support requirements. The expansion of smart retail infrastructure across supermarkets and convenience chains continues to strengthen demand for both hardware and managed service offerings.
- For instance, Toshiba Global Commerce Solutions has an installed base of over 3 million POS and self-checkout units worldwide.
By Type
The cashless segment held the largest share of approximately 61.3% in 2024, reflecting the accelerating shift toward digital and contactless payment modes. Growing consumer adoption of mobile wallets and card-based transactions has made cashless self-checkout systems the preferred choice among modern retailers. These systems offer faster transactions, reduced theft risk, and enhanced hygiene. However, cash-based systems remain relevant in regions with limited digital penetration. The global trend toward cashless economies and omnichannel retailing continues to support segment expansion.
- For instance, Datos Insights found 71% of 2024 self-checkout units shipped were card-only (no cash acceptance).
By Application
The supermarkets and hypermarkets segment led the market in 2024, capturing about 49.7% share. The segment’s dominance is driven by the widespread adoption of self-checkout kiosks to manage high customer volumes and optimize floor operations. Large retail chains are deploying multiple terminals per store to minimize queue times and improve customer experience. Department and convenience stores are also adopting compact, modular systems to improve space efficiency. The surge in self-service retail models, especially in urban centers, continues to propel this segment’s growth.
Key Growth Drivers
Rising Demand for Contactless and Efficient Checkout Solutions
Retailers are rapidly adopting self-checkout systems to enhance shopping convenience and minimize queue times. The surge in contactless payment adoption and hygiene awareness since the pandemic has accelerated this shift. Consumers prefer fast, touch-free experiences, while retailers benefit from reduced labor dependency and operational costs. This growing emphasis on automation and digital payment infrastructure continues to drive system deployment across global retail formats.
- For instance, Mashgin processed 440 million transactions in 2024, surpassing 1 billion lifetime by April 2025
Expansion of Smart Retail and AI Integration
The integration of AI, machine learning, and computer vision is transforming self-checkout capabilities. These technologies enable automated product recognition, fraud prevention, and personalized promotions. Retailers are leveraging data analytics from self-checkout systems to improve inventory management and customer engagement. The push for intelligent and connected retail environments is expanding adoption, particularly in developed markets with strong technology infrastructure.
- For instance, Wesco doubled its locations using Mashgin's AI-powered checkout kiosks after a successful pilot, recording a median checkout time of 18.7 seconds
Labor Cost Reduction and Operational Efficiency
Rising labor costs and staffing shortages have pushed retailers toward automation solutions. Self-checkout systems reduce dependency on cashiers, streamline transaction handling, and optimize store management. Large retail chains are investing in scalable kiosk networks to manage increasing customer traffic efficiently. The ability to maintain service quality while minimizing overheads has made these systems a strategic investment across the retail sector.
Key Trends & Opportunities
Adoption of Mobile and Hybrid Checkout Models
The combination of mobile scanning apps and self-checkout kiosks is reshaping retail operations. Customers can scan products using smartphones and complete payments through integrated digital wallets. Hybrid models, combining manned and self-service counters, are gaining traction to balance automation with customer assistance. This shift enhances flexibility and customer satisfaction, creating growth opportunities in both large and small retail formats.
- For instance, FutureProof Retail deployed Scan & Go across 73 Big Y supermarkets, enabling app-based scan-pay-go journeys.
Expansion in Emerging Markets and Small-Format Stores
Emerging economies in Asia-Pacific and Latin America present strong potential for market growth. The rapid modernization of retail infrastructure and digital payment systems supports adoption. Compact and cost-effective self-checkout solutions are being introduced for convenience stores and local retail chains. Increasing urbanization and the rise of organized retail in these regions continue to expand market reach.
- For instance, Carrefour France set a new record for franchise convenience store openings in 2024, with 454 new stores opened.
Key Challenges
High Initial Setup and Maintenance Costs
The deployment of advanced self-checkout systems involves significant upfront investments in hardware, software, and integration. Smaller retailers often face cost barriers when adopting these solutions. Maintenance expenses, including software updates and security management, further add to the total cost of ownership. These financial constraints limit adoption in price-sensitive and developing markets.
Security Risks and System Misuse
Self-checkout systems face challenges related to theft, barcode fraud, and scanning errors. Retailers must invest in AI-driven monitoring tools and smart cameras to prevent losses. Despite advancements, system misuse and intentional under-scanning remain common issues. Balancing customer convenience with robust security mechanisms continues to be a critical operational challenge for market players.
Regional Analysis
North America North America dominated the self-checkout system market in 2024, holding around 38.6% share. The region’s growth is supported by the strong presence of retail giants and advanced payment infrastructure. High consumer preference for contactless shopping and labor cost optimization drives adoption across supermarkets, hypermarkets, and department stores. The United States remains the primary contributor, with rapid expansion of AI-integrated and cashless kiosks. Growing focus on operational efficiency and customer experience continues to boost the deployment of self-checkout systems across major retail chains in the region.
Europe
Europe accounted for approximately 27.4% share of the global market in 2024. The region benefits from strong regulatory support for digital payments and the widespread adoption of self-service technologies in retail. Major retailers in the United Kingdom, Germany, and France are expanding the use of advanced kiosks to improve customer throughput. The growing emphasis on sustainability and automation within European retail operations is further enhancing system deployment. Increasing demand for hybrid checkout formats combining convenience and security strengthens the market’s position across the continent.
Asia-Pacific
Asia-Pacific held about 23.8% market share in 2024 and is expected to grow at the fastest pace. The region’s expansion is driven by rapid retail digitization in China, Japan, South Korea, and India. Rising disposable incomes, urbanization, and smartphone-based payments are promoting self-checkout adoption. Local and international retailers are integrating AI-enabled kiosks in hypermarkets and convenience stores to improve operational efficiency. The region’s growing young consumer base, preference for digital experiences, and government support for cashless economies continue to fuel market growth.
Latin America
Latin America captured nearly 6.1% share of the self-checkout system market in 2024. The region’s growth is supported by increasing adoption of modern retail formats in Brazil, Mexico, and Chile. Expanding supermarket chains and greater use of mobile payments are driving system installations. However, high deployment costs and limited digital infrastructure in smaller economies restrain wider adoption. Retailers are gradually introducing low-cost and modular solutions to enhance affordability and scalability, supporting steady market penetration in the coming years.
Middle East & Africa
The Middle East and Africa region held a 4.1% share of the global market in 2024. Growth is supported by expanding retail investments in the UAE, Saudi Arabia, and South Africa. Rising preference for contactless shopping experiences and smart retail environments drives system deployment in malls and supermarkets. However, adoption remains moderate due to infrastructure gaps in several African markets. Increasing entry of international retail brands and growing consumer acceptance of digital payments are expected to enhance regional adoption over the forecast period.
Market Segmentations:
By Component
- Systems
- Services
By Type
- Cash Based
- Cashless
By Application
- Supermarkets & Hypermarkets
- Department Stores
- Convenience Stores
- Others
By Geography
- North America
- U.S.
- Canada
- Mexico
- Europe
- Germany
- France
- U.K.
- Italy
- Spain
- Rest of Europe
- Asia Pacific
- China
- Japan
- India
- South Korea
- South-east Asia
- Rest of Asia Pacific
- Latin America
- Brazil
- Argentina
- Rest of Latin America
- Middle East & Africa
- GCC Countries
- South Africa
- Rest of the Middle East and Africa
Competitive Landscape
The self-checkout system market is highly competitive, with key players such as NCR Corporation, Toshiba Global Commerce Solutions, Diebold Nixdorf, Incorporated, Fujitsu, ITAB, Pyramid Computer GMBH, StrongPoint, Gilbarco Veeder-Root Company, ePOS HYBRID, MetroClick, and Metcalfe shaping industry dynamics. Market participants focus on integrating advanced technologies like AI, IoT, and cloud-based analytics to enhance user experience and operational efficiency. Companies are investing heavily in R&D to develop scalable and customizable kiosk solutions suitable for different retail formats. Strategic partnerships with payment solution providers and retail chains are driving product innovation and regional expansion. Vendors also emphasize after-sales services, software upgrades, and data security enhancements to maintain long-term customer relationships. The rising demand for hybrid checkout models and contactless payment systems continues to intensify competition, pushing manufacturers to prioritize design flexibility, system reliability, and cost-effectiveness to strengthen their market presence globally.
Key Player Analysis
- NCR Corporation
- Toshiba Global Commerce Solutions
- Diebold Nixdorf, Incorporated
- Fujitsu
- ITAB
- Pyramid Computer GMBH
- StrongPoint
- Gilbarco Veeder-Root Company
- ePOS HYBRID
- MetroClick
- Metcalfe
Recent Developments
- In 2025, Toshiba Global Commerce Solutions introduced its new Modular eXpansion Platform (MxP™) family of self-service solutions.
- In 2024, NCR Voyix (now a separate entity from NCR Atleos) launched its Next Generation Self-Checkout Solution, driven by the NCR Voyix Commerce Platform.
- In 2023, Metcalfe's Market expanded its self-service infrastructure by adding eight self-checkout lanes with Toshiba's Self Checkout System 7.
Report Coverage
The research report offers an in-depth analysis based on Component, Type, Application and Geography. It details leading market players, providing an overview of their business, product offerings, investments, revenue streams, and key applications. Additionally, the report includes insights into the competitive environment, SWOT analysis, current market trends, as well as the primary drivers and constraints. Furthermore, it discusses various factors that have driven market expansion in recent years. The report also explores market dynamics, regulatory scenarios, and technological advancements that are shaping the industry. It assesses the impact of external factors and global economic changes on market growth. Lastly, it provides strategic recommendations for new entrants and established companies to navigate the complexities of the market.
Future Outlook
- The global self-checkout system market will continue expanding due to automation in retail operations.
- Cashless and contactless systems will dominate as digital payments become standard.
- AI-powered kiosks with image recognition and fraud prevention will gain strong adoption.
- Supermarkets and hypermarkets will remain key users, while convenience stores expand adoption.
- Cloud-based software and remote monitoring will enhance kiosk management efficiency.
- Retailers will increasingly adopt hybrid checkout models combining self-service and staff assistance.
- Emerging markets in Asia-Pacific and Latin America will drive future installation growth.
- Compact and modular kiosk designs will attract small-format and urban retail stores.
- Collaboration between payment providers and technology firms will accelerate innovation.
- Sustainability and reduced operational costs will remain major focus areas for retailers globally.
Request a Free Sample
Fill in your details and we'll send you a free sample report.
- Sample data tables & charts
- Research methodology
Need a Custom Version of This Report?
Tailor the scope, geography, or segments to your exact requirements.
- Custom geography or segment scope
- Direct access to our analyst team
Frequently Asked Questions
What is the current market size for Self-Checkout System Market, and what is its projected size in 2032?
At what Compound Annual Growth Rate is the Self-Checkout System Market projected to grow between 2025 and 2032?
Which Self-Checkout System Market segment held the largest share in 2024?
What are the primary factors fueling the growth of the Self-Checkout System Market?
Who are the leading companies in the Self-Checkout System Market?
Which region commanded the largest share of the Self-Checkout System Market in 2024?
Table of Content
Chapter 1. Report Introduction
- 1.1 Report Description & Purpose
- 1.1.1 Report Title & Market Definition
- 1.1.2 Unique Selling Propositions (USP) & Key Differentiators
- 1.1.3 Value Proposition for Stakeholders
- 1.2 Research Objectives
- 1.2.1 Market Sizing Objectives (Volume & Revenue) (Volume Where Applicable)
- 1.2.2 Segmentation Objectives
- 1.2.3 Competitive Intelligence Objectives
- 1.2.4 Forecast & Scenario Objectives
- 1.3 Report Scope
- 1.3.1 Self-Checkout System Scope – Segments & Subsegments Covered
- 1.3.2 Geographic Scope – Regions & Countries Covered
- 1.3.3 Historical Period, Base Year & Forecast Period (2024; forecast to 2032)
- 1.3.4 Inclusions & Exclusions
- 1.4 Industry Classification & Applicable Codes
- 1.5 Currency, Measurement Units & Valuation Basis
- 1.6 Target Stakeholders
- 1.7 Limitations & Assumptions
Chapter 2. Executive Summary
- 2.1 Global Self-Checkout System Market Snapshot
- 2.1.1 Market Size – Historical (2024) & Forecast (2024-2032) (2024: USD 4.7 billion → 2032: USD 13.22 billion)
- 2.1.2 Volume & Revenue – Global Totals (Volume Where Applicable)
- 2.1.3 Key Market Highlights – Top Five Facts
- 2.2 Self-Checkout System Market Segmentation Snapshot
- 2.2.1 Market Split by Region – 2024 vs. 2032
- 2.3 Competitive Snapshot
- 2.3.1 Top 10 Players by Revenue Share – 2024
- 2.3.2 Top 10 Players by Volume Share – 2024 (Volume Where Applicable)
- 2.3.3 Recent Strategic Developments (18-Month Summary)
- 2.4 Key Investment Highlights & Strategic Conclusions
Chapter 3. Self-Checkout System Market Dynamics & Industry Analysis
- 3.1 Market Overview & Context
- 3.1.1 Self-Checkout System Market Position in the Broader Industry Value Chain
- 3.1.2 Demand Structure & Purchasing Dynamics
- 3.1.3 Market Maturity & Development Stage by Region
- 3.2 Self-Checkout System Market Drivers
- 3.3 Self-Checkout System Market Restraints & Challenges
- 3.4 Self-Checkout System Market Opportunities
- 3.5 Porter's Five Forces Analysis
- 3.5.1 Threat of New Entrants
- 3.5.2 Bargaining Power of Suppliers
- 3.5.3 Bargaining Power of Buyers
- 3.5.4 Threat of Substitutes
- 3.5.5 Competitive Rivalry – Intensity Assessment
- 3.6 Self-Checkout System Value Chain Analysis
- 3.6.1 Upstream – Key Inputs, Resources & Suppliers
- 3.6.1.1 Key Input/Resource 1
- 3.6.1.2 Key Input/Resource 2
- 3.6.1.3 Key Input/Resource 3
- 3.6.2 Midstream – Core Operations & Value Creation
- 3.6.2.1 Operating Model & Process Overview
- 3.6.2.2 Key Operating Locations & Capabilities by Company
- 3.6.3 Downstream – Market Channels & End Users
- 3.6.3.1 Direct Sales & Customer Engagement Channels
- 3.6.3.2 Indirect Sales, Intermediaries & Partner Channels
- 3.6.4 Value Chain Profitability Analysis
- 3.6.1 Upstream – Key Inputs, Resources & Suppliers
- 3.7 PESTEL Analysis
- 3.7.1 Political Factors
- 3.7.2 Economic Factors
- 3.7.3 Social Factors
- 3.7.4 Technological Factors
- 3.7.5 Environmental Factors
- 3.7.6 Legal Factors
- 3.8 Self-Checkout System Supply Chain Analysis
- 3.8.1 Critical Input & Resource Availability Risk Assessment
- 3.8.2 Supplier & Operational Concentration Risk (Geographic Exposure)
- 3.8.3 Supply & Service Disruption Impact Analysis
- 3.9 Regulatory & Policy Landscape
Note: The regulatory and policy landscape section covers regulations based on their applicability to the market, Self-Checkout System category, geography, and scope of the study. Only regulatory frameworks with a material impact on operations, compliance, trade, sustainability, or market access are analyzed in detail.
Chapter 4. Key Investment Pockets & Opportunity Analysis
- 4.1 Self-Checkout System Market Attractiveness Analysis
- 4.1.1 By Region – Investment Attractiveness Matrix (Market Size × CAGR)
- 4.2 Absolute Revenue Growth Opportunity
- 4.2.1 By Region – Absolute Revenue Growth Through 2032
- 4.3 Incremental Demand Opportunity
- 4.3.1 By Region – Incremental Demand Through 2032
- 4.3.2 Segment – Incremental Demand
- 4.4 Emerging Submarket Opportunity Deep Dive (Subject to Applicability)
- 4.5 Priority Market Opportunity Scorecards
- 4.5.1 United States
- 4.5.2 Europe
- 4.5.3 Asia
- 4.5.4 Middle East & Africa
Note: Priority market opportunity scorecards reflect the geographic scope and strategic relevance of the study. Listed markets are indicative and may be adapted to the industry.
Chapter 5. Self-Checkout System Cross-Border Trade & Market Access Analysis
- 5.1 International Trade & Cross-Border Activity Overview
- 5.1.1 Global Export Value by Country (2024)
- 5.1.2 Global Export Volume by Country (2024) (Volume Where Applicable)
- 5.1.3 Global Import Value by Country (2024)
- 5.1.4 Global Import Volume by Country (2024) (Volume Where Applicable)
- 5.1.5 Net Trade Balance by Country (2024)
- 5.2 Export Analysis – Segment
- 5.2.1 Category 1 (Applicable Classification Code)
- 5.2.2 Category 2 (Applicable Classification Code)
- 5.2.3 Category 3 (Applicable Classification Code)
- 5.2.4 Category 4 (Applicable Classification Code)
- 5.2.5 Category 5 (Applicable Classification Code)
- 5.3 Import Analysis – Segment
- 5.3.1 Category 1 (Applicable Classification Code)
- 5.3.2 Category 2 (Applicable Classification Code)
- 5.3.3 Category 3 (Applicable Classification Code)
- 5.3.4 Category 4 (Applicable Classification Code)
- 5.3.5 Category 5 (Applicable Classification Code)
- 5.4 Cross-Border Pricing & Transaction Benchmarks
- 5.4.1 Export Pricing – Segment & Country
- 5.4.2 Import Pricing – Segment & Source Country
- 5.4.3 Price Trends (2024)
- 5.5 Key Cross-Border Trade & Delivery Routes
- 5.5.1 Cross-Border Trade/Delivery Route 1
- 5.5.2 Cross-Border Trade/Delivery Route 2
- 5.5.3 Cross-Border Trade/Delivery Route 3
- 5.5.4 Cross-Border Trade/Delivery Route 4
- 5.5.5 Cross-Border Trade/Delivery Route 5
- 5.6 Trade Policy & Market Access Impact Assessment
- 5.6.1 Tariff & Non-Tariff Barriers
- 5.6.2 Regional Trade & Economic Integration Frameworks
- 5.6.3 Bilateral & Multilateral Trade Agreements
- 5.6.4 Cross-Border Operating, Licensing & Localization Requirements
Note: This chapter applies where cross-border trade or delivery is relevant to Self-Checkout System. Goods, services, and digital offerings are assessed using applicable classifications and transaction measures. Import-export volumes, trade balances, and route analyses are included only where meaningful to the market.
Chapter 6. Competitive Landscape & Company Benchmarking
- 6.1 Self-Checkout System Market Concentration & Structure
- 6.1.1 Herfindahl-Hirschman Index (HHI) – vs. 2024
- 6.1.2 Leading, Mid-Sized & Emerging Player Structure
- 6.1.3 Global, Regional & Local Player Dynamics
- 6.2 Self-Checkout System Market Share Analysis – 2024
- 6.2.1 Global Revenue Share by Company
- 6.2.2 Global Volume Share by Company (Volume Where Applicable)
- 6.2.3 Regional Revenue Share
- 6.2.4 Market Share Evolution ( vs. 2024)
- 6.2.5 Company Market Share by Key Segment
- 6.2.6 Company Market Share by Customer Group
- 6.3 Operating Scale, Capacity & Infrastructure Analysis
- 6.3.1 Global Operating Scale & Supply Capacity
- 6.3.2 Resource Utilization & Operating Efficiency
- 6.3.3 Output, Service Delivery & Activity Metrics
- 6.3.4 Operating Footprint & Infrastructure Map
- 6.3.5 Planned Operational & Capacity Expansion
- 6.4 Self-Checkout System Competitive Benchmarking Matrix
- 6.4.1 Revenue, Growth, Profitability & Operating Metric Comparison
- 6.4.2 Channel Revenue Mix
- 6.4.3 Geographic Revenue Exposure
- 6.4.4 R&D Intensity
- 6.4.5 Sustainability Maturity
- 6.5 Strategic Developments in Self-Checkout System (Last 24 Months)
- 6.5.1 Mergers, Acquisitions & Divestments
- 6.5.2 New Products, Services & Solutions in Self-Checkout System
- 6.5.3 Operational & Infrastructure Expansions
- 6.5.4 Strategic Alliances, Joint Ventures & Partnerships
- 6.5.5 Distribution Expansion & Market Entry
- 6.5.6 Sustainability & ESG Initiatives
- 6.6 Competitive Strategy Mapping
- 6.6.1 Leader, Challenger, Follower & Niche Classification
- 6.6.2 Pricing Strategy Comparison
- 6.6.3 Channel Strategy Matrix
Note: Strategic developments are included based on their materiality and the availability of reliable information.
Chapter 7. Global Self-Checkout System Market – By Sales & Delivery Channel
- 7.1 Segment Overview
- 7.1.1 Volume & Revenue Split by Channel (2024 & 2032) (Volume Where Applicable)
- 7.1.2 Channel Mix Evolution (2024-2032)
Chapter 8. Regional Market Analysis – Global Overview
- 8.1 Global Regional Overview
- 8.1.1 Regional Volume Share (Volume Where Applicable)
- 8.1.2 Regional Revenue Share
- 8.1.3 Regional Volume by Region (Volume Where Applicable)
- 8.1.4 Regional Revenue by Region
- 8.1.5 Regional Forecast Through 2032
- 8.2 Cross-Regional Segment Analysis
- 8.2.1 By Sales & Delivery Channel
- 8.2.2 By Competitive Positioning & Price Tier
Chapter 9. North America Self-Checkout System Market
- 9.1 United States
- 9.2 Canada
- 9.3 Mexico
Chapter 10. Europe Self-Checkout System Market
- 10.1 Germany
- 10.2 France
- 10.3 Italy
- 10.4 United Kingdom
- 10.5 Spain
- 10.6 Poland
- 10.7 Russia
- 10.8 Netherlands
- 10.9 Belgium
- 10.10 Sweden
- 10.11 Denmark
- 10.12 Norway
- 10.13 Rest of Europe
Chapter 11. Asia Pacific Self-Checkout System Market
- 11.1 China
- 11.2 India
- 11.3 Japan
- 11.4 South Korea
- 11.5 Thailand
- 11.6 Indonesia
- 11.7 Vietnam
- 11.8 Malaysia
- 11.9 Australia
- 11.10 Rest of Asia Pacific
Chapter 12. Latin America Self-Checkout System Market
- 12.1 Brazil
- 12.2 Argentina
- 12.3 Colombia
- 12.4 Chile
- 12.5 Rest of Latin America
Chapter 13. Middle East Self-Checkout System Market
- 13.1 Saudi Arabia
- 13.2 United Arab Emirates
- 13.3 Turkey
- 13.4 Israel
- 13.5 Iran
- 13.6 Rest of the Middle East
Chapter 14. Africa Self-Checkout System Market
- 14.1 South Africa
- 14.2 Egypt
- 14.3 Nigeria
- 14.4 Morocco
- 14.5 Rest of Africa
Chapter 15. Self-Checkout System Company Profiles
- 15.1 [Company 01]
- 15.1.1 Company Overview
- 15.1.2 Key Management Personnel
- 15.1.3 Products & Services Portfolio
- 15.1.4 Financial Performance
- 15.1.5 Key Market Focus & Geographic Presence
- 15.1.6 Recent Developments & Strategic Initiatives
Note: The company profile list is preliminary and may change based on research findings, market developments, data availability, and client requirements.
Chapter 16. Appendices
- Appendix A – List of Abbreviations & Acronyms
- Appendix B – Industry Classification Code Reference – Full Series
- Appendix C – Supply, Output & Operating Capacity Data Tables
- Appendix D – End-Use & Demand Base Tables
- Appendix E – Demand, Adoption & Usage Assumptions
- Appendix F – Pricing & Revenue Metric Reference Tables
- Appendix G – Company Operations & Infrastructure Database
- Appendix H – Cross-Border Trade & Activity Data Tables (Where Applicable)
- Appendix I – Regulatory Summary Tables
- Appendix J – Primary Research Participant List (Anonymized)
- Appendix K – Primary Research Questionnaire Framework
- Appendix L – Data Sources & Bibliography
- Appendix M – Market Size Divergence & Source Comparison
Chapter 17. Research Methodology
- 17.1 Research Framework & Philosophy
- 17.2 Secondary Research – Sources, Hierarchy & Data Extraction
- 17.3 Data Modeling – Bottom-Up & Top-Down Market Sizing
- 17.4 Primary Research – Stakeholder Framework, LOI & Sample Sizes
- 17.5 Forecast Methodology – Regression, Scenario & Sensitivity Analysis
- 17.6 Quality Control – Four-Layer Validation Framework
- 17.7 Limitations & Standard Assumptions
- 17.8 Disclaimer
