Market Overview
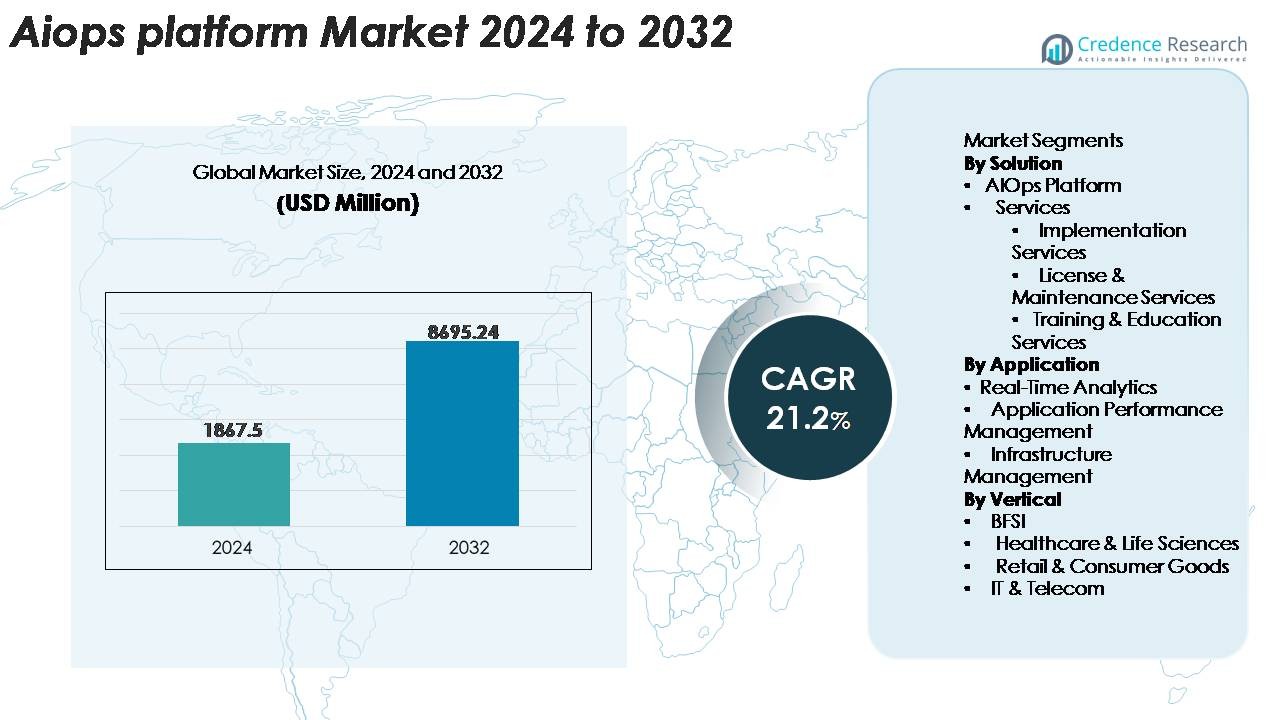
The AIOps Platform Market was valued at USD 1,867.5 million in 2024 and is anticipated to reach USD 8,695.24 million by 2032, at a CAGR of 21.2% during the forecast period.
| REPORT ATTRIBUTE |
DETAILS |
| Historical Period |
2020-2023 |
| Base Year |
2024 |
| Forecast Period |
2025-2032 |
| AIOps Platform Market Size 2024 |
USD 1,867.5 Million |
| AIOps Platform Market, CAGR |
21.2% |
| AIOps Platform Market Size 2032 |
USD 8,695.24Million |
The AIOps platform market is dominated by technology leaders that offer advanced observability, automation, and AI-driven incident intelligence. Key players such as Broadcom, Dynatrace, HCL Technologies Limited, ProphetStor Data Services, Inc., VMware, Splunk Inc., IBM, Micro Focus, BMC Software, and Moogsoft continue to expand their capabilities through predictive analytics, cloud-native integrations, and automated root-cause analysis. These vendors compete by enhancing real-time monitoring, integrating generative AI features, and strengthening multi-cloud operational visibility. North America leads the global AIOps market with an estimated 38% share, supported by strong digital transformation investments, mature IT operations environments, and early enterprise adoption across BFSI, telecom, and technology sectors.
Access crucial information at unmatched prices!
Request your sample report today & start making informed decisions powered by Credence Research Inc.!
Download Sample
Market Insights
- The AIOps platform market was valued at USD 1,867.5 million in 2024 and is projected to reach USD 8,695.24 million by 2032, registering a CAGR of 21.2% during the forecast period.
- Market growth is driven by rapid adoption of hybrid and multi-cloud architectures, rising application complexity, and the need to reduce MTTR through automated incident detection, event correlation, and intelligent remediation workflows.
- Key trends include the integration of generative AI into AIOps workflows, expansion across edge and 5G environments, and increasing convergence of AIOps with SecOps for unified operational intelligence and predictive insights.
- The competitive landscape is shaped by major players such as Broadcom, Dynatrace, Splunk Inc., IBM, VMware, BMC Software, and Moogsoft, all focusing on AI-enhanced observability, automated analytics, and cloud-native scalability to strengthen market positioning.
- Regionally, North America leads with 38%, followed by Europe at 26% and Asia-Pacific at 22%, while segment-wise, the AIOps Platform solution segment dominates due to strong enterprise demand for unified, AI-driven operational visibility.
 Market Segmentation Analysis:
By Solution
The AIOps Platform segment holds the dominant share of the market, driven by its ability to integrate machine learning, event correlation, and automated root-cause analysis into unified operational workflows. Enterprises increasingly prioritize full-stack observability and predictive issue prevention, strengthening demand for platform-centric deployments over standalone services. Implementation Services show steady growth as organizations expand cloud-native architectures and modernize legacy IT estates, while License & Maintenance Services benefit from continuous update cycles. Training & Education Services gain traction as enterprises upskill teams to utilize AI-driven analytics and automation more effectively.
- For instance, Dynatrace’s Grail data-lakehouse processes multiple petabytes of telemetry per day and its Davis AI engine analyzes billions of dependency relationships through Smartscape, enabling highly accurate automated root-cause analysis across complex enterprise environments.
By Application
Application Performance Management (APM) represents the leading application segment, supported by its high adoption in environments requiring continuous monitoring of microservices, distributed applications, and hybrid cloud workloads. Organizations leverage APM-enabled AIOps to detect anomalies, optimize resource usage, and reduce downtime. Real-Time Analytics is expanding rapidly due to the rise of event-driven architectures and the need for instant incident insights. Infrastructure Management also shows strong uptake as enterprises automate capacity forecasting and configuration drift detection. The Others category includes niche use cases where AI augments specialized operational workflows.
· For instance, Splunk Observability Cloud uses a NoSample™ full-fidelity tracing model that captures 100% of application spans without sampling, allowing deep real-time visibility across distributed services. The platform correlates logs, metrics, and traces with millisecond-level granularity to improve anomaly detection and reduce mean-time-to-resolution in complex APM environments.
By Vertical
The BFSI sector dominates the market as financial institutions deploy AIOps to enhance service reliability, accelerate incident remediation, and ensure compliance across complex, high-volume transaction environments. AIOps platforms help banks reduce downtime, strengthen fraud detection workflows, and support real-time monitoring of digital channels. Healthcare & Life Sciences follow with increasing adoption to manage clinical system uptime and secure data flows. Retail & Consumer Goods use AIOps to optimize e-commerce performance and supply chain systems, while IT & Telecom remain major adopters due to extensive network infrastructure automation needs.
Key Growth Drivers
Rapid Expansion of Hybrid and Multi-Cloud Environments
The accelerated migration toward hybrid and multi-cloud architectures is a major growth driver for AIOps platforms. Enterprises running workloads across public clouds, private clouds, and on-premise environments face heightened complexity in monitoring, alert correlation, and performance management. Traditional IT operations tools cannot process the massive volume, variety, and velocity of telemetry data generated from distributed systems. AIOps platforms address this gap by applying machine learning to detect anomalies, automate event correlation, and deliver predictive insights at scale. Growing observability demands, fueled by microservices, Kubernetes clusters, and API-driven applications, further increase reliance on unified AIOps solutions. As organizations seek end-to-end visibility and faster incident resolution, AIOps adoption strengthens across digital-first enterprises, financial institutions, telecom networks, and hyperscale infrastructures.
· For instance, New Relic’s Telemetry Data Platform processes full-fidelity metrics, logs, events, and distributed traces in real time through its petabyte-scale architecture, enabling unified correlation and millisecond-level querying across hybrid and multi-cloud environments.
Rising Need for Automated Incident Management and Reduced MTTR
The increasing business cost of downtime and service degradation is driving strong demand for AIOps-enabled automation. Organizations are prioritizing tools that reduce Mean Time to Detect (MTTD) and Mean Time to Resolve (MTTR) through real-time anomaly detection, automated root-cause analysis, and intelligent alert suppression. AIOps platforms provide continuous monitoring and correlation of logs, metrics, traces, and events, enabling IT teams to identify issues before they impact users. The shift toward proactive operations rather than reactive troubleshooting supports greater operational resilience in sectors like banking, healthcare, retail, and telecom. Automation of repetitive tasks, such as incident triage, ticket enrichment, and remediation scripts, further enhances team efficiency. As digital experiences become central to customer loyalty, enterprises increasingly view AIOps as a strategic requirement for maintaining uptime and optimizing IT service delivery.
- For instance, PagerDuty’s Operations Cloud applies machine learning to compress noise, group related alerts, and orchestrate automated responses, allowing enterprises to cut manual triage workloads at scale. The platform is designed for petabyte-level data ingestion and real-time event routing, supporting high-volume hybrid and multi-cloud operations across global deployments.
Growth of Observability, Analytics-Driven Decisioning, and Data Volume Explosion
Modern enterprise ecosystems generate massive volumes of machine data from applications, network nodes, cloud platforms, IoT devices, and security systems. This exponential growth in telemetry is a key driver behind the rapid adoption of AIOps platforms. Organizations require scalable AI-driven analytics to extract actionable insights from unstructured data and eliminate blind spots within critical systems. AIOps platforms integrate observability, business analytics, and predictive intelligence, enabling IT teams to anticipate system behavior and align operations with business outcomes. The combination of contextual insights, behavioral baselining, and automated anomaly detection enhances decision-making speed and accuracy. As data continues to proliferate across distributed environments, AIOps becomes integral to managing operational complexity, improving reliability, and supporting high-velocity digital transformation.
Key Trends & Opportunities
Adoption of GenAI-Integrated AIOps for Intelligent Automation
A significant industry trend is the integration of generative AI capabilities into AIOps platforms to enhance decision intelligence and operational automation. GenAI-driven copilots assist IT teams by summarizing incidents, generating remediation scripts, and explaining root-cause insights in natural language. Vendors are embedding LLM-powered assistants into observability dashboards, enabling faster triage, guided troubleshooting, and policy generation. This convergence of AIOps and GenAI unlocks opportunities for autonomous incident response, predictive maintenance, and context-aware workflow orchestration. The trend is particularly strong in enterprise segments where IT teams manage large distributed operations with limited human resources. As GenAI models improve accuracy, organizations increasingly deploy AI-driven operational assistants to accelerate resolution times, reduce manual workload, and support 24/7 operational continuity.
- For instance, Dynatrace’s Davis CoPilot announced in July 2023 and generally available since late 2024 leverages the Grail data lakehouse, which is purpose-built to ingest, store, and analyze unified observability, security, and business data at exabyte scale, enabling contextual analytics across hybrid and multicloud environments.
Expansion of AIOps in Edge, 5G, and Distributed IT Environments
The rapid growth of edge computing and 5G networks presents major opportunities for AIOps platforms. Edge devices and low-latency applications generate continuous telemetry that requires real-time correlation and automated remediation. AIOps solutions help organizations manage this complexity by offering distributed observability and predictive insights across geographically dispersed infrastructures. Telecom operators, manufacturing plants, logistics hubs, and smart city ecosystems are increasingly integrating AIOps to ensure reliable service performance at the edge. As 5G rollouts accelerate, network operators use AIOps for capacity forecasting, dynamic configuration management, and automated fault isolation. The rise of decentralized IT architectures positions AIOps as a critical enabler of high-availability, low-latency operational ecosystems.
· For instance, Ericsson’s Cognitive Software suite enhanced in 2024 to include Explainable AI uses globally trained AI models to provide root-cause reasoning, automated network event analysis and AI-driven network design and optimisation. This allows communication service providers to move from manual tuning toward data-driven, model-based network optimisation across RAN and core network domains.
Growing Opportunities in Security-Integrated AIOps (SecOps + AIOps Convergence)
A rising trend is the convergence between AIOps and security operations, enabling organizations to unify performance monitoring and threat detection. As cyberattacks evolve and IT infrastructures become more distributed, SecOps teams require cross-domain insights that combine operational anomalies with security alerts. AIOps platforms offer this convergence by correlating behavioral deviations, access patterns, and infrastructure telemetry. This integration enhances early threat identification and reduces false positives through intelligent event enrichment. The approach supports zero-trust architectures and strengthens resilience across high-risk sectors such as banking, healthcare, and telecom. Vendors are expanding platform capabilities to include AI-driven threat intelligence, creating new opportunities for hybrid AIOps–SecOps solutions.
Key Challenges
Data Integration Complexity and Lack of Standardization
Despite widespread interest, many organizations face significant challenges in consolidating data from diverse monitoring tools, legacy systems, cloud environments, and custom applications. AIOps platforms rely heavily on high-quality, structured, and well-correlated telemetry, but disparate ecosystems often lack standardization. Integrating logs, metrics, events, and traces into a unified data layer requires complex configuration and advanced data engineering. This slows implementation timelines and limits the accuracy of machine-learning insights. Additionally, inconsistent data formats, API fragmentation, and siloed operations tools create barriers to achieving full-stack visibility. Enterprises must invest in data normalization, connector development, and governance frameworks to effectively operationalize AIOps at scale.
Skill Gaps, Adoption Resistance, and High Deployment Complexity
AIOps adoption is frequently hindered by organizational resistance and skill shortages in machine learning, automation engineering, and advanced observability practices. Many IT teams lack experience with AI-driven workflows, leading to reluctance in transitioning from manual operations to automated decisioning. Deployment complexity also poses a challenge, as AIOps requires tuning of ML models, configuration of correlation rules, and alignment with existing ITSM processes. Budget constraints and concerns about vendor lock-in further slow adoption. Without proper training and cultural readiness, organizations struggle to fully leverage AIOps capabilities, limiting automation potential and reducing return on investment.
Regional Analysis
North America
North America holds the largest share of the AIOps platform market at around 38%, driven by strong cloud adoption, advanced IT modernization initiatives, and early integration of AI-driven observability tools across enterprises. The U.S. leads deployment as organizations prioritize automated incident response, predictive analytics, and hybrid-cloud performance monitoring. High investments from BFSI, telecom, and digital-native companies further accelerate adoption, while hyperscale cloud providers continue integrating AIOps into managed services portfolios. The region also benefits from strong vendor presence, mature DevOps cultures, and rising demand for AI-enabled IT operations across large enterprise ecosystems.
Europe
Europe accounts for approximately 26% of the global AIOps platform market, supported by rapid digital transformation efforts across Germany, the U.K., France, and the Nordics. Enterprises increasingly adopt AIOps to enhance infrastructure visibility, manage complex multi-cloud environments, and meet stringent uptime requirements. The region’s strong regulatory focus on operational resilience particularly in BFSI and critical infrastructure boosts demand for automated monitoring and anomaly detection. Expanding adoption of 5G networks and Industry 4.0 initiatives further drives investments. European organizations also emphasize data governance and compliance, pushing vendors to offer localized analytics and secure cloud-integrated AIOps frameworks.
Asia-Pacific (APAC)
Asia-Pacific represents the fastest-growing region with a market share of roughly 22%, fueled by widespread cloud migration, expanding digital services, and rapid growth of telecom and fintech ecosystems. Countries such as China, India, Japan, and South Korea accelerate adoption as enterprises modernize IT operations to support high-volume digital workloads and edge-based applications. AIOps platforms gain traction for real-time analytics, automated remediation, and performance optimization across large distributed infrastructures. Government-led digitalization programs, rising e-commerce activity, and hyperscale data center expansion significantly strengthen regional demand. Increasing adoption of AI and automation across enterprises positions APAC as a key growth engine.
Latin America
Latin America holds about 8% of the global AIOps platform market, with adoption gradually increasing across Brazil, Mexico, Chile, and Colombia. Organizations in BFSI, telecom, and retail are investing in AIOps to reduce operational downtime, manage hybrid-cloud performance, and streamline IT incident response. The region’s growing digital services ecosystem, combined with rising integration of cloud-based applications, drives the need for real-time anomaly detection and automated operations. Budget constraints slow adoption in smaller enterprises, but interest is rising as managed service providers introduce cost-efficient AIOps solutions. Telecom modernization and fintech expansion further strengthen regional opportunities.
Middle East & Africa (MEA)
The Middle East & Africa region accounts for around 6% of the global market, supported by increasing digital transformation programs in the UAE, Saudi Arabia, South Africa, and Qatar. Large enterprises and government agencies adopt AIOps to enhance infrastructure reliability, strengthen cybersecurity posture, and support cloud migration strategies. The region’s growing investment in smart city initiatives, data centers, and 5G rollouts creates new demand for AI-driven operational intelligence. Although adoption remains slower in emerging markets due to limited automation maturity, expanding partnerships with global cloud providers and system integrators is accelerating AIOps deployment across key sectors.
Market Segmentations:
By Solution
- AIOps Platform
- Services
- Implementation Services
- License & Maintenance Services
- Training & Education Services
By Application
- Real-Time Analytics
- Application Performance Management
- Infrastructure Management
By Vertical
- BFSI
- Healthcare & Life Sciences
- Retail & Consumer Goods
- IT & Telecom
By Geography
- North America
- Europe
- Germany
- France
- U.K.
- Italy
- Spain
- Rest of Europe
- Asia Pacific
- China
- Japan
- India
- South Korea
- South-east Asia
- Rest of Asia Pacific
- Latin America
- Brazil
- Argentina
- Rest of Latin America
- Middle East & Africa
- GCC Countries
- South Africa
- Rest of the Middle East and Africa
Competitive Landscape
The competitive landscape of the AIOps platform market is characterized by a mix of global technology leaders, cloud providers, and specialized AI-driven observability vendors competing to deliver advanced automation and predictive intelligence capabilities. Leading players focus on expanding their product portfolios with enhanced machine-learning models, unified data layers, and integration-rich architectures that support hybrid, multi-cloud, and edge environments. Strategic priorities include strengthening anomaly detection, improving real-time analytics, and enabling autonomous remediation through low-code and no-code workflows. Vendors increasingly partner with cloud hyperscalers, IT service providers, and DevOps platforms to accelerate enterprise adoption and broaden deployment ecosystems. Market competition also intensifies as companies integrate generative AI features, such as virtual assistants and natural-language incident analysis, to differentiate user experience. Continuous innovation, ecosystem partnerships, and scalable AI frameworks shape the competitive dynamics, with vendors targeting BFSI, telecom, healthcare, and digital-native enterprises seeking high availability and operational resilience.
Key Player Analysis
- Broadcom
- Dynatrace
- HCL Technologies Limited
- ProphetStor Data Services, Inc.
- VMware
- Splunk Inc.
- IBM
- Micro Focus
- BMC Software
- Moogsoft
Recent Developments
- In November 2025, Dynatrace announced a preview of a purpose-built cloud operations solution for Microsoft Azure that integrates AI-driven observability, automated remediation hints, and deeper telemetry via Microsoft’s Azure SRE Agent.
- In August 2025, VMware (under Broadcom Inc.) announced that its “Private AI Services” would become a standard component of VMware Cloud Foundation 9.0.
- In December 2024, Broadcom unveiled its 3.5D XDSiP technology to enhance semiconductor speeds for generative-AI infrastructure while not AIOps-platform specific, the announcement supports their broader AI/observability stack.
Shape Your Report to Specific Countries or Regions & Enjoy 30% Off!
Report Coverage
The research report offers an in-depth analysis based on Solution, Application, Vertical and Geography. It details leading market players, providing an overview of their business, product offerings, investments, revenue streams, and key applications. Additionally, the report includes insights into the competitive environment, SWOT analysis, current market trends, as well as the primary drivers and constraints. Furthermore, it discusses various factors that have driven market expansion in recent years. The report also explores market dynamics, regulatory scenarios, and technological advancements that are shaping the industry. It assesses the impact of external factors and global economic changes on market growth. Lastly, it provides strategic recommendations for new entrants and established companies to navigate the complexities of the market.
Future Outlook
- AIOps platforms will become core components of enterprise IT operations as organizations shift toward fully autonomous monitoring and remediation.
- Generative AI will significantly enhance incident summarization, automated troubleshooting, and guided remediation workflows across complex environments.
- Hybrid and multi-cloud ecosystems will drive deeper demand for unified observability and cross-domain correlation capabilities.
- Real-time analytics and predictive intelligence will expand, enabling earlier detection of performance anomalies and high-impact outages.
- AIOps adoption will accelerate in telecom and 5G networks to support extreme data volumes and low-latency operational demands.
- Integration between AIOps and SecOps will strengthen, creating unified operational–security intelligence layers for faster threat detection.
- Edge computing growth will increase the need for distributed AIOps models capable of analyzing telemetry at the source.
- Low-code and no-code automation will gain prominence, allowing faster deployment of remediation workflows.
- Industry-specific AIOps frameworks will emerge to address specialized operational requirements in BFSI, healthcare, and manufacturing.
- Vendor consolidation and strategic partnerships with cloud providers will shape competitive dynamics and expand ecosystem capabilities.


