Home » Food & Beverage » Exotic Fruits Market

Exotic Fruits Market By Type (Tropical Fruits, Citrus Fruits, Berries, Stone Fruits, Others); By Distribution Channel (Supermarkets and Hypermarkets, Specialty Stores, Online Retail Platforms, Convenience Stores, Foodservice Providers) – Growth, Share, Opportunities & Competitive Analysis, 2024 – 2032

Report ID: 82494 | Report Format : Excel, PDF

Market Overview:

The Global Exotic Fruits Market size was valued at USD 11,976.75 million in 2018 to USD 20,512.47 million in 2024 and is anticipated to reach USD 36,457.03 million by 2032, at a CAGR of 6.94% during the forecast period.

REPORT ATTRIBUTE DETAILS
Historical Period 2020-2023
Base Year 2024
Forecast Period 2025-2032
Exotic Fruits Market Size 2024 USD 20,512.47 Million
Exotic Fruits Market, CAGR 6.94%
Exotic Fruits Market Size 2032 USD 36,457.03 Million


Healthy eating habits, clean-label trends, and rising use of exotic fruits across beverages, smoothies, bakery items, and nutraceuticals fuel market expansion. Brands highlight antioxidant-rich profiles to attract health-focused shoppers. Quick logistics networks help maintain flavor and freshness across long distances. Farmers adopt improved cultivation techniques to raise yield and quality. Rising demand from vegan and plant-based diets boosts category visibility. Food processors integrate exotic fruit puree and concentrates to meet new product needs.

Asia Pacific leads due to strong production hubs, diverse crop availability, and rising export strength across tropical and subtropical zones. North America gains traction as consumers shift toward premium fresh produce and functional fruit-based foods. Europe shows steady growth driven by clean-label diets and wider specialty fruit imports. Latin America emerges with expanding farming capacity and higher interest from global distributors. Middle Eastern markets grow due to rising household income and demand for premium fruit categories.

Access crucial information at unmatched prices!

Request your sample report today & start making informed decisions powered by Credence Research Inc.!

Download Sample

Market Insights:

  • The Global Exotic Fruits Market was valued at USD 11,976.75 million in 2018, reached USD 20,512.47 million in 2024, and is projected to hit USD 36,457.03 million by 2032, registering a 94% CAGR.
  • Asia Pacific (48.61%), North America (27.43%), and Europe (16.70%) hold the three largest market shares due to strong production capacity, high consumption patterns, mature retail networks, and stable import flows.
  • Asia Pacific stands as the fastest-growing region with its 61% share, driven by large-scale cultivation, strong export infrastructure, and rising domestic demand for premium tropical varieties.
  • Segment distribution shows Tropical Fruits holding the largest share at roughly 38%, supported by strong global preference and broad culinary applications.
  • Citrus Fruits and Berries together contribute about 40%, reflecting steady retail demand and rising use in beverages, snacks, and functional food categories.

Global Exotic Fruits Market Size

Market Drivers:

Rising Demand For Nutrient-Dense Fruits Across Global Consumer Groups

The Global Exotic Fruits Market benefits from wider interest in nutrient-rich produce. Shoppers explore specialty fruit types that offer strong flavor and natural health support. Brands promote exotic varieties to lift product appeal across fresh aisles. Importers expand sourcing networks to secure consistent year-round access. Food and beverage manufacturers use purees and concentrates to lift functional value in packaged lines. Retailers grow assortments to meet rising demand for unique taste profiles. Farmers upgrade cultivation systems to enhance crop output and reduce quality loss. Supply chains strengthen cold handling to protect freshness during long transit.

  • For instance, Dole’s cold-chain capabilities maintain controlled-atmosphere shipping across its dedicated fleet of 13 owned vesselsglobally, supporting stable fruit quality during long-haul transport.

Expanding Use Of Exotic Fruits In Packaged Foods And Beverage Formulations

The Global Exotic Fruits Market gains support from heavy use in juices, smoothies, snacks, and dairy blends. Producers elevate taste quality by pairing tropical profiles with clean-label recipes. Brands create premium product tiers to target health-forward buyers seeking new flavors. Processors use frozen and dehydrated formats to secure stable input supply. Global distributors widen inventory to support private-label offerings. Restaurants and cafes include exotic fruit options to attract younger consumer groups. Producers invest in ripening technologies to improve texture and shelf performance. Packaged food companies scale new formulations to diversify their seasonal menus.

  • For instance, Chiquita operates more than 150 ripening chambers in Europe, each capable of handling over 40,000 boxes of fruit per cycle, enabling consistent quality for processed fruit applications.

Growing Health Awareness And Preference For Clean-Label Fruit Categories

The Global Exotic Fruits Market expands due to rising interest in natural antioxidants and vitamins. Health-focused shoppers choose exotic varieties to support immunity and wellness needs. Retailers improve visibility through dedicated shelves and digital promotions. Producers highlight zero-additive claims to enhance trust among new buyers. Exporters strengthen compliance to meet global safety norms. Nutrition brands use exotic fruit extracts to create fortified functional products. Foodservice chains spotlight exotic fruit blends in premium ranges. Retail chains use buyer analytics to predict demand patterns across key cities.

Stronger Supply Chain Integration And Wider Access Across Modern Retail Channels

The Global Exotic Fruits Market benefits from improved logistics, faster distribution, and wider retail penetration. Importers align with growers to secure stable harvest cycles. Retailers use controlled-atmosphere storage to protect fruit integrity. E-commerce platforms lift access by offering direct-to-home delivery. Processors depend on predictable shipments to support large-scale production lines. Marketing teams highlight traceable sourcing to appeal to conscious consumers. Global buyers form long-term contracts to reduce capacity gaps. Cold chain upgrades help maintain competitive freshness standards.

Global Exotic Fruits Market

Market Trends:

Rising Adoption Of Premium And Specialty Fruit Varieties Across Global Retail Networks

The Global Exotic Fruits Market shows rising traction for rare and premium fruit types. Retailers curate diverse assortments to draw shoppers seeking novelty. Brands position specialty fruits to elevate gourmet and wellness lines. Social media trends boost interest among younger buyers. Importers support this shift with wider origin diversification. Home cooks use exotic fruits in new recipes to expand flavor options. E-commerce platforms create curated bundles to boost category exposure. Foodservice brands test limited-edition menus centered on specialty produce.

  • For instance, Melissa’s Produce supplies over 1,000 specialty fruit and vegetable varieties to retail and foodservice clients, making it one of the largest premium-produce suppliers in the United States.

Growing Popularity Of Functional Fruit-Based Products Across Food And Beverage Lines

The Global Exotic Fruits Market sees stronger demand for functional beverages and diet-focused items. Producers develop high-fiber and antioxidant-forward blends. Nutrition brands introduce exotic fruit shots to appeal to fitness-driven consumers. Dairy lines offer flavored yogurts featuring tropical combinations. Ready-to-drink beverages use exotic fruits to uplift flavor differentiation. Snacks with fruit infusions gain rapid acceptance across retail chains. Restaurants include functional fruit bowls to target wellness-focused diners. Food innovators explore natural sweetening potential to support new recipes.

Expansion Of Controlled-Farming And High-Quality Cultivation Techniques Across Producing Nations

The Global Exotic Fruits Market aligns with advanced farming systems that secure better yields. Growers adopt precision irrigation to improve crop efficiency. Producers manage soil health to protect rare varieties. Exporters invest in post-harvest equipment to minimize damage. Packaging upgrades help preserve delicate textures across long routes. Certification programs gain adoption to validate sustainable practices. Technology firms support traceability to meet buyer expectations. Retailers promote responsibly sourced fruits to lift category trust.

Wider Consumer Engagement Through Culinary Exploration And Digital Food Culture

The Global Exotic Fruits Market gains traction from strong culinary interest across global audiences. Home cooks recreate restaurant-style dishes featuring tropical combinations. Recipe influencers highlight exotic fruit pairings through short-form content. Food bloggers promote seasonal and regional discoveries. Retailers respond with tasting events to drive foot traffic. Importers collaborate with chefs to build premium fruit storytelling. Tourism influences buying patterns by exposing travellers to new flavors. Online platforms boost awareness through continuous trend exposure.

Market Challenges Analysis:

Supply Chain Vulnerability And Sensitivity To Seasonal And Climatic Disruptions

The Global Exotic Fruits Market faces exposure to weather instability and crop variation. Seasonal fluctuations strain availability across import-driven regions. Producers manage yield uncertainty linked to climate pressure. Export timelines shift when harvest cycles move off-track. Importers incur higher costs during low-yield periods. Retailers handle inconsistent supply during peak seasonal swings. Logistics networks adjust routing to protect freshness margins. Brands adjust production volumes to match limited input supply.

Regulatory Complexities And Quality Compliance Burdens Across Multiple Trade Regions

The Global Exotic Fruits Market experiences pressure from strict safety, residue, and labeling norms. Producers follow evolving rules across export markets. Documentation demands raise compliance costs. Importers manage long inspection timelines at major ports. Retailers monitor traceability to meet rising consumer expectations. Foodservice chains evaluate supplier certifications. Brands modify sourcing plans to avoid regulatory delays. Exporters invest in training to reduce shipment rejection risks.

Market Opportunities:

Expansion Potential In Value-Added Fruit Products And Functional Nutrition Categories

The Global Exotic Fruits Market opens strong scope for value-added lines across snacks and beverages. Producers craft fruit powders and frozen inputs for steady supply. Brands use exotic profiles to shape premium wellness lines. Retailers build ready-to-eat assortments to meet convenience needs. Exporters target new health markets with fortified fruit formats. Food innovators integrate exotic fruit extracts to raise flavor strength. Nutrition companies expand tropical-based functional blends. Ingredient firms support new launches through stable processing inputs.

Growth Scope Across Emerging Markets With Rising Urban Income And Modern Retail Access

The Global Exotic Fruits Market benefits from improving urban lifestyles across developing regions. Retail chains expand reach to expose more buyers to specialty produce. Importers strengthen partnerships to widen origin options. Households adopt exotic fruits as part of global food culture. Restaurants add tropical dishes to meet modern dining trends. Tourism boosts long-term interest in regional fruit types. E-commerce platforms elevate accessibility through curated assortments. Emerging cities show strong appetite for premium fruit categories.

Market Segmentation Analysis:

By Type

The Global Exotic Fruits Market covers a diverse mix of fruit categories that shape demand patterns across global trade and retail networks. Tropical fruits hold strong appeal due to wide culinary use and consistent supply from major producing nations. Citrus fruits gain stable traction through juice applications and health-focused consumption. Berries show rapid growth supported by rising interest in antioxidant-rich foods. Stone fruits attract seasonal buyers seeking premium flavor profiles. The “Others” segment includes specialty items that lift category differentiation across gourmet and functional food lines. Producers rely on improved farming methods to strengthen quality and yield. Retailers use targeted assortments to match regional taste preferences. Importers expand sourcing networks to maintain supply continuity across all types.

  • For instance, Fyffesis one of Europe’s largest banana importers that manages farms, sources tropical produce (bananas, pineapples, and melons) from a network of growers in the Americas, and has an annual turnover of €1.2 billion.

By Distribution Channel

The Global Exotic Fruits Market leverages a multi-channel structure that supports broad consumer access across urban and semi-urban regions. Supermarkets and hypermarkets lead due to wide product visibility and strong cold-chain support. Specialty stores attract buyers who prefer rare and premium-grade fruits. Online retail platforms gain rapid traction due to convenience and wider assortment depth. Convenience stores focus on ready-to-eat formats that appeal to fast-moving urban shoppers. Foodservice providers support large-scale demand from restaurants, hotels, and beverage producers. It depends on reliable logistics to maintain freshness across channels. Retailers upgrade storage systems to reduce shrinkage. Digital platforms use data insights to refine assortment planning and seasonal stocking.

  • For instance, a single one of Walmart’s newest highly automated perishable distribution centers serves approximately 180 stores in a region, utilizing AI and robotics to process hundreds of thousands of cases daily and improve fruit availability.

Global Exotic Fruits Market Seg1

Segmentation:

By Type

  • Tropical Fruits
  • Citrus Fruits
  • Berries
  • Stone Fruits
  • Others

By Distribution Channel

  • Supermarkets and Hypermarkets
  • Specialty Stores
  • Online Retail Platforms
  • Convenience Stores
  • Foodservice Providers

By Region

  • North America
    • U.S.
    • Canada
    • Mexico
  • Europe
    • UK
    • France
    • Germany
    • Italy
    • Spain
    • Russia
    • Belgium
    • Netherlands
    • Austria
    • Sweden
    • Poland
    • Denmark
    • Switzerland
    • Rest of Europe
  • Asia Pacific
    • China
    • Japan
    • South Korea
    • India
    • Australia
    • Thailand
    • Indonesia
    • Vietnam
    • Malaysia
    • Philippines
    • Taiwan
    • Rest of Asia Pacific
  • Latin America
    • Brazil
    • Argentina
    • Peru
    • Chile
    • Colombia
    • Rest of Latin America
  • Middle East
    • UAE
    • KSA
    • Israel
    • Turkey
    • Iran
    • Rest of Middle East
  • Africa
    • Egypt
    • Nigeria
    • Algeria
    • Morocco
    • Rest of Africa

Regional Analysis:

North America

The North America Global Exotic Fruits Market size was valued at USD 3,325.29 million in 2018 to USD 5,602.16 million in 2024 and is anticipated to reach USD 10,000.53 million by 2032, at a CAGR of 7.0% during the forecast period. The region holds 27.43% share of the 2032 market. The Global Exotic Fruits Market expands across North America due to strong retail penetration and consistent demand for premium healthy foods. Consumers adopt exotic fruits to support wellness preferences and diverse diets. Retailers curate wide assortments to attract buyers seeking new flavor profiles. Foodservice operators depend on stable imports to meet menu innovation. It relies on advanced cold-chain systems to preserve freshness across long distances. Online grocery platforms lift accessibility for seasonal and rare varieties. Importers work with multiple origins to reduce sourcing risk. Health-driven promotion strengthens category visibility.

Europe

The Europe Global Exotic Fruits Market size was valued at USD 2,314.32 million in 2018 to USD 3,753.92 million in 2024 and is anticipated to reach USD 6,088.57 million by 2032, at a CAGR of 5.7% during the forecast period. The region holds 16.70% share of the 2032 market. The Global Exotic Fruits Market grows across Europe through rising interest in plant-forward diets and sustainable sourcing. Buyers prefer fruits positioned around natural nutrition and clean ingredient claims. Retailers expand import volumes to meet evolving taste trends. Food processors use exotic fruit blends in premium packaged lines. It benefits from strong quality standards that enhance buyer trust. Culinary tourism lifts exposure to tropical flavors. Specialty stores support demand for organic and responsibly sourced produce. Digital promotions increase awareness among younger urban consumers.

Asia Pacific

The Asia Pacific Global Exotic Fruits Market size was valued at USD 5,297.80 million in 2018 to USD 9,404.45 million in 2024 and is anticipated to reach USD 17,722.31 million by 2032, at a CAGR of 7.7% during the forecast period. The region holds 48.61% share of the 2032 market. The Global Exotic Fruits Market strengthens across Asia Pacific due to large production capacity and strong cultural integration of diverse fruit varieties. Farmers use modern cultivation systems to improve yield and quality. Exporters support stable supply to global buyers. Domestic demand grows due to rising income levels and shifting dietary choices. It gains momentum through dynamic retail formats across major cities. Foodservice chains use tropical fruits to expand dessert and beverage menus. E-commerce accelerates access to premium-grade produce. Regional trade agreements support efficient movement of perishable goods.

Latin America

The Latin America Global Exotic Fruits Market size was valued at USD 567.04 million in 2018 to USD 959.12 million in 2024 and is anticipated to reach 1,509.24 million by 2032, at a CAGR of 5.3% during the forecast period. The region holds 4.14% share of the 2032 market. The Global Exotic Fruits Market grows in Latin America due to strong agricultural bases and expanding export participation. Producers cultivate a wide range of tropical varieties suited for global shipment. Retail demand rises in urban centers driven by healthier diet choices. It benefits from continuous development in post-harvest handling. Exporters invest in certifications to meet global safety norms. Farmers adopt improved practices to limit crop loss. Regional distributors widen product portfolios across major cities. International buyers secure long-term supply contracts.

Middle East

The Middle East Global Exotic Fruits Market size was valued at USD 339.48 million in 2018 to 532.06 million in 2024 and is anticipated to reach 799.81 million by 2032, at a CAGR of 4.7% during the forecast period. The region holds 2.19% share of the 2032 market. The Global Exotic Fruits Market expands in the Middle East due to rapid growth in modern retail and rising demand for premium imported produce. Consumers choose exotic fruits to support diverse meal patterns. Retail chains build strong cold-chain capabilities to manage perishable items. Hospitality and tourism sectors lift consumption through high-end menus. It depends heavily on imports due to limited local production. Online fresh-delivery services gain traction among urban buyers. Distributors diversify sourcing nations to manage seasonal gaps. Health-conscious shoppers drive interest in antioxidant-rich varieties.

Africa

The Africa Global Exotic Fruits Market size was valued at USD 132.83 million in 2018 to 260.76 million in 2024 and is anticipated to reach 336.57 million by 2032, at a CAGR of 2.7% during the forecast period. The region holds 0.92% share of the 2032 market. The Global Exotic Fruits Market shows steady progress across Africa supported by expanding commercial farming activity. Local growers develop supply links with regional markets. Export opportunities grow for select tropical categories. Retail demand improves in fast-growing urban zones. It faces challenges linked to infrastructure gaps and distribution complexity. International partners support capability-building programs. Consumers adopt exotic fruits due to rising exposure through retail chains. Foodservice channels stimulate trial and awareness.

Shape Your Report to Specific Countries or Regions & Enjoy 30% Off!

Key Player Analysis:

Competitive Analysis:

The Global Exotic Fruits Market features a competitive landscape shaped by global producers, importers, and integrated distributors. Leading companies expand sourcing networks to secure consistent supply throughout seasonal cycles. Brands differentiate through premium assortments, quality certifications, and wider product traceability. Retail partnerships strengthen visibility across supermarkets and online platforms. It evolves through rising investment in post-harvest technology that protects freshness during transit. Smaller regional suppliers compete through niche varieties and flexible distribution models. Foodservice demand encourages suppliers to scale premium and specialty fruit lines. Market participants invest in digital tools to forecast demand and manage inventory more efficiently.

Recent Developments:

  • In August 2025, Dole plc  announced a landmark strategic combination involving its Fresh Vegetables Division, which marked a significant restructuring in the company’s portfolio. The transaction involved organicgirl, the U.S. market leader in branded organic packaged salads (a portfolio company of Arable Capital Partners), acquiring Dole Fresh Vegetables/Bud Antle division. This combined platform also successfully merged with Braga Fresh, a vertically integrated grower and processor of both conventional and organic vegetables offering salad kits, blends, and fresh-packed vegetables. The acquisition, which closed on August 5, 2025, created a scaled fresh-produce platform with leading positions across whole produce, packaged salads, and organic greens. Tim Stejskal was appointed Chief Executive Officer of the newly combined entity, leveraging his over two decades of experience at Dole Fresh Vegetables/Bud Antle. Additionally, in March 2024, Dole plc completed the sale of its 65% equity stake in Progressive Produce LLC to PTF Holdings (parent company of Pacific Trellis Fruit), a portfolio company of Arable Capital Partners, for USD 120.25 million in gross cash proceeds.
  • Melissa’s Produce, trading as World Variety Produce, has significantly expanded its organic offerings throughout 2024-2025, reflecting the incredible growth of its certified organic program. In July 2024, the company introduced a line of organic baby yams and sweet potatoes at the Organic Produce Summit in Monterey, capitalizing on surging consumer interest in nutrient-dense options. The company’s organic program now features more than 400 certified organic SKUs and has grown 59% since 2017. In 2025, Melissa’s introduced several notable product additions including Organic Coconut, Organic Dragon Fruit, new Clean Snax line of clean-label snack products, and organic versions of Snax products. The company also started the organic Harry’s Berries strawberry season in April 2025, available exclusively through Melissa’s for retailers, and was announced as the official produce partner for the Intuit Dome’s Culinary Program. With over 1,500 different items in its product listing, Melissa’s operates as a premier distributor of specialty fruits and vegetables serving the global market from its warehouse facilities near Los Angeles, California.
  • In November 2024, the Kenyan company Keitt announced the successful launch of two innovative products: ready-to-eat avocados and ready-to-eat mangoes. The product development represented a significant advancement in post-harvest technology, with fruit traceability guaranteed through batch-specific harvesting from single orchards to maintain uniformity of ripeness and taste. Erick Nyansimora, Commercial and Supply Chain Manager of Keitt, reported that each tray contains batch history for easy tracing should any issues arise, with critical factors including harvest region, ripeness, and fruit handling determining product quality. The ready-to-eat avocados had been on retail shelves for two months by November 2024 with positive consumer feedback, while ready-to-eat mangoes had been in market for just over one week with increasing demand. Keitt committed to significant export capacity, with over 1,500 sea containers of Hass avocados per season and over 450 sea containers of mangoes, translating to approximately 40 tons of ripe avocados per week and 25 tons of ripe mangoes per week during season.

Report Coverage:

The research report offers an in-depth analysis based on Type and Distribution Channel segments. It details leading market players, providing an overview of their business, product offerings, investments, revenue streams, and key applications. Additionally, the report includes insights into the competitive environment, SWOT analysis, current market trends, as well as the primary drivers and constraints. Furthermore, it discusses various factors that have driven market expansion in recent years. The report also explores market dynamics, regulatory scenarios, and technological advancements that are shaping the industry. It assesses the impact of external factors and global economic changes on market growth. Lastly, it provides strategic recommendations for new entrants and established companies to navigate the complexities of the market.

Future Outlook:

  • Demand for nutrient-rich exotic fruits will increase across major retail chains.
  • Supply networks will expand through deeper collaboration between exporters and global distributors.
  • Post-harvest technologies will gain adoption to reduce spoilage during long-distance transit.
  • Specialty fruit varieties will rise in popularity within premium consumer groups.
  • E-commerce channels will capture more share through curated fresh-fruit delivery options.
  • Value-added products using exotic fruit purees and powders will grow across food lines.
  • Sustainable farming and certifications will influence purchasing decisions for key markets.
  • Foodservice demand will intensify due to menu innovation in beverages and desserts.
  • Cold-chain expansion will improve product stability across emerging regions.
  • New trade agreements will support smoother cross-border movement of perishable fruit categories.

CHAPTER NO. 1 : INTRODUCTION 24
1.1.1. Report Description 24
Purpose of the Report 24
USP & Key Offerings 24
1.1.2. Key Benefits for Stakeholders 24
1.1.3. Target Audience 25
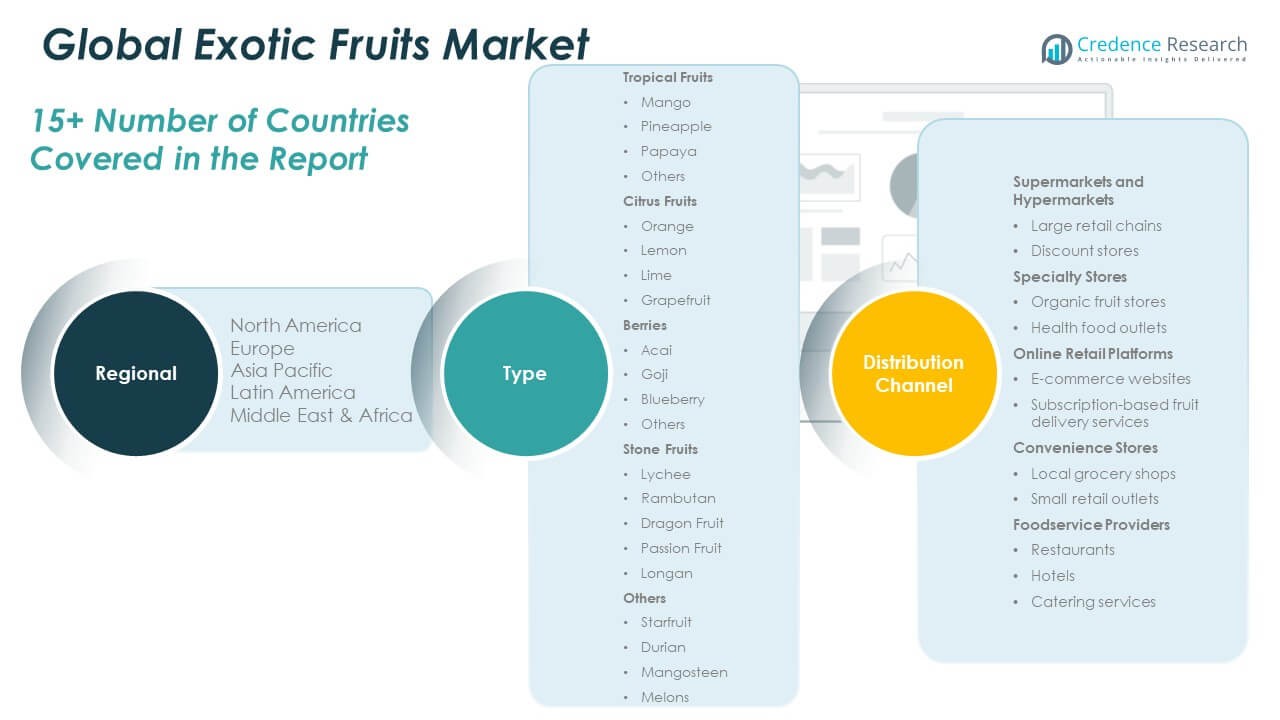
1.1.4. Report Scope 25
1.1.5. Regional Scope 26
CHAPTER NO. 2 : EXECUTIVE SUMMARY 27
2.1. Exotic Fruits Market Snapshot 27
2.1.1. Global Exotic Fruits Market, 2018 – 2032 (Metric Tons) (USD Million) 30
2.2. Insights from Primary Respondents 30
CHAPTER NO. 3 : EXOTIC FRUITS MARKET – INDUSTRY ANALYSIS 31
3.1. Introduction 31
3.2. Market Drivers 32
3.2.1. Rising consumer demand for nutrient-rich and functional foods 32
3.2.2. Expanding global trade and improved cold-chain logistics 33
3.3. Market Restraints 34
3.3.1. High transportation and storage costs for perishable exotic fruits 34
3.4. Market Opportunities 35
3.4.1. Market Opportunity Analysis 35
3.5. Porter’s Five Forces Analysis 36
3.6. Value Chain Analysis 37
3.7. Buying Criteria 38
CHAPTER NO. 4 : IMPORT EXPORT ANALYSIS 39
4.1. Import Analysis by Region 39
4.1.1. Global Exotic Fruits Market Import Volume/Revenue, By Region, 2018 – 2023 39
4.2. Export Analysis by Region 40
4.2.1. Global Exotic Fruits Market Export Volume/Revenue, By Region, 2018 – 2023 40
CHAPTER NO. 5 : PRODUCTION ANALYSIS 41
5.1. Production Analysis by Region 41
5.1.1. Global Exotic Fruits Market Production Volume/Revenue, By Region, 2018 – 2023 41
5.1.2. Global Exotic Fruits Market Production Volume, By Region, 2018 – 2023 (Metric Tons) 42
CHAPTER NO. 6 : PRICE ANALYSIS 43
6.1. Price Analysis by Region 43
6.1.1. Global Exotic Fruits Market Price, By Region, 2018 – 2023 43
6.1.2. Global Type Market Price, By Region, 2018 – 2023 43
6.2. Price Analysis by Type 44
6.2.1. Global Exotic Fruits Market Price, By Type, 2018 – 2023 44
6.2.2. Global Type Market Price, By Type, 2018 – 2023 44
CHAPTER NO. 7 : ANALYSIS COMPETITIVE LANDSCAPE 45
7.1. Company Market Share Analysis – 2023 45
7.1.1. Global Exotic Fruits Market: Company Market Share, by Volume, 2023 45
7.1.2. Global Exotic Fruits Market: Company Market Share, by Revenue, 2023 46
7.1.3. Global Exotic Fruits Market: Top 6 Company Market Share, by Revenue, 2023 46
7.1.4. Global Exotic Fruits Market: Top 3 Company Market Share, by Revenue, 2023 47
7.2. Global Exotic Fruits Market Company Volume Market Share, 2023 48
7.3. Global Exotic Fruits Market Company Revenue Market Share, 2023 49
7.4. Company Assessment Metrics, 2023 50
7.4.1. Stars 50
7.4.2. Emerging Leaders 50
7.4.3. Pervasive Players 50
7.4.4. Participants 50
7.5. Start-ups /SMEs Assessment Metrics, 2023 50
7.5.1. Progressive Companies 50
7.5.2. Responsive Companies 50
7.5.3. Dynamic Companies 50
7.5.4. Starting Blocks 50
7.6. Strategic Developments 51
7.6.1. Acquisitions & Mergers 51
New Product Launch 51
Regional Expansion 51
7.7. Key Players Product Matrix 52
CHAPTER NO. 8 : PESTEL & ADJACENT MARKET ANALYSIS 53
8.1. PESTEL 53
8.1.1. Political Factors 53
8.1.2. Economic Factors 53
8.1.3. Social Factors 53
8.1.4. Technological Factors 53
8.1.5. Environmental Factors 53
8.1.6. Legal Factors 53
8.2. Adjacent Market Analysis 53
CHAPTER NO. 9 : EXOTIC FRUITS MARKET – BY TYPE SEGMENT ANALYSIS 54
9.1. Exotic Fruits Market Overview, by Type Segment 54
9.1.1. Exotic Fruits Market Volume Share, By Type, 2023 & 2032 55
9.1.2. Exotic Fruits Market Revenue Share, By Type, 2023 & 2032 55
9.1.3. Exotic Fruits Market Attractiveness Analysis, By Type 56
9.1.4. Incremental Revenue Growth Opportunity, by Type, 2024 – 2032 56
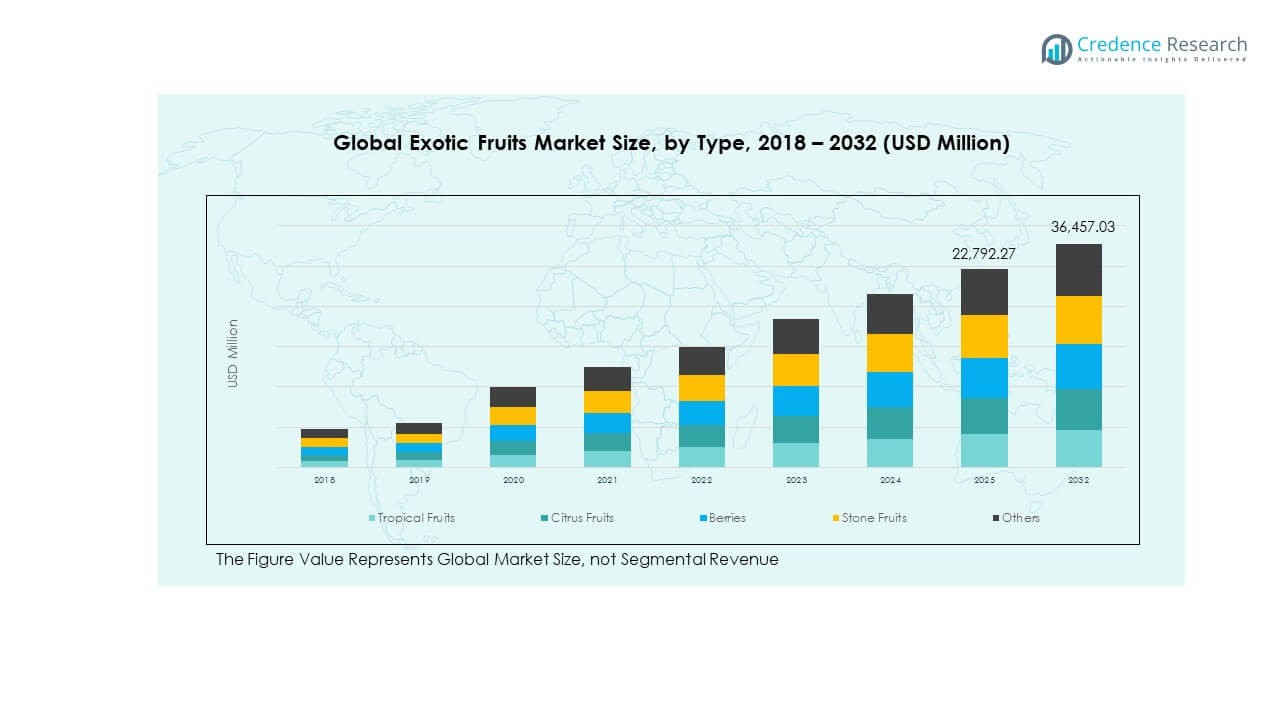
9.1.5. Exotic Fruits Market Revenue, By Type, 2018, 2023, 2027 & 2032 57
9.2. Tropical Fruits 58
9.3. Citrus Fruits 59
9.4. Berries 60
9.5. Stone Fruits 61
9.6. Others 62
CHAPTER NO. 10 : EXOTIC FRUITS MARKET – BY DISTRIBUTION CHANNEL SEGMENT ANALYSIS 63
10.1. Exotic Fruits Market Overview, by Distribution Channel Segment 63
10.1.1. Exotic Fruits Market Volume Share, By Distribution Channel, 2023 & 2032 64
10.1.2. Exotic Fruits Market Revenue Share, By Distribution Channel, 2023 & 2032 64
10.1.3. Exotic Fruits Market Attractiveness Analysis, By Distribution Channel 65
10.1.4. Incremental Revenue Growth Opportunity, by Distribution Channel, 2024 – 2032 65
10.1.5. Exotic Fruits Market Revenue, By Distribution Channel, 2018, 2023, 2027 & 2032 66
10.2. Supermarkets and Hypermarkets 67
10.3. Specialty Stores 68
10.4. Online Retail Platforms 69
10.5. Convenience Stores 70
10.6. Foodservice Providers 71
CHAPTER NO. 11 : EXOTIC FRUITS MARKET – REGIONAL ANALYSIS 72
11.1. Exotic Fruits Market Overview, by Regional Segments 72
11.2. Region 73
11.2.1. Global Exotic Fruits Market Volume Share, By Region, 2023 & 2032 73
11.2.2. Global Exotic Fruits Market Revenue Share, By Region, 2023 & 2032 73
11.2.3. Exotic Fruits Market Attractiveness Analysis, By Region 74
11.2.4. Incremental Revenue Growth Opportunity, by Region, 2024 – 2032 74
11.2.5. Exotic Fruits Market Revenue, By Region, 2018, 2023, 2027 & 2032 75
11.2.6. Global Exotic Fruits Market Volume & Revenue, By Region, 2018 – 2023 (Metric Tons) (USD Million) 76
11.2.7. Global Exotic Fruits Market Volume & Revenue, By Region, 2024 – 2032 (Metric Tons) (USD Million) 76
11.3. Type 77
11.3.1. Global Exotic Fruits Market Volume & Revenue, By Type, 2018 – 2023 (Metric Tons) (USD Million) 77
11.4. Global Exotic Fruits Market Volume & Revenue, By Type, 2024 – 2032 (Metric Tons) (USD Million) 77
11.5. Distribution Channel 78
11.5.1. Global Exotic Fruits Market Volume & Revenue, By Distribution Channel, 2018 – 2023 (Metric Tons) (USD Million) 78
11.5.2. Global Exotic Fruits Market Volume & Revenue, By Distribution Channel, 2024 – 2032 (Metric Tons) (USD Million) 78
CHAPTER NO. 12 : EXOTIC FRUITS MARKET – NORTH AMERICA 80
12.1. North America 80
12.1.1. Key Highlights 80
12.1.2. North America Exotic Fruits Market Volume, By Country, 2018 – 2032 (Metric Tons) 81
12.1.3. North America Exotic Fruits Market Revenue, By Country, 2018 – 2023 (USD Million) 82
12.1.4. North America Exotic Fruits Market Volume, By Type, 2018 – 2023 (Metric Tons) 83
12.1.5. North America Exotic Fruits Market Revenue, By Type, 2018 – 2023 (USD Million) 84
12.1.6. North America Exotic Fruits Market Volume, By Distribution Channel, 2018 – 2023 (Metric Tons) 85
12.1.7. North America Exotic Fruits Market Revenue, By Distribution Channel, 2018 – 2023 (USD Million) 86
12.2. U.S. 87
12.3. Canada 87
12.4. Mexico 87
CHAPTER NO. 13 : EXOTIC FRUITS MARKET – EUROPE 88
13.1. Europe 88
13.1.1. Key Highlights 88
13.1.2. Europe Exotic Fruits Market Volume, By Country, 2018 – 2032 (Metric Tons) 89
13.1.3. Europe Exotic Fruits Market Revenue, By Country, 2018 – 2023 (USD Million) 90
13.1.4. Europe Exotic Fruits Market Volume, By Type, 2018 – 2023 (Metric Tons) 91
13.1.5. Europe Exotic Fruits Market Revenue, By Type, 2018 – 2023 (USD Million) 92
13.1.6. Europe Exotic Fruits Market Volume, By Distribution Channel, 2018 – 2023 (Metric Tons) 93
13.1.7. Europe Exotic Fruits Market Revenue, By Distribution Channel, 2018 – 2023 (USD Million) 94
13.2. UK 95
13.3. France 95
13.4. Germany 95
13.5. Italy 95
13.6. Spain 95
13.7. Russia 95
13.8. Belgium 95
13.9. Netherland 95
13.10. Austria 95
13.11. Sweden 95
13.12. Poland 95
13.13. Denmark 95
13.14. Switzerland 95
13.15. Rest of Europe 95
CHAPTER NO. 14 : EXOTIC FRUITS MARKET – ASIA PACIFIC 96
14.1. Asia Pacific 96
14.1.1. Key Highlights 96
14.1.2. Asia Pacific Exotic Fruits Market Volume, By Country, 2018 – 2032 (Metric Tons) 97
14.1.3. Asia Pacific Exotic Fruits Market Revenue, By Country, 2018 – 2023 (USD Million) 98
14.1.4. Asia Pacific Exotic Fruits Market Volume, By Type, 2018 – 2023 (Metric Tons) 99
14.1.5. Asia Pacific Exotic Fruits Market Revenue, By Type, 2018 – 2023 (USD Million) 100
14.1.6. Asia Pacific Exotic Fruits Market Volume, By Distribution Channel, 2018 – 2023 (Metric Tons) 101
14.1.7. Asia Pacific Exotic Fruits Market Revenue, By Distribution Channel, 2018 – 2023 (USD Million) 102
14.2. China 103
14.3. Japan 103
14.4. South Korea 103
14.5. India 103
14.6. Australia 103
14.7. Thailand 103
14.8. Indonesia 103
14.9. Vietnam 103
14.10. Malaysia 103
14.11. Philippines 103
14.12. Taiwan 103
14.13. Rest of Asia Pacific 103
CHAPTER NO. 15 : EXOTIC FRUITS MARKET – LATIN AMERICA 104
15.1. Latin America 104
15.1.1. Key Highlights 104
15.1.2. Latin America Exotic Fruits Market Volume, By Country, 2018 – 2032 (Metric Tons) 105
15.1.3. Latin America Exotic Fruits Market Revenue, By Country, 2018 – 2023 (USD Million) 106
15.1.4. Latin America Exotic Fruits Market Volume, By Type, 2018 – 2023 (Metric Tons) 107
15.1.5. Latin America Exotic Fruits Market Revenue, By Type, 2018 – 2023 (USD Million) 108
15.1.6. Latin America Exotic Fruits Market Volume, By Distribution Channel, 2018 – 2023 (Metric Tons) 109
15.1.7. Latin America Exotic Fruits Market Revenue, By Distribution Channel, 2018 – 2023 (USD Million) 110
15.2. Brazil 111
15.3. Argentina 111
15.4. Peru 111
15.5. Chile 111
15.6. Colombia 111
15.7. Rest of Latin America 111
CHAPTER NO. 16 : EXOTIC FRUITS MARKET – MIDDLE EAST 112
16.1. Middle East 112
16.1.1. Key Highlights 112
16.1.2. Middle East Exotic Fruits Market Volume, By Country, 2018 – 2032 (Metric Tons) 113
16.1.3. Middle East Exotic Fruits Market Revenue, By Country, 2018 – 2023 (USD Million) 114
16.1.4. Middle East Exotic Fruits Market Volume, By Type, 2018 – 2023 (Metric Tons) 115
16.1.5. Middle East Exotic Fruits Market Revenue, By Type, 2018 – 2023 (USD Million) 116
16.1.6. Middle East Exotic Fruits Market Volume, By Distribution Channel, 2018 – 2023 (Metric Tons) 117
16.1.7. Middle East Exotic Fruits Market Revenue, By Distribution Channel, 2018 – 2023 (USD Million) 118
16.2. UAE 119
16.3. KSA 119
16.4. Israel 119
16.5. Turkey 119
16.6. Iran 119
16.7. Rest of Middle East 119
CHAPTER NO. 17 : EXOTIC FRUITS MARKET – AFRICA 120
17.1. Africa 120
17.1.1. Key Highlights 120
17.1.2. Africa Exotic Fruits Market Volume, By Country, 2018 – 2032 (Metric Tons) 121
17.1.3. Africa Exotic Fruits Market Revenue, By Country, 2018 – 2023 (USD Million) 122
17.1.4. Africa Exotic Fruits Market Volume, By Type, 2018 – 2023 (Metric Tons) 123
17.1.5. Africa Exotic Fruits Market Revenue, By Type, 2018 – 2023 (USD Million) 124
17.1.6. Africa Exotic Fruits Market Volume, By Distribution Channel, 2018 – 2023 (Metric Tons) 125
17.1.7. Africa Exotic Fruits Market Revenue, By Distribution Channel, 2018 – 2023 (USD Million) 126
17.2. Egypt 127
17.3. Nigeria 127
17.4. Algeria 127
17.5. Morocco 127
17.6. Rest of Africa 127
CHAPTER NO. 18 : COMPANY PROFILES 128
18.1. Exotic Fruits Pvt. Ltd. 128
18.1.1. Company Overview 128
18.1.2. Product Portfolio 128
18.1.3. Swot Analysis 128
18.1.4. Business Strategy 128
18.1.5. Financial Overview 129
18.2. Barth Fruit AG/LTD 130
18.3. READY TO EAT 130
18.4. Special Fruit, Dole Plc. 130
18.5. Miami Fruit 130
18.6. Melissa’s/World Variety Produce, Inc. 130
18.7. SOL ORGANICA 130
18.8. Company 8 130
18.9. Company 9 130
18.10. Company 10 130
18.11. Company 11 130
18.12. Company 12 130
18.13. Company 13 130
18.14. Company 14 130
List of Figures
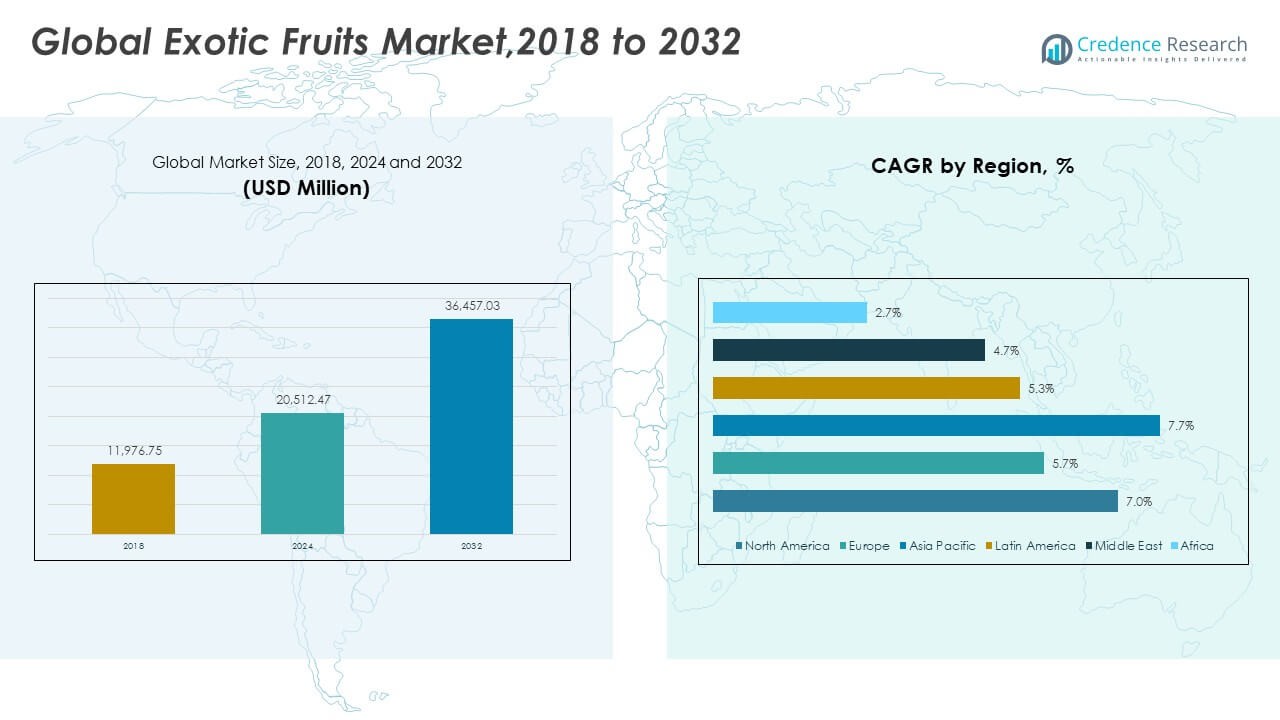
FIG NO. 1. Global Exotic Fruits Market Volume & Revenue, 2018 – 2032 (Metric Tons) (USD Million) 30
FIG NO. 2. Porter’s Five Forces Analysis for Global Exotic Fruits Market 36
FIG NO. 3. Value Chain Analysis for Global Exotic Fruits Market 37
FIG NO. 4. Global Exotic Fruits Market Import Volume/Revenue, By Region, 2018 – 2023 39
FIG NO. 5. Global Exotic Fruits Market Export Volume/Revenue, By Region, 2018 – 2023 40
FIG NO. 6. Global Exotic Fruits Market Production Volume/Revenue, By Region, 2018 – 2023 41
FIG NO. 7. Global Exotic Fruits Market Price, By Region, 2018 – 2023 43
FIG NO. 8. Global Exotic Fruits Market Price, By Type, 2018 – 2023 44
FIG NO. 9. Company Share Analysis, 2023 45
FIG NO. 10. Company Share Analysis, 2023 46
FIG NO. 11. Company Share Analysis, 2023 46
FIG NO. 12. Company Share Analysis, 2023 47
FIG NO. 13. Exotic Fruits Market – Company Volume Market Share, 2023 48
FIG NO. 14. Exotic Fruits Market – Company Revenue Market Share, 2023 49
FIG NO. 15. Exotic Fruits Market Volume Share, By Type, 2023 & 2032 55
FIG NO. 16. Exotic Fruits Market Revenue Share, By Type, 2023 & 2032 55
FIG NO. 17. Market Attractiveness Analysis, By Type 56
FIG NO. 18. Incremental Revenue Growth Opportunity by Type, 2024 – 2032 56
FIG NO. 19. Exotic Fruits Market Revenue, By Type, 2018, 2023, 2027 & 2032 57
FIG NO. 20. Global Exotic Fruits Market for Tropical Fruits, Volume & Revenue (Metric Tons) (USD Million) 2018 – 2032 58
FIG NO. 21. Global Exotic Fruits Market for Citrus Fruits, Volume & Revenue (Metric Tons) (USD Million) 2018 – 2032 59
FIG NO. 22. Global Exotic Fruits Market for Berries, Volume & Revenue (Metric Tons) (USD Million) 2018 – 2032 60
FIG NO. 23. Global Exotic Fruits Market for Stone Fruits, Volume & Revenue (Metric Tons) (USD Million) 2018 – 2032 61
FIG NO. 24. Global Exotic Fruits Market for Others, Volume & Revenue (Metric Tons) (USD Million) 2018 – 2032 62
FIG NO. 25. Exotic Fruits Market Volume Share, By Distribution Channel, 2023 & 2032 64
FIG NO. 26. Exotic Fruits Market Revenue Share, By Distribution Channel, 2023 & 2032 64
FIG NO. 27. Market Attractiveness Analysis, By Distribution Channel 65
FIG NO. 28. Incremental Revenue Growth Opportunity by Distribution Channel, 2024 – 2032 65
FIG NO. 29. Exotic Fruits Market Revenue, By Distribution Channel, 2018, 2023, 2027 & 2032 66
FIG NO. 30. Global Exotic Fruits Market for Supermarkets and Hypermarkets, Volume & Revenue (Metric Tons) (USD Million) 2018 – 2032 67
FIG NO. 31. Global Exotic Fruits Market for Specialty Stores, Volume & Revenue (Metric Tons) (USD Million) 2018 – 2032 68
FIG NO. 32. Global Exotic Fruits Market for Online Retail Platforms, Volume & Revenue (Metric Tons) (USD Million) 2018 – 2032 69
FIG NO. 33. Global Exotic Fruits Market for Convenience Stores, Volume & Revenue (Metric Tons) (USD Million) 2018 – 2032 70
FIG NO. 34. Global Exotic Fruits Market for Foodservice Providers, Volume & Revenue (Metric Tons) (USD Million) 2018 – 2032 71
FIG NO. 35. Global Exotic Fruits Market Volume Share, By Region, 2023 & 2032 73
FIG NO. 36. Global Exotic Fruits Market Revenue Share, By Region, 2023 & 2032 73
FIG NO. 37. Market Attractiveness Analysis, By Region 74
FIG NO. 38. Incremental Revenue Growth Opportunity by Region, 2024 – 2032 74
FIG NO. 39. Exotic Fruits Market Revenue, By Region, 2018, 2023, 2027 & 2032 75
FIG NO. 40. North America Exotic Fruits Market Volume & Revenue, 2018 – 2032 (Metric Tons) (USD Million) 80
FIG NO. 41. Europe Exotic Fruits Market Volume & Revenue, 2018 – 2032 (Metric Tons) (USD Million) 88
FIG NO. 42. Asia Pacific Exotic Fruits Market Volume & Revenue, 2018 – 2032 (Metric Tons) (USD Million) 96
FIG NO. 43. Latin America Exotic Fruits Market Volume & Revenue, 2018 – 2032 (Metric Tons) (USD Million) 104
FIG NO. 44. Middle East Exotic Fruits Market Volume & Revenue, 2018 – 2032 (Metric Tons) (USD Million) 112
FIG NO. 45. Africa Exotic Fruits Market Volume & Revenue, 2018 – 2032 (Metric Tons) (USD Million) 120
List of Tables
TABLE NO. 1. : Global Exotic Fruits Market: Snapshot 27
TABLE NO. 2. : Drivers for the Exotic Fruits Market: Impact Analysis 32
TABLE NO. 3. : Restraints for the Exotic Fruits Market: Impact Analysis 34
TABLE NO. 4. : Global Exotic Fruits Market Production Volume, By Region, 2018 – 2023 (Metric Tons) 42
TABLE NO. 5. : Global Exotic Fruits Market Volume & Revenue, By Region, 2018 – 2023 43
TABLE NO. 6. : Global Exotic Fruits Market Volume & Revenue, By Type, 2018 – 2023 44
TABLE NO. 7. : Global Exotic Fruits Market Volume & Revenue, By Region, 2018 – 2023 (Metric Tons) (USD Million) 76
TABLE NO. 8. : Global Exotic Fruits Market Volume & Revenue, By Region, 2024 – 2032 (Metric Tons) (USD Million) 76
TABLE NO. 9. : Global Exotic Fruits Market Volume & Revenue, By Type, 2018 – 2023 (Metric Tons) (USD Million) 77
TABLE NO. 10. : Global Exotic Fruits Market Volume & Revenue, By Type, 2024 – 2032 (Metric Tons) (USD Million) 77
TABLE NO. 11. : Global Exotic Fruits Market Volume & Revenue, By Distribution Channel, 2018 – 2023 (Metric Tons) (USD Million) 78
TABLE NO. 12. : Global Exotic Fruits Market Volume & Revenue, By Distribution Channel, 2024 – 2032 (Metric Tons) (USD Million) 78
TABLE NO. 13. : North America Exotic Fruits Market Volume, By Country, 2018 – 2023 (Metric Tons) 81
TABLE NO. 14. : North America Exotic Fruits Market Volume, By Country, 2024 – 2032 (Metric Tons) 81
TABLE NO. 15. : North America Exotic Fruits Market Revenue, By Country, 2018 – 2023 (USD Million) 82
TABLE NO. 16. : North America Exotic Fruits Market Revenue, By Country, 2024 – 2032 (USD Million) 82
TABLE NO. 17. : North America Exotic Fruits Market Volume, By Type, 2018 – 2023 (Metric Tons) 83
TABLE NO. 18. : North America Exotic Fruits Market Volume, By Type, 2024 – 2032 (Metric Tons) 83
TABLE NO. 19. : North America Exotic Fruits Market Revenue, By Type, 2018 – 2023 (USD Million) 84
TABLE NO. 20. : North America Exotic Fruits Market Revenue, By Type, 2024 – 2032 (USD Million) 84
TABLE NO. 21. : North America Exotic Fruits Market Volume, By Distribution Channel, 2018 – 2023 (Metric Tons) 85
TABLE NO. 22. : North America Exotic Fruits Market Volume, By Distribution Channel, 2024 – 2032 (Metric Tons) 85
TABLE NO. 23. : North America Exotic Fruits Market Revenue, By Distribution Channel, 2018 – 2023 (USD Million) 86
TABLE NO. 24. : North America Exotic Fruits Market Revenue, By Distribution Channel, 2024 – 2032 (USD Million) 86
TABLE NO. 25. : Europe Exotic Fruits Market Volume, By Country, 2018 – 2023 (Metric Tons) 89
TABLE NO. 26. : Europe Exotic Fruits Market Volume, By Country, 2024 – 2032 (Metric Tons) 89
TABLE NO. 27. : Europe Exotic Fruits Market Revenue, By Country, 2018 – 2023 (USD Million) 90
TABLE NO. 28. : Europe Exotic Fruits Market Revenue, By Country, 2024 – 2032 (USD Million) 90
TABLE NO. 29. : Europe Exotic Fruits Market Volume, By Type, 2018 – 2023 (Metric Tons) 91
TABLE NO. 30. : Europe Exotic Fruits Market Volume, By Type, 2024 – 2032 (Metric Tons) 91
TABLE NO. 31. : Europe Exotic Fruits Market Revenue, By Type, 2018 – 2023 (USD Million) 92
TABLE NO. 32. : Europe Exotic Fruits Market Revenue, By Type, 2024 – 2032 (USD Million) 92
TABLE NO. 33. : Europe Exotic Fruits Market Volume, By Distribution Channel, 2018 – 2023 (Metric Tons) 93
TABLE NO. 34. : Europe Exotic Fruits Market Volume, By Distribution Channel, 2024 – 2032 (Metric Tons) 93
TABLE NO. 35. : Europe Exotic Fruits Market Revenue, By Distribution Channel, 2018 – 2023 (USD Million) 94
TABLE NO. 36. : Europe Exotic Fruits Market Revenue, By Distribution Channel, 2024 – 2032 (USD Million) 94
TABLE NO. 37. : Asia Pacific Exotic Fruits Market Volume, By Country, 2018 – 2023 (Metric Tons) 97
TABLE NO. 38. : Asia Pacific Exotic Fruits Market Volume, By Country, 2024 – 2032 (Metric Tons) 97
TABLE NO. 39. : Asia Pacific Exotic Fruits Market Revenue, By Country, 2018 – 2023 (USD Million) 98
TABLE NO. 40. : Asia Pacific Exotic Fruits Market Revenue, By Country, 2024 – 2032 (USD Million) 98
TABLE NO. 41. : Asia Pacific Exotic Fruits Market Volume, By Type, 2018 – 2023 (Metric Tons) 99
TABLE NO. 42. : Asia Pacific Exotic Fruits Market Volume, By Type, 2024 – 2032 (Metric Tons) 99
TABLE NO. 43. : Asia Pacific Exotic Fruits Market Revenue, By Type, 2018 – 2023 (USD Million) 100
TABLE NO. 44. : Asia Pacific Exotic Fruits Market Revenue, By Type, 2024 – 2032 (USD Million) 100
TABLE NO. 45. : Asia Pacific Exotic Fruits Market Volume, By Distribution Channel, 2018 – 2023 (Metric Tons) 101
TABLE NO. 46. : Asia Pacific Exotic Fruits Market Volume, By Distribution Channel, 2024 – 2032 (Metric Tons) 101
TABLE NO. 47. : Asia Pacific Exotic Fruits Market Revenue, By Distribution Channel, 2018 – 2023 (USD Million) 102
TABLE NO. 48. : Asia Pacific Exotic Fruits Market Revenue, By Distribution Channel, 2024 – 2032 (USD Million) 102
TABLE NO. 49. : Latin America Exotic Fruits Market Volume, By Country, 2018 – 2023 (Metric Tons) 105
TABLE NO. 50. : Latin America Exotic Fruits Market Volume, By Country, 2024 – 2032 (Metric Tons) 105
TABLE NO. 51. : Latin America Exotic Fruits Market Revenue, By Country, 2018 – 2023 (USD Million) 106
TABLE NO. 52. : Latin America Exotic Fruits Market Revenue, By Country, 2024 – 2032 (USD Million) 106
TABLE NO. 53. : Latin America Exotic Fruits Market Volume, By Type, 2018 – 2023 (Metric Tons) 107
TABLE NO. 54. : Latin America Exotic Fruits Market Volume, By Type, 2024 – 2032 (Metric Tons) 107
TABLE NO. 55. : Latin America Exotic Fruits Market Revenue, By Type, 2018 – 2023 (USD Million) 108
TABLE NO. 56. : Latin America Exotic Fruits Market Revenue, By Type, 2024 – 2032 (USD Million) 108
TABLE NO. 57. : Latin America Exotic Fruits Market Volume, By Distribution Channel, 2018 – 2023 (Metric Tons) 109
TABLE NO. 58. : Latin America Exotic Fruits Market Volume, By Distribution Channel, 2024 – 2032 (Metric Tons) 109
TABLE NO. 59. : Latin America Exotic Fruits Market Revenue, By Distribution Channel, 2018 – 2023 (USD Million) 110
TABLE NO. 60. : Latin America Exotic Fruits Market Revenue, By Distribution Channel, 2024 – 2032 (USD Million) 110
TABLE NO. 61. : Middle East Exotic Fruits Market Volume, By Country, 2018 – 2023 (Metric Tons) 113
TABLE NO. 62. : Middle East Exotic Fruits Market Volume, By Country, 2024 – 2032 (Metric Tons) 113
TABLE NO. 63. : Middle East Exotic Fruits Market Revenue, By Country, 2018 – 2023 (USD Million) 114
TABLE NO. 64. : Middle East Exotic Fruits Market Revenue, By Country, 2024 – 2032 (USD Million) 114
TABLE NO. 65. : Middle East Exotic Fruits Market Volume, By Type, 2018 – 2023 (Metric Tons) 115
TABLE NO. 66. : Middle East Exotic Fruits Market Volume, By Type, 2024 – 2032 (Metric Tons) 115
TABLE NO. 67. : Middle East Exotic Fruits Market Revenue, By Type, 2018 – 2023 (USD Million) 116
TABLE NO. 68. : Middle East Exotic Fruits Market Revenue, By Type, 2024 – 2032 (USD Million) 116
TABLE NO. 69. : Middle East Exotic Fruits Market Volume, By Distribution Channel, 2018 – 2023 (Metric Tons) 117
TABLE NO. 70. : Middle East Exotic Fruits Market Volume, By Distribution Channel, 2024 – 2032 (Metric Tons) 117
TABLE NO. 71. : Middle East Exotic Fruits Market Revenue, By Distribution Channel, 2018 – 2023 (USD Million) 118
TABLE NO. 72. : Middle East Exotic Fruits Market Revenue, By Distribution Channel, 2024 – 2032 (USD Million) 118
TABLE NO. 73. : Africa Exotic Fruits Market Volume, By Country, 2018 – 2023 (Metric Tons) 121
TABLE NO. 74. : Africa Exotic Fruits Market Volume, By Country, 2024 – 2032 (Metric Tons) 121
TABLE NO. 75. : Africa Exotic Fruits Market Revenue, By Country, 2018 – 2023 (USD Million) 122
TABLE NO. 76. : Africa Exotic Fruits Market Revenue, By Country, 2024 – 2032 (USD Million) 122
TABLE NO. 77. : Africa Exotic Fruits Market Volume, By Type, 2018 – 2023 (Metric Tons) 123
TABLE NO. 78. : Africa Exotic Fruits Market Volume, By Type, 2024 – 2032 (Metric Tons) 123
TABLE NO. 79. : Africa Exotic Fruits Market Revenue, By Type, 2018 – 2023 (USD Million) 124
TABLE NO. 80. : Africa Exotic Fruits Market Revenue, By Type, 2024 – 2032 (USD Million) 124
TABLE NO. 81. : Africa Exotic Fruits Market Volume, By Distribution Channel, 2018 – 2023 (Metric Tons) 125
TABLE NO. 82. : Africa Exotic Fruits Market Volume, By Distribution Channel, 2024 – 2032 (Metric Tons) 125
TABLE NO. 83. : Africa Exotic Fruits Market Revenue, By Distribution Channel, 2018 – 2023 (USD Million) 126
TABLE NO. 84. : Africa Exotic Fruits Market Revenue, By Distribution Channel, 2024 – 2032 (USD Million) 126

Request Free Sample

We prioritize the confidentiality and security of your data. Our promise: your information remains private.

Ready to Transform Data into Decisions?

Request Your Sample Report and Start Your Journey of Informed Choices


Providing the strategic compass for industry titans.

cr-clients-logos

Frequently Asked Questions

What is the current market size for the Global Exotic Fruits Market, and what is its projected size in 2032?

The market stands strong with rising global demand. [Include the Market Overview Here]. Growth projections indicate steady expansion toward 2032, driven by wider retail access and stronger international trade.

At what Compound Annual Growth Rate is the Global Exotic Fruits Market projected to grow between 2025 and 2032?

The market’s growth outlook reflects consistent momentum. [Include the Market Overview Here]. The CAGR highlights long-term opportunity supported by improved supply chains and healthier eating trends.

Which Global Exotic Fruits Market segment held the largest share in 2024?

The type segment linked to tropical fruits dominated the landscape. [Include the Market Overview Here]. Strong consumer preference and broad application support its leadership position.

What are the primary factors fueling the growth of the Global Exotic Fruits Market?

Health awareness, cleaner-label choices, and rising interest in diverse flavor profiles drive expansion. [Include the Market Overview Here]. Retail penetration and improved cold-chain networks further boost demand.

Who are the leading companies in the Global Exotic Fruits Market?

Key participants include Dole Plc, Specialty Fruit NV, Melissa’s/World Variety Produce, and Miami Fruit. [Include the Market Overview Here]. Their strong sourcing networks and broad portfolios sustain their competitive edge.

Which region commanded the largest share of the Global Exotic Fruits Market in 2024?

Asia Pacific held the leading position due to strong production bases. [Include the Market Overview Here]. High domestic consumption and export capability reinforce its dominance.

About Author

Rajdeep Kumar Deb

Rajdeep Kumar Deb

Lead Analyst – Consumer & Finance

Rajdeep brings a decade of consumer goods and financial services insight to strategic market analysis.

View Profile

Related Reports

Plant-Based Bioactives Market

Plant-Based Bioactives Market size was valued USD 4.5 billion in 2024 and is anticipated to reach USD 9.36 billion by 2032, at a CAGR of 9.6% during the forecast period.

Vitamins Market

Vitamins market was valued at USD 7.29 billion in 2024 and is anticipated to reach USD 11.89 billion by 2032, growing at a CAGR of 6.31 % during the forecast period.

Takeout Dinner Market

The Takeout Dinner market reached USD 270.23 billion in 2024 and is projected to grow to USD 440.55 billion by 2032, reflecting a CAGR of 6.3% during the forecast period.

Pyrolysis Oil Market

Pyrolysis Oil market size reached USD 1,808.5 million in 2024 and is expected to grow to USD 3,670.2 million by 2032, reflecting a CAGR of 9.25% during the forecast period.

Batter and Breader Premixes Market

The Batter and Breader Premixes Market reached USD 4,066.30 million in 2024 and is projected to grow to USD 6,193.33 million by 2032, registering a CAGR of 5.4% during the forecast period.

Food Waste Management Market

The Global Food Waste Management market reached USD 47.73 billion in 2024 and is projected to grow to USD 73.8 billion by 2032, supported by a 5.6% CAGR during the forecast period.

Middle East and Africa Fruit Concentrate Market

Middle East and Africa Fruit Concentrate Market size was valued at USD 3.19 Billion in 2024 and is anticipated to reach USD 5.2 Billion by 2032, at a CAGR of 6.3% during the forecast period.

Black Rice Market

Black Rice Market size was valued USD 9.35 billion in 2024 and is anticipated to reach USD 17.7 billion by 2032, at a CAGR of 8.3% during the forecast period.

Antifreeze Proteins Market

Antifreeze Proteins Market size was valued at USD 13.56 Billion in 2024 and is anticipated to reach USD 54.92 Billion by 2032, at a CAGR of 19.11% during the forecast period.

Wafer Biscuits Market

Wafer biscuits Market was valued at USD 40.37 billion in 2024 and is anticipated to reach USD 52.71 billion by 2032, growing at a CAGR of 3.39 % during the forecast period.

Modified Starch Market

Modified Starch Market size was valued USD 15.3 Billion in 2024 and is anticipated to reach USD 21.61 Billion by 2032, at a CAGR of 4.41% during the forecast period.

Vitamin & Mineral Premixes Market

Vitamin & Mineral Premixes Market size was valued USD 2.71 billion in 2024 and is anticipated to reach USD 4.85 billion by 2032, at a CAGR of 7.56% during the forecast period.

Licence Option

The report comes as a view-only PDF document, optimized for individual clients. This version is recommended for personal digital use and does not allow printing. Use restricted to one purchaser only.
$4999

To meet the needs of modern corporate teams, our report comes in two formats: a printable PDF and a data-rich Excel sheet. This package is optimized for internal analysis. Unlimited users allowed within one corporate location (e.g., regional office).
$6999

The report will be delivered in printable PDF format along with the report’s data Excel sheet. This license offers 100 Free Analyst hours where the client can utilize Credence Research Inc. research team. Permitted for unlimited global use by all users within the purchasing corporation, such as all employees of a single company.
$12999

Report delivery within 24 to 48 hours

Credence Staff 3

WILLIAM, North America

Support Staff at Credence Research

KEITH PHILLIPS, Europe

Lee - CR Sales Staff

LEE VALLANCE, Asia Pacific

Kieran Jameson

KIERAN JAMESON, Australia

Smallform of Sample request
User Review

Thank you for the data! The numbers are exactly what we asked for and what we need to build our business case.

Materials Scientist
(privacy requested)

User Review

The report was an excellent overview of the Industrial Burners market. This report does a great job of breaking everything down into manageable chunks.

Imre Hof
Management Assistant, Bekaert

cr-clients-logos

Request Sample